Comparison of FDG-18 Uptake and ADC Values in Thyroid Cancer
PET/MRI is a relatively recent diagnostic tool for the evaluation of oncologic disease. It combines the excellent soft tissue contrast of MRI with the physiologic data regarding glucose metabolism of PET. It has been described that ADC values may be useful in oncologic imaging, with development of central necrosis within a malignancy corresponding with increased ADC values. It has long been known that decreased FDG-avidity on PET imaging within a malignancy correlates with favorable response to treatment. With the increasing use of PET/MRI in oncologic imaging, changes in both ADC and FDG-avidity in malignancy can be evaluated with the same exam. ADC values and FDG-avidity in patients with thyroid cancer were evaluated to determine if a correlation between these two measurements existed. 11 patients with histopathologically proven papillary thyroid cancer that underwent PET/MRI imaging were evaluated. Of these, 3 patients had biopsy-proven disease with technically adequate ADC maps. A negative correlation between ADC values and FDG-avidity with soft tissue metastasis was observed, but not seen with bone metastasis
Introduction
PET/CT has become a well-established tool in evaluating various oncologic diseases, both in the initial diagnosis and staging of the patient, as well as in follow- up imaging to determine response to treatment [1, 2, 3]. This dual modality imaging combines the anatomic detail and localization provided by CT with the physiological information provided by PET, which leads to a synergistic effect that results in increased sensitivity and specificity of PET/CT compared to that of either PET or CT alone. Recently, there has been interest in evaluating ADC in oncology, regarding both the primary malignancy as well as metastatic foci such as lymph nodes. ADC values provide a quantitative analysis of the amount of restricted diffusion present within tissue, with highly cellular lesions restricting diffusion to a greater degree than loosely packed less dense lesions. In regards to oncology, and specifically regarding measuring the treatment effect on a malignancy, a highly cellular malignancy that goes on to necrosis after treatment will demonstrate decreased restricted diffusion and thus increased ADC values, [1, 4] which can be evaluated with MRI diffusion weighted imaging. Given that some malignant lesions can undergo necrosis in response to treatment, but may remain unchanged in overall size, this positive response to therapy can be appreciated with DWI when anatomic CT or MRI images have not yet demonstrated a change in size. It has been shown that a positive response to treatment is associated with an increased ADC value [5]. In terms of PET, a positive response to treatment is associated with a decreased SUV [2]. PET and DWI function entirely differently, with PET measuring the cell’s metabolic consumption of glucose, and DWI measuring the ability of water molecules in a cell to diffuse randomly, depicted by Brownian motion. Their ability to use physiological or functional data regarding malignant lesions is not dependent on changes in size.
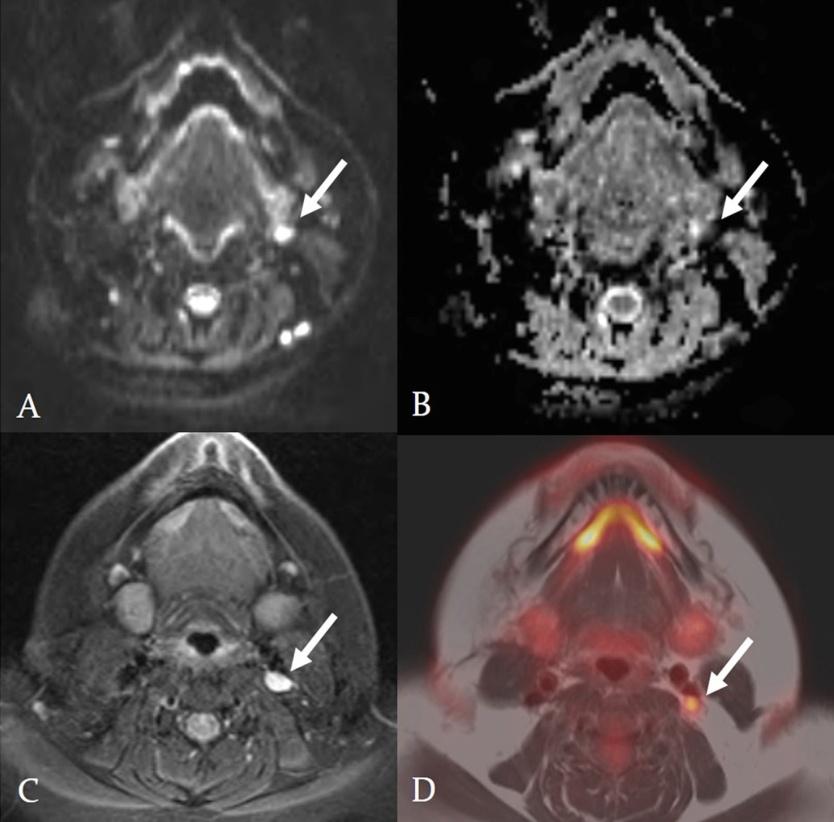
Figure 1: Diffusion-weighted image (A); Apparent coefficient map (B); axial T1-weighted image with gadolinium (C) and fused T1-weighted TSE and PET image (D). 1.1 x 0.7 cm lymph node at the left level 3 deep cervical chain that demonstrates abnormal metabolic activity, with an ADC mean value <1.2 × 10⁻³ mm2/s (0.713 <1.2 × 10⁻³ mm2/s), identified by white arrows.
The relatively recent development of PET/MRI has largely been relegated to research, but is slowly being introduced into clinical practice [6]. Although decreased SUV on PET and increased ADC on MRI are both correlated with favorable response to treatment, they both provide quantitative analysis of different variables and to our knowledge have never been formally compared in a research setting for the evaluation of thyroid metastasis. This short case series investigated the correlation of ADC values and SUV with respect to metastatic thyroid cancer in the head and neck. PET/CT has been validated in the evaluation of iodine non-avid thyroid carcinomas with elevated thyroglobulin levels [7, 8]. Due to its relatively recent introduction into clinical use, PET/MRI has not achieved similar validation with metastatic thyroid cancer. Thus, knowledge of the correlation of ADC values obtained with MRI and FDG- avidity obtained with PET regarding thyroid cancer may add another diagnostic tool that may result in better patient care.
Observations
11 consecutive patients from 2011-2015with biopsy- proven iodine non-avid papillary thyroid cancer that underwent imaging for restaging after treatment in a Siemens mMRPET/MRI system were retrospectively reviewed. Attenuation correction was performed with MRI data. The mean and minimum ADC1000 values were evaluated with a manually placed region of interest within the main tumor on every slice of the ADC1000 maps. The mean SUV (SUVmean) and maximum SUV (SUVmax) were measured for the entire tumor region of interest.
Patient
No. Sex Age Diagnosis PET/MR Findings Last Clinical Note / Biopsy
Findings
1 F 27 Papillary thyroid 1.1 x 0.7 lymph node at the left level 4 deep cervical Minimally increased FDG uptake corresponding to
2 F 31 Papillary thyroid
non-enlarged level 2 bilateral lymph nodes, non- specific
3 F 32 Papillary thyroid No abnormal metabolic activity Stable clinically 4 M 46 Papillary thyroid No abnormal metabolic activity Lost to follow-up 5 F 50 Papillary thyroid No abnormal metabolic activity Stable clinically
6 M 81 Papillary thyroid Ill-defined soft tissue at level of thyroid cartilage + biopsy of soft tissue for papillary thyroid carcinoma 7 F 41 Papillary thyroid No abnormal metabolic activity Clinically stable with mild increase in metabolic activity.
8 M 69 Papillary thyroid Abnormal metabolic activity in T2 vertebral body + biopsy of T2 for papillary
9 F 62 Papillary thyroid Abnormal metabolic activity in subcm left lung nodule
1.8 x 1.5 cm heterogeneous soft tissue mass in posterior to the right sternocleidomastoid muscle
10 M 75 Papillary thyroid
with avid increased metabolic activity Stable clinically thyroid carcinoma Suspicion for lung metastasis on chest CT, no biopsy available + biopsy of soft tissue for papillary thyroid carcinoma
- 11
- F
- 42 Papillary thyroid
- No abnormal metabolic activity
- Clinically stable
Table 1: Patient characteristics and demographics.
11 patients total were identified (Table 1): 7 were women and 4 were men. The ages ranged from 27-81, with a mean age 50.5 years. 100% of the tumors were non-iodine avid papillary thyroid cancers of the 11 patients that underwent PET/MRI, 6 out of 11 (54.5%) had no PET/MRI evidence of tumor metastasis. On medical follow-up, 4 out of 6 (66.7%) patients had no clinical evidence for recurrence (6-42 months, mean follow-up time of 24 months). 1 out of 6 (16.7%) patients was lost to follow-up since 2012 and 1 out of 6 (16.7%) patients had evidence of lung metastasis on follow- up imaging, although it was not biopsy-proven.5 out of 11 (45.5%) patients had suspicious findings for metastatic tumor on PET/MRI. 4 out of 5 (80%) patients had suspicious findings by PET/MRI that were biopsy- positive for papillary thyroid carcinoma. 3 out of 5 (60%) had viable ADC maps [Patient 1,6 and 8]. 1 out of 5 (20%) had unusable ADC maps due to significant susceptibility and ghosting artifact [Patient 10]. 1 out of 5 patients (20%) had suspicious PET/MRI findings but no biopsy or clinical follow-up was available to confirm the PET/MRI findings [Patient 9]. Location, ADC and SUV values of the 3 patients with biopsy-proven thyroid metastases and positive PET/MR [Patient 1, 6 and 8] are summarized in Table 2.
| Patient No. | Location of metastasis | SUVmax | SUVmean | ADCmin | ADCmean | ||||||||||||
| 1 | Left level 4 lymph node | 3.3 | 2.3 | 0.0073 | 0.713 | ||||||||||||
| 6 | Right neck superficial to thyroid cartilage | 5.98 | 4.1 | 0.001 | 0.609 | ||||||||||||
| 8 | Left T2 vertebral body | 15.3 | 4.6 | 0.001 | 1.042 |
Table 2: [INLINE_TABLE:2:0]
Discussion
Although the expected inverse linear correlation is seen in case 1 and 2 between SUV and ADC values, [4] this is not true for case 3, which drives the correlation of all three cases to R2 of 0.81. A literature search did not yield any information about expected ADC values in bone metastasis of thyroid carcinoma. In an article by [9] general bone metastasis mean ADC value was 0.69 × 10⁻³ mm2/sec, significantly lower than the value we observed. However, in a study by [5] bone marrow changes due to treatment with chemotherapy or administration of growth-colony factors can significantly alter the bone marrow ADC signal, making use of ADC values challenging in bone marrow metastasis evaluation. Similarly, FDG-avidity within bone marrow can often be altered by chemotherapy and bone marrow stimulating drugs, both commonly administered in cancer patients [10]. Thus, given the dynamic changes that can occur within the bone marrow which affects both the SUV and ADC values, comparison between soft tissue and osseous metastasis likely cannot be reliably obtained regarding cancer patients. ADC may be a useful tool in the evaluation of thyroid cancer metastasis, especially as this sequence becomes more prevalent in routine Oncological imaging. Although soft tissue metastases follow the expected inverse linear correlation between SUV and ADC values, bone metastasis in our study did not. Necrosis seen within metastatic lymph nodes is associated with favorable response to treatment. Thus decreased SUV along with increased ADC should be expected given that there are less metabolically active cells within necrotic tissue, and this less cellular tissue should have increased diffusivity. As PET/MRI becomes a more frequently used tool in thyroid oncologic imaging, attention to FDG-avidity in correlation to ADC values may provide better information regarding the disease status of the patient. Further evaluation with a larger cohort could validate these findings.
both pathology-proven thyroid cancer metastasis.
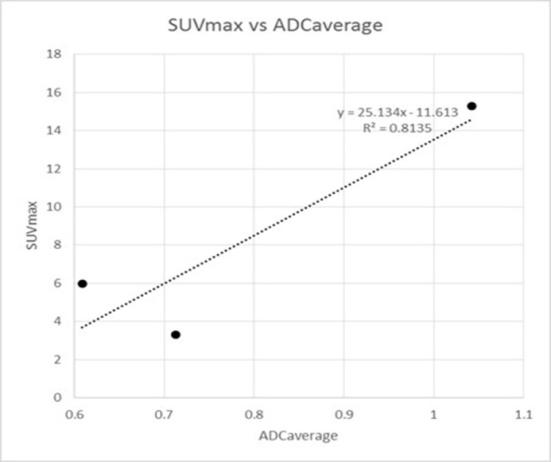
Figure 4: SUV max versus ADC mean for all 3 patients with abnormal metabolic activity on PET with corresponding ADC-DWI values. Patients 1 and 6, both with thyroid cancer metastasis to soft tissues demonstrate an inverse relationship between SUVmax and ADC average. However, patient 8 with thyroid cancer osseous metastasis demonstrates both increased SUVmax and ADC average compared to other patients.
References
-
Park SH, Chang KH, Song IC, Kim YJ, Kim SH, et al. (2000) Diffusion-weighted MRI in cystic or necrotic intracranial lesions. Neuroradiology 42(10): 716-721.
-
Ben-Haim S, Ell P (2009) 18F-FDG PET and PET/CT in the evaluation of cancer treatment response. J Nucl Med 50(1): 88-99.
-
Townsend DW (2008) Positron emission tomography/computed tomography. Semin Nucl Med 38(3): 152-166.
-
Choi SH, Paeng JC, Sohn CH, Pagsisihan JR, Kim YJ, et al. (2011) Correlation of 18F-FDG uptake with apparent diffusion coefficient ratio measured on standard and high b value diffusion MRI in head and neck cancer. J Nucl Med 52(7): 1056-1062.
-
Padhani AR, Koh DM, Collins DJ (2011) Whole-body diffusion-weighted MR imaging in cancer: current status and research directions. Radiology 261(3): 700-718.
-
Nensa F, Beiderwellen K, Heusch P, Wetter A (2014) Clinical applications of PET/MRI: Current status and future perspectives. Diagn IntervRadiol 20(5): 438- 447.
-
Shammas A, Degirmenci B, Mountz JM, McCook BM, Branstetter B, et al. (2007) 18F-FDG PET/CT in patients with suspected recurrent or metastatic well- differentiated thyroid cancer. J Nucl Med 48(2): 221- 226.
-
Agate L, Bianchi F, Giorgetti A, Sbragia P, Bottici V, et al. (2014) Detection of metastases from differentiated thyroid cancer by different imaging techniques (neck ultrasound, computed tomography and [18F]-FDG positron emission tomography) in patients with negative post-therapeutic 131I whole-body scan and detectable serum thyroglobulin levels. J Endocrinol Invest 37(10): 967-972.
-
Herneth AM, Philipp MO, Naude J, Funovics M, Beichel RR, et al. (2002) Vertebral Metastases: Assessment with Apparent Diffusion Coefficient. Radiology 225(3): 889-894.
-
Kazama T, Swanston N, Podoloff DA, Macapinlac HA (2005) Effect of colony-stimulating factor and conventional- or high-dose chemotherapy on FDG uptake in bone marrow. Eur J Nucl Med Mol Imaging 32(12): 1406-1411.
- Ultrasound Guided Therapeutic Nerve Blocks
- Cyclops Lesion Without ACL Reconstruction: A Rare Case in a Patient with Intact Anterior Cruciate Ligament and Tibial Plateau Fracture
- Dosimetric Comparison between Two Dose Calculation Algorithms in SBRT Treatment of Lung Cancer in Ring-based and C-arm Radiation Therapy Equipment
- Adolescent Testicular Adrenal Rest Tumors: A Case Report and Review of the Literature
- Giant Intrathoracic Lipoma: A Rare Presentation
- Image of a Right Renal Angiomyolipoma Complicated by Hemorrhage