Assessing Multiple Sclerosis Brain Plaques using SusceptibilityWeighted Imaging in Comparison with T2W and FLAIR
ntroduction: The aim of this study was to assess the potential of SWI in comparison with T2W and FLAIR sequences for evaluating the brain plaques in Multiple sclerosis. Materials and Methods: In this prospective study, the patients with confirmed diagnosis of MS were enrolled since June 2016 to January 2017. The primary collected data were age, gender, disease duration and Expanded Disability Status Scale (EDSS). All patients were undergone brain MRI consisting T2-wighted (T2W), fluid-attenuated inversion recovery (FLAIR) and susceptibility-weighted imaging (SWI) sequences. The number and volume of plaques were measured. Moreover, the detection of iron deposition and central veins in MS plaques were assessed by SWI. Results: 35 patients were enrolled and categorized into two groups based on their disease duration. 18 cases had more than 5 years’ disease duration (group 1) and 17 patients had less than 5 years’ disease duration (group 2). The age, gender and EDSS were not significantly different between groups. All obtained sequences showed fewer number of plaques as the disease duration was less (P<0.05). On the other hand, the calculated mean volume of plaques in obtained sequences was not different between groups. SWI has also the ability of detection iron deposition and central vein in MS plaques. Conclusion: The results of this study indicate that SWI is an additional sequence ,that together to usual MRI sequences, helps to characterize the white matter lesions detected by the conventional protocol, in multiple sclerosis diagnosis with superiority of detecting iron deposition and central veins.
Introduction
Multiple sclerosis (MS) is a chronic neurologic disorder which is characterized with reaction of immune system against central nervous system [1]. This disorder is the most prevalent non-traumatic disabling neurologic disorder in young adults that affected about 2 million around the world [2]. Although the etiology of this disorder is still unknown, it is believed that inflammatory and auto-immune processes mediated by lymphocytes are the initiator of multiple sclerosis [3]. In this procedure, active lymphocytes against neurologic system, cross the blood brain barrier and start the damaging processes [4, 5].
Magnetic resonance imaging (MRI) with early diagnosis of multiple sclerosis, determination of distribution of plaques and also differentiation of acute and chronic plaques has helped MS specialists. MRI has been changing to a usual method for determination of disorder activity and assessment of therapeutic response into standard clinical modalities and pharmaceutical trials [6]. T2-weighted sequence has high-sensitivity for detection of hyper intensities in white matter. This high signal in T2W could be due to wide range of pathologies including edema, mild demyelination and glial scars. Gadolinium enhancement in T1-wighted sequence prefers acute inflammation which is a marker of disease activity [7]. New MRI techniques including magnetization transfer ratio (MTR), spectroscopy (MRS), diffusion tensor imaging (DTI) and quantitative analysis of brain volume variations have additionally been utilized in MS patients for tracing of axons and neurons diffuse alterations. Nevertheless, these techniques have various limited specificities in relation to different pathologic elements of MS disorder [7, 8, 9]. This issue is called clinic-radiologic paradox [10, 11].
Primary reports have been promising about use of susceptibility-weighted imaging (SWI) in MS patients. SWI sequence is actually a technique that is fusing the resulting image of T2W star with image of filtered phase echo-gradient. Although T2W star sequence prepared limited susceptibility contrast previously, SWI shows susceptibility difference of tissues in an increased manner. SWI sequences could have applications in brain disorders and has gradually mentioned as routine clinical imaging. The limitation of this sequence is in quantitative assessment of magnetic susceptibility which has been faded by invention of quantitative susceptibility mapping and susceptibility tensor imaging techniques [10, 12].
Furthermore, SWI is a unique method for showing the tissues under iron deposition (in deoxy-hemoglobin, ferritin and hemosiderin forms). It has been indicated that SWI sequence can show plaques up to 50 percent more than usual combinatory techniques. In addition, the iron deposition that leads to visibility of MS plaque in SWI sequence has been quantitatively evaluated. The most iron-peak could be up to 60 micrograms in each gram of tissue. It is suggested that 1.5 tesla MRI in 100-pixel ROI has the ability to show 1 microgram iron deposition per each gram of brain tissue. This indicates that SWI sequence with 1.5 tesla MRI has the capability of iron deposition monitoring in different times [13].
The aim of this study was to evaluate the results of SWI sequence for evaluating the MS plaques in comparison with T2W and FLAIR sequences. In addition, the ability of SWI to detect iron deposition and central vein in MS plaques was assessed.
Materials and Methods
This is a prospective study which has been conducted from June 2016 to January 2017 in Babak imaging center, Tehran, Iran. This study has been in accordance with declaration of Helsinki and approved by ethic committee of Iran University of Medical Sciences, Tehran, Iran.The patients with diagnosis of multiple sclerosis fulfilling McDonald criteria [1] with at least one year passing from the initiation of their symptoms were included in this study after getting informed consent. The inclusion criteria were having McDonald criteria based on disease duration and location of plaques and minimally 1 year passed from initiation of the MS disorder. The exclusion criteria were presence of any contraindication for MRI imaging.
Firstly, the demographic data of patients including age, gender, disease duration and EDSS score were collected. Then, the patients were undergone brain MRI using 1.5 Tesla MRI apparatus (Siemens MAGNETOM Avanto 1.5T MRI system). The obtained MRI sequences were including 3D T1-weighted MPRAGE, axial T2W and FLAIR. The properties of SWI sequences were including slab of 64
slices with 2 mm thickness, no gap, FOV of 256 mm, acquisition matrix of 512 × 256, TR/TE of 85/35 ms and flip angle of 25°.
The number and location of plaques and also volume of plaques were calculated by MIPAV software with TOADS-CRUISE plug-in (http://www.nitrc.org/projects/ toads-cruise/) and were collected from all obtained sequences. Moreover, central vein detection and iron deposition leading to blooming artifact have been considered in SWI sequences. The collected data are presented as mean±standard deviation (SD) and number (percent). Statistical analyses have been conducted using From Jun 2016 to January 2017, 35 patients fulfilling inclusion criteria were enrolled in this study. 7 cases were male (20%) and 28 cases were female (80%). 18 patients had disease duration more than 5 years (3 males and 15 females, group 1). From 17 patients with disease duration less than 5 years (group 2), 4 cases were male and 13 cases were female Table 1. The mean age in group 1 was 29.5±5.44 years and mean age in group 2 was 29.52±5.18 years.
SPSS software version 21. P value less than 0.05 was considered as significant.
Results
| >5 years disease duration | >5 years disease duration | <5 years disease duration | ||||||||||||
| Variable | P-value | |||||||||||||
| (18 cases) | (18 cases) | (17 cases) | ||||||||||||
| Age | 29.5±5.44 | 29.52±5.18 | 0.987 | |||||||||||
| Gender | Male | 3 (16.7) | 4 (23.5) | |||||||||||
| Female | 15 (83.3) | 13 (76.5) | 0.466 | |||||||||||
| EDSS | 1-2 | 2 (11.1) | 4 (23.5) | 0.509 | ||||||||||
| 2.5-4 | 12 (66.7) | 11 (64.7) | ||||||||||||
| 4.5-6 | 4 (22.2) | 2 (11.8) | ||||||||||||
| Mean±SD | 3.63±1.23 | 3.11±0.91 | 0.167 |
Table 1: Demographic data of enrolled cases.
In the group of patients with more than 5 years’ disease duration, 2 cases had EDSS 1 to 2, 12 cases had EDSS 2.5 to 4 and 4 cases had EDSS 4.5 to 6. These values for the patients with less than 5 years’ disease duration were 4 for EDSS 1 to 2, 11 for EDSS 2.5 to 4 and 2 for EDSS 4.5 to 6. There was no difference in terms of gender, age and EDSS between groups.
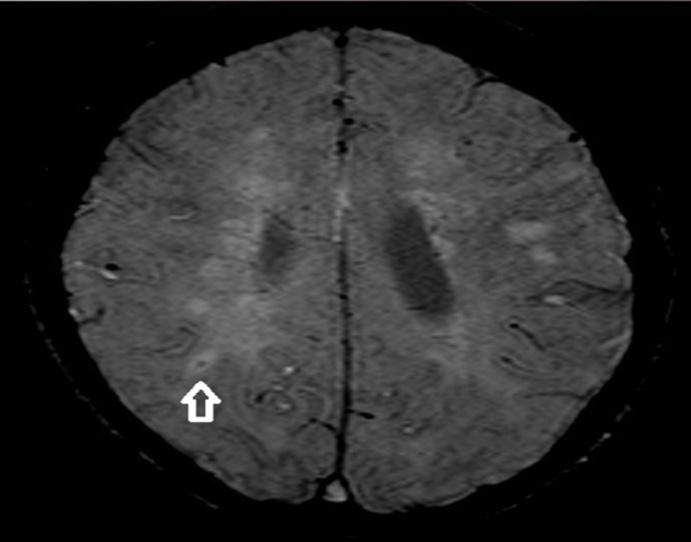
Three different MRI sequences (T2W, FLAIR and SWI) were evaluated for each patient. The number of detected plaques and also mean volume of plaques for each patient were calculated in all three sequences. The number and mean volume of plaques categorized based on duration of MS disorder are summarized in Table 2. Mean number of detected plaques in patients with more than 5 years’ disease duration were 23.16±6.19 in T2W sequences, 22.83±6.07 in FLAIR sequences and 22.83±6.31 in SWI sequences. However, the numbers of plaques in patients with less than 5 years’ disease duration were 13.76±5.64, 13.58±5.38 and 13.47±5.27 in T2W, FLAIR and SWI sequences, respectively. All types of MRI sequences used in this study showed that there are significantly higher numbers of plaques in patients with more than 5 years’ disease duration than cases with less than five years’ disease duration (P<0.0001). Nevertheless, comparing the calculated volume of plaques between two groups using different sequences showed that there is no difference between groups. Furthermore, calculating the numbers of plaques and also the mean volume of plaques using SWI sequences indicated that this type of MRI technique has similar power with T2W and FLAIR in detecting MS plaques and also capability for calculating of MS plaque volume. Furthermore, SWI has superiority than T2W and FLAIR, as iron deposition in MS plaques and also presence of central vein in plaques could be easily assessed by this MRI technique. Therefore, we measured the number of plaques with iron deposition and also the presence of central vein in plaques by using SWI sequences. The number of plaques with iron deposition was measured in SWI images. As it is presented in Table 2, in >5 years’ duration group, no iron deposition was detected in 11 cases, 1 patient had 2 plaques with iron deposition, 3 patients had 3 and 3 patients had 4 plaques with iron deposition. In patients with <5 years’ disease duration, 8 cases had no deposition and the number of plaques with iron deposition in 2 cases was 1, in 4 cases was 2, in 2 cases was 3 and in 1 case was 4. Additionally, SWI sequences detected central vein Figure 1 in 15 patients with >5 years’ disease duration and in 16 patients with <5 years’ disease duration (P>0.05, Table 2).
| >5 years disease duration | <5 years disease duration | |||||||||||
|---|---|---|---|---|---|---|---|---|---|---|---|---|
| Variables | P-value | |||||||||||
| (18 cases) | (17 cases) | |||||||||||
| Mean Number of Plaques in T2W | 23.16±6.19 | 13.76±5.64 | <0.0001 | |||||||||
| Mean Number of Plaques in FLAIR | 22.83±6.07 | 13.58±5.38 | <0.0001 | |||||||||
| Mean Number of Plaques in SWI | 22.83±6.31 | 13.47±5.27 | <0.0001 | |||||||||
| Mean Volume of Plaques in T2W | Mm3 | 16347.66±6505.11 | 12601.52±5298.01 | 0.072 | ||||||||
| Mean Volume of Plaques in FLAIR | mm3 | 16013.66±6505.11 | 12267.52±5298.01 | 0.072 | ||||||||
| Mean Volume of Plaques in SWI | mm3 | 16496.66±6505.11 | 12750.52±5298.01 | 0.072 | ||||||||
| Detected Plaques with Iron Deposition by SWI | 0 | 11 (61.2) | 8 (47.1) | 0.244 | ||||||||
| 1 | 0 | 2 (11.8) | ||||||||||
| 2 | 1 (5.6) | 4 (22.4) | ||||||||||
| 3 | 3 (16.6) | 2 (11.8) | ||||||||||
| 4 | 3 (16.6) | 1 (5.9) | ||||||||||
| mean±SD | 1.27±1.7 | 1.17±1.33 | 0.847 | |||||||||
| Detection of Central Veins in SWI | Yes | 15 patients (83.3) | 16 patients (94.1) | 0.323 | ||||||||
| No | 3 patients (16.7) | 1 patient (5.9) |
Table 2: Measured variables from obtained MRI sequences.
Discussion
In this prospective study, we assessed the potential of SWI sequences of MRI for detection and evaluation of MS plaques in patients with short (<5) and long (>5) term disease duration in comparison with usual MRI techniques including T2W and FLAIR sequences.
The demographic data of enrolled patients showed mean age of being young adult and also superiority of females. These results are similar with results of epidemiologic studies about MS which have shown high prevalence of MS in young adults and females [14].
To compare the power of SWI to detect MS plaques with T2W and FLAIR, the numbers of plaques were measured in each MRI sequence for cases. The results showed that SWI has similar capability for detection of MS plaques as T2W and FLAIR. Previous studies showed high potency of SWI in detecting MS lesions compared to conventional methods. As an example in the study by Haacke et al, from a total of 422 lesions, 143 lesions were detected by SWI which were not detectable with T2W and FLAIR sequences. On the other hand, 75 lesions were detectable with conventional sequences whereas they could not have detected by SWI [13].
Software analyses of MRI sequences provide the capability of monitoring disease progression in MS patients [15]. We calculated the volume of MS lesions in all obtained MRI sequences. Here, we showed that SWI has similar ability like T2W and FLAIR sequences for measuring the volume of MS lesions. These results have not shown significant relation between volume of MS plaques and duration of disease.
The other evaluated parameters in this study were detection of iron deposition and central veins in MS lesions using SWI sequences. We showed that SWI detected iron deposition in 16 patients and also central veins were detected in 31 cases out of 35. It has been indicated that accumulation of iron in brain has relationship with clinical prognosis of patients with MS [16, 17]. Therefore, the presence of a powerful imaging technique for detecting of iron deposition is crucial for follow-up of MS patients. SWI technique has showed promising results for detection of iron depositions in different studies [7, 9, 11]. However, there are some limitations with SWI-filtered imaging for detecting iron changes in brain. Deoxygenated blood, myelin and calcium phosphates could interfere with iron sensitivity of this method [18]. Moreover, different types and structures of deposited iron could not be distinguished by SWI, as they have different impacts on the brain [13].
The usual formation of inflammatory demyelinating white matter lesions around small veins is a valuable marker for confirming the diagnosis of MS [19, 20]. So the capability of SWI in detection of central veins in MS lesions would be so beneficial. We here showed that more than 85% of evaluated SWI sequences confirmed the presence of central vein in demyelinating lesions which is approving MS diagnosis.
Conclusion
SWI at least has similar power for detection of MS lesions as T2W and FLAIR. Moreover, the capability of SWI in detection of iron deposition and central veins is so valuable for confirmation and monitoring of MS disorder. We also indicated that the number of MS plaques could be a useful marker for predicting the duration of MS. Sensitivity in the diagnosis of multiple sclerosis using classical protocols with MRI sequences (T2, FLAIR, DP, T1 after gadolinium) is very high, but there are nonspecific findings that can be misinterpreted and lead to false positives, SWI providing an additional valuable information for the diagnosis of CNS pathology, particularly for debugging the differential diagnosis of lesions of multiple sclerosis respect to other lesions of white matter nonspecific , especially in subcortical distribution.
References
-
Coyle PK (2010) The role of natalizumab in the treatment of multiple sclerosis. The American journal of managed care 16(6): 164-170.
-
Jones JL, Coles AJ (2010) New treatment strategies in multiple sclerosis. Experimental neurology 225(1): 34-39.
-
Weiner HL (2004) Multiple sclerosis is an inflammatory T-cell–mediated autoimmune disease. Archives of Neurology 61(10): 1613-1615.
-
Kieseier BC, Hartung HP (2007) Interferon-β and neuroprotection in multiple sclerosis—Facts, hopes and phantasies. Experimental neurology 203(1): 1-4.
-
Liu GZ, Fang LB, Hjelmström P, Gao XG (20070 Increased CD8+ central memory T cells in patients with multiple sclerosis. Multiple Sclerosis 13(2): 149- 155.
-
Bozin I, Ge Y, Kuchling J, Dusek P, Chawla S, et al. (2015) Magnetic resonance phase alterations in multiple sclerosis patients with short and long disease duration. PLoS one 10(7): e0128386.
-
Zivadinov R, Dwyer M, Markovic PS, Hayward B, Bergsland N, et al. (2015) A pilot, longitudinal, 24- week study to evaluate the effect of interferon beta- 1a subcutaneous on changes in susceptibility- weighted imaging-filtered phase assessment of lesions and subcortical deep-gray matter in relapsing–remitting multiple sclerosis. Ther Adv Neurol Disord 8(2): 59-70.
-
Maggi P, Mazzoni LN, Moretti M, Grammatico M, Chiti S, et al. (2015) SWI enhances vein detection using gadolinium in multiple sclerosis. Acta Radiol open 4(3): 2047981614560938.
-
Hagemeier J, Weinstock GB, Bergsland N, Heininen BM, Carl E, et al. (2012) Iron deposition on SWI- filtered phase in the subcortical deep gray matter of patients with clinically isolated syndrome may precede structure-specific atrophy. American Journal of Neuroradiology 33(8): 1596-1601.
-
Hagemeier J, Heininen BM, Poloni GU, Bergsland N, Magnano CR, et al. (2012) Iron deposition in multiple sclerosis lesions measured by susceptibility‐weighted imaging filtered phase: A case control study. J Magn Reson Imaging 36(1): 73-83.
-
Habib CA, Liu M, Bawany N, Garbern J, Krumbein I, et al. (2012) Assessing abnormal iron content in the deep gray matter of patients with multiple sclerosis versus healthy controls. AJNR Am J Neuroradiol 33(2): 252-258.
-
Manova ES, Habib CA, Boikov AS, Ayaz M, Khan A, et al. (2009) Characterizing the mesencephalon using susceptibility-weighted imaging. AJNR Am J Neuroradiol 30(3): 569-574.
-
Haacke EM, Makki M, Ge Y, Maheshwari M, Sehgal V, et al. (2009) Characterizing iron deposition in multiple sclerosis lesions using susceptibility weighted imaging. J Magn Reson Imaging 29(3): 537- 544.
-
Rojas JI, Patrucco L, MIguez J, Sinay V, Cassara FP, et al. (2017) Gender ratio trends over time in multiple sclerosis patients from Argentina. J Clin Neurosci 38: 84-86.
-
Louapre C, Bodini B, Lubetzki C, Freeman L, Stankoff B (2017) Imaging markers of multiple sclerosis prognosis. Curr Opin Neurol 30(3): 231-236.
-
Radaideh AAM, Wharton SJ, Lim SY, Tench CR, Morgan PS, et al. (2013) Increased iron accumulation occurs in the earliest stages of demyelinating disease: an ultra-high field susceptibility mapping study in Clinically Isolated Syndrome. Multiple Sclerosis Journal 19(7): 896-903.
-
Hagemeier J, Yeh EA, Brown MH, Bergsland N, Dwyer MG, et al. (2013) Iron content of the pulvinar nucleus of the thalamus is increased in adolescent multiple sclerosis. Multiple Sclerosis Journal 19(5): 567-576.
-
Langkammer C, Schweser F, Krebs N, Deistung A, Goessler W, et al. (2012) Quantitative susceptibility mapping (QSM) as a means to measure brain iron? A post mortem validation study. Neuroimage 62(3): 1593-1599.
-
Sati P, Thomasson D, Li N, Pham DL, Biassou NM, et al. (2014) Rapid, high-resolution, whole-brain, susceptibility-based MRI of multiple sclerosis. Mult Scler 20(11): 1464-1470.
-
Absinta M, Sati P, Gaitán MI, Maggi P, Cortese I, et al. (2013) Seven‐tesla phase imaging of acute multiple sclerosis lesions: A new window into the inflammatory process. Ann Neurol 74(5): 669-678.
- Ultrasound Guided Therapeutic Nerve Blocks
- Cyclops Lesion Without ACL Reconstruction: A Rare Case in a Patient with Intact Anterior Cruciate Ligament and Tibial Plateau Fracture
- Dosimetric Comparison between Two Dose Calculation Algorithms in SBRT Treatment of Lung Cancer in Ring-based and C-arm Radiation Therapy Equipment
- Adolescent Testicular Adrenal Rest Tumors: A Case Report and Review of the Literature
- Giant Intrathoracic Lipoma: A Rare Presentation
- Image of a Right Renal Angiomyolipoma Complicated by Hemorrhage