Pictorial Review of Hepatic Steatosis on MRI, CT and Ultrasound
Fatty liver disease or hepatic steatosis affects more than three million people in the U.S. every year. It is one of the most common abnormalities of the liver seen on ultrasound, CT and MRI. The most common conditions of hepatic steatosis are alcoholic liver disease and nonalcoholic fatty liver disease. Rare conditions that can cause fatty liver disease include dietary and nutritional abnormalities and congenital disorders. Common patterns of fat deposition in the liver include diffuse fat deposition, focal deposition and focal sparing, multifocal deposition, perivascular deposition and subcapsular deposition. All these patterns involve nonuniform distribution of fat. Diagnosing fatty liver can often be difficult because there are no early signs of clinical symptoms and physical exam findings. Clinical history of alcohol consumption, drug use, hyperlipidemia, obesity, known hepatitis infection and other health conditions can aid in making the diagnosis of fatty liver disease. Ultrasound, CT and MRI can be used to make a diagnosis of fatty liver disease. These imaging modalities can help determine the amount of fat in the liver and the severity of the fatty liver disease. Knowledge of the typical imaging findings of fatty liver disease is important for the radiologist to differentiate from other differential diagnostic conditions.
Aren Shah1*, Jiani Hu2 and Jing Shen3
Keywords: MRI; CT; Ultrasound; Hepatic Steatosis; Fat Accumulation
Introduction
Hepatic steatosis or fatty liver disease is the most common cause of chronic liver disease. It is important for radiologists to recognize the imaging patterns of hepatic steatosis early in order to minimize the progression to liver cirrhosis [1]. While the diagnosis of fatty liver is typically straightforward, fat accumulation patterns in the liver can be confused with a neoplastic, inflammatory, or vascular condition [2]. Imaging technologies have increased the accuracy of the diagnosis of this disease. This article provides a review of the risk factors, pathophysiologic and imaging appearances of fat accumulation in the liver. In addition, the authors describe the advantages and disadvantages of using MRI, CT and ultrasound imaging in the diagnosis of fatty liver disease as well as review the diagnostic accuracy and practical application of each imaging modality.
Learning Objectives
After reading this article and taking the test, the reader will be able to:
- Recognize the imaging features of fat accumulation in the liver
- Understand the advantages and disadvantages of each imaging modality in diagnosing fatty liver disease
- Understand the diagnostic accuracy and practical applications of each imaging modality in the diagnosis of hepatic steatosis
Risk Factors and Pathophysiology
Hepatic steatosis is a broad term used to describe the accumulation of at least 5% of fat without ballooning. The most common conditions of hepatic steatosis are alcoholic liver disease and nonalcoholic fatty liver disease. Alcoholic liver disease is due to excessive alcohol consumption while nonalcoholic fatty liver disease is due to insulin resistance and metabolic syndrome. Other causes of hepatic steatosis include obesity, viral hepatitis and the use of particular drugs. Rare conditions that can cause fatty liver disease include dietary and nutritional abnormalities and congenital disorders. Refer to Table 1 to learn more about the conditions associated with fatty liver disease. In all these conditions, the cause of fatty liver disease is triglyceride accumulation within the cytoplasm of hepatocytes which alters the hepatocellular lipid metabolism. Hepatocytes in the center of the lobule, near the central vein, are vulnerable to metabolic stress and tend to accumulate lipids earlier than those in the periphery, usually around the central veins and less pronounced around the portal triads. In more advanced fatty liver disease, the entire lobule contains relatively uniform involvement.
Although the term fatty infiltration of the liver is commonly used to describe fat deposition, the term can be misleading because fat deposition indicates triglyceride droplets in hepatocytes almost always and rarely in other cell types. Since fatty liver and hepatic steatosis are considered more appropriate terms, they will be used in this article [2].
| Most Common | Common | Rare |
|---|---|---|
| Excessive alcohol consumption | Drug Use | Starvation |
| Obesity | Hepatitis B | Weight Loss |
| Hyperlipidemia | Hepatitis C | Dietary abnormality |
| Insulin resistance | Iatrogenic injury |
Prevalence of Fatty Liver
The prevalence of nonalcoholic fatty liver is higher for individuals with hyperlipidemia and obesity. In the general population, the prevalence of nonalcoholic fatty liver disease is about 15%. The prevalence of alcoholic fatty liver disease in individuals who consume more than 60 g of alcohol per day, is approximately 45%. Patients with hyperlipidemia have a 50% prevalence. The prevalence of heavy alcohol drinkers with obesity is 95% [2].
Imaging-based Diagnosis of Fatty Liver
Although liver biopsy is the standard in diagnosing fatty liver, MRI, CT and ultrasound can also be used to make the diagnosis.
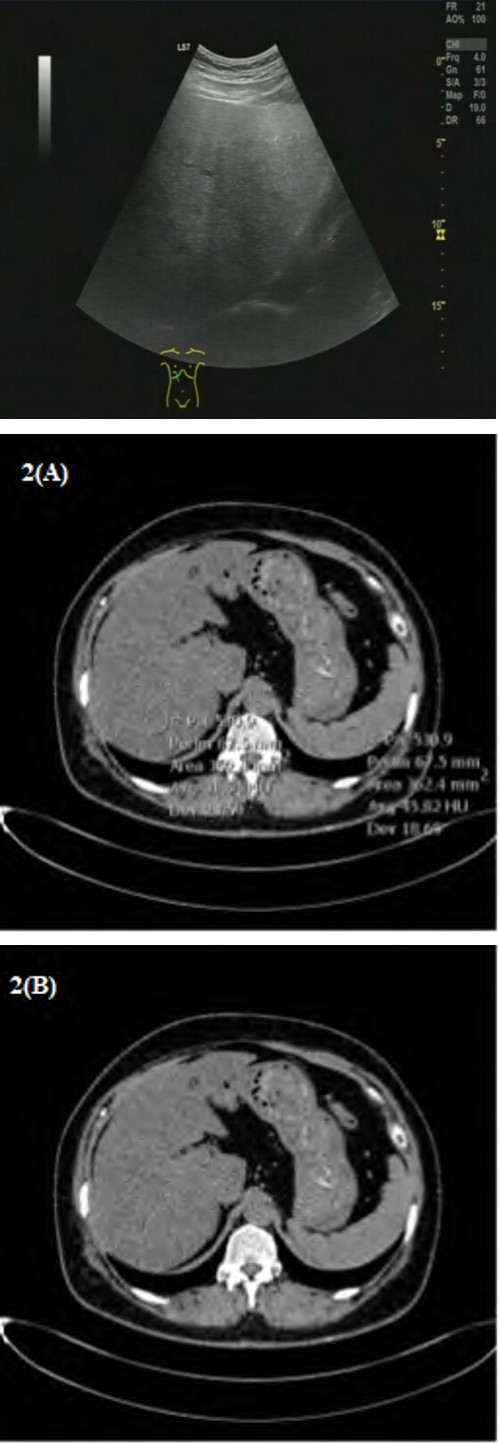
Diagnosis at Ultrasound
In detecting fatty liver disease, radiologists commonly use ultrasound imaging, which is more accessible and more cost-effective compared to other imaging modalities. On ultrasound, fatty liver may be diagnosed if the echogenicity of the liver exceeds that of the renal cortex and spleen [2]. Ultrasound has many advantages including portability and ease of use. Hepatic steatosis can be classified using B-mode images by assessing liver echogenicity, conspicuity of hepatic vasculature, fat sparing and liver parenchyma [3]. Ultrasound imaging has a pooled sensitivity of 84.8% and specificity of 93.6% in detecting moderate to severe steatosis [4]. However, ultrasound may not be as useful when detecting mild steatosis as it has a lower sensitivity rate [4]. When all cases of steatosis were considered, the sensitivity ranged from 53.3% to 66.6% and the specificity ranged from 77.0% to 93.1%. One of the disadvantages of ultrasound imaging is that it cannot clearly display deep portions of the liver and diaphragm [5]. Another major disadvantage of ultrasound imaging is that it has low reliability since it can be subjective to the observer. The intra-and inter-observer agreements of 54.7%-67.9% and 47.0%-63.7% from 168 U.S. examinations show the lack of consistent diagnostic consistency [6]. Ultrasound imaging is also more qualitative consisting of measurements between the liver and kidneys and echo penetration [6]. The drawback of qualitative measurements is that they cannot easily account for small changes in the progression of steatosis. However, new computer-assisted ultrasound techniques can use software programs to accurately examine echo amplitude and attenuation. The computerized hepatorenal index demonstrated higher sensitivities of 92.7% and 100% and higher specificity of 91% and 92.5% [6]. When trying to detect moderate to severe steatosis, ultrasound may be more effective. However, ultrasound may not be adequate enough when detecting mild steatosis.
Diagnosis at CT
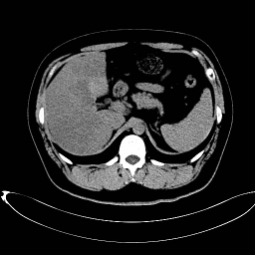
Unenhanced CT imaging is another common modality for fatty liver disease, which can be detected with accuracy in Clinical History: 54-year-old female with abdominal pain.
moderate to severe steatosis. Non-contrast CT can diagnose fatty liver disease when the liver attenuation is lower than 10 Hounsfield Units (HU) than the spleen or lower than 40 HU [7]. An example is shown in Figures 2 and 3. Contrast- enhanced CT is not as reliable for the diagnosis of fatty liver due to the differences between the appearance of the liver and that of the spleen overlap between normal and abnormal attenuation value ranges depending on the timing of contrast-enhancement and imaging technique [2]. However, fatty liver disease can be diagnosed on contrast-enhanced CT if the attenuation is less than 40 HU, but this threshold has limited sensitivity [2]. Advantages of CT for diagnosis of fatty liver include fast acquisition, straightforward analysis and quantitative results. CT can be useful in certain clinical settings, such as evaluating hepatic donor candidates [6]. CT uses tissue density and calibration, which can yield different results depending on the manufacturer and scanner [8]. A major disadvantage of CT is that it is not accurate in detecting mild hepatic steatosis. The diagnostic sensitivity ranges from 52% to 62% for diagnosing mild steatosis with a fat fraction between 10% to 20% [8]. Another disadvantage is that CT attenuation can be affected by co-founding factors, such as edema, iron, copper and glycogen. Additionally, CT poses a radiation hazard, which makes it an unsuitable modality for long-term monitoring of patients [6].
Figure 2A&2B: Shown are CT images of the liver with and without HU measurements. The liver HU was 31 and the spleen HU was 45. Since the HU difference between the spleen and liver is greater than 10 HU, the diagnosis of fatty liver can be made. Additionally, since the liver attenuation is less than 40 HU, this also is indicative of fatty liver.
Clinical History: 32-year-old male with abdominal pain.
Clinical History: 37-year-old female with abdominal pain.
Diagnosis at MRI
MRI can be highly effective in diagnosing hepatic steatosis as it can accurately measure the amount of hepatic fat by using signal and/or the proton density fat fraction. Using the in-phase and out-of-phase signal intensity values of the liver and spleen, one can use a mathematical formula to diagnose hepatic steatosis [5]. In a normal liver, the signal intensity values are similar on both in-phase and out-of- phase images [2]. A signal intensity loss on the out-of- phase images compared to the in-phase images can signal hepatic steatosis with the loss difference indicating the severity of this condition [2]. An example of this is shown in Figure 4. Disadvantages of MRI include the high cost and long examination time. Another drawback of MRI is that measurements can be affected by motion and parallel image artifacts, which can negatively impact the measurement accuracy within place ROIs (Region of Interests) [8]. In detecting histologic steatosis, the MRI sensitivities are between 76.7%-90% and the specificities are between 87.1%- 91% [6]. Although proton MR spectroscopy is most accurate, it does not generate anatomic images [9]. MRI scanning can evaluate steatosis objectively with the quantitative index.
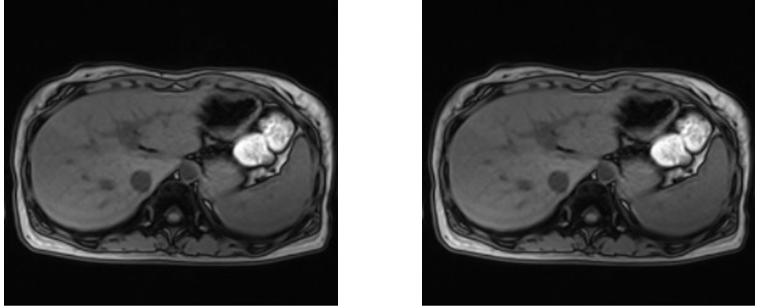
In-phase out-phase Figure 4: Shown is a marked decrease in the signal intensity of the liver on the out-of-phase MR image (Figures 4B) compared with that on the in-phase MR image (Figure 4A). On MRI, a fat fraction greater than 5% is considered abnormal and consistent for fatty liver disease. A fat fraction can be calculated by using this formula: (In-phase signal intensity value (SIV) - Out-of- Phase SIV) / (2 * In-phase SIV) (1). In this case shown, the fat fraction was 11.51%, which indicates fatty liver.
Patterns of Fat Deposition
Diffuse Deposition
Diffuse fat deposition is the most common form of fatty liver disease encountered. Fat accumulation occurs homogeneously throughout the liver. Quantification maps can determine the severity of the fat accumulation [10].
Focal Deposition and Focal Sparing
Focal fat deposition and focal fat sparing are less common patterns. These patterns usually occur in specific areas such as adjacent to the falciform ligament or ligamentum venosum, in the porta hepatis and in the gallbladder fossa. Although the reason for the distribution is still not fully known, researchers have attributed the distribution to variant venous circulation [11]. The diagnosis of focal fat deposition and focal fat sparing can be more difficult than homogeneously diffuse fat deposition because imaging findings can resemble mass lesions [2]. Common characteristics of focal fat accumulation are that it does not have a mass effect on blood vessels and it typically shows wedge-shaped margins [2]. Patterns of fatty liver deposition and sparing involve the vascular anatomical variants, including the capsular veins and the peribiliary veins. The aberrant venous drainage system without portal inflow can cause haemodynamic anomalies that can lead to focal fatty liver deposition and sparing [12].
Multifocal Deposition
Multifocal deposition, indicated by multiple fat foci randomly scattered in the liver, is an unusual pattern of fatty liver disease [13]. Fat foci can have a round or oval shape and can mimic nodules. Signs of multifocal fat deposition include a lack of mass effect and stability in size over time. A differential diagnosis on CT and ultrasound may be necessary, but MRI is usually required for a diagnosis [13]. The pathogenesis of multifocal fat deposition is still unknown, except for fat deposition in regenerative cirrhotic nodules [2].
Perivascular Deposition
Perivascular deposition, characterized by halos of fat that surround hepatic and/or portal veins, is a rare pattern in fatty liver patients. In making this diagnosis, MRI is useful as it can show signal intensity loss on in-phase and out-of- phase images [14]. The pathogenesis of perivascular fat deposition is still unknown.
Subcapsular Deposition
Subcapsular deposition, characterized by small fat nodules or as a confluent peripheral region of fat in the subcapsular portion of the liver, can be seen in insulin- dependent diabetes patients and in patients with renal failure [12]. Medical history is helpful for accurately diagnosing subcapsular deposition.
Differential Diagnosis
Although diagnosing fatty liver is often straightforward, unusual patterns of fat deposition may require a differential diagnosis, which is listed below.
Primary Lesions and Hypervascular Metastases
Primary hepatic lesions (e.g. hepatocellular cancer, hepatic adenoma and focal nodular hyperplasia) and metastatic lesion are similar because they both exert a mass effect, show vivid or heterogeneous enhancement after contrast and may contain areas of hemorrhage or necrosis [2]. Focal or multifocal fat accumulation of the liver does not cause mass effect.
Hypovascular Metastases and Lymphoma
Although differentiating between focal or multifocal fat deposition from hypovascular metastases and lymphoma is difficult, lesion morphology, location and microscopic fat content, restricted diffusion and absence of vascular distortion are useful tools to make a diagnosis. The amount of intralesional fat can be found using chemical shift GRE imaging [2].
Perfusion Anomalies
Although perfusion anomalies cannot be detected on unenhanced images or equilibrium phase images, they are visible during the arterial and portal venous phases after contrast and can resemble fat deposition morphologically [2].
Periportal Abnormalities
The differential diagnosis on ultrasound and CT of periportal fat deposition includes a wide range of conditions: edema, inflammation, hemorrhage and lymphatic dilatation [2]. Edema, inflammation and lymphatic dilation typically affect the portal triads symmetrically. Hemorrhage that involves the portal triads are characteristically asymmetric and can be associated with laceration or injury [2]. None of these conditions are associated with microscopic fat. Signal loss on out-of-phase imaging allows for the correct diagnosis of fat deposition.
Conclusion
Fatty liver disease is a common imaging finding with a prevalence ranging from 15% to 95% based on alcohol consumption and/or health factors. Ultrasound imaging is an effective technique to accurately detect moderate to severe steatosis. Even though ultrasound has a low sensitivity rate to mild steatosis and is more subjective, ultrasound is widely available and cost-effective. CT may be less effective due to the inaccuracy in detecting mild steatosis. Also, the radiation dose to the patient could make multiple CT imaging unsuitable for long-term monitoring of patients. Although MRIs are more expensive, the results are more reproducible and have higher accuracy rates. Diffuse deposition is one of the most common imaging patterns of fatty liver. Focal deposition, diffuse deposition with focal sparing and multifocal deposition are less common. Assessing fat content, location, mass effect and morphologic features are important features for a correct diagnosis of hepatic steatosis.
References
-
Cleveland Clinic (2021) Fatty Liver Disease: Risk Factors, Symptoms, Types & Prevention.
-
Décarie P, Lepanto L, Billiard J, Olivié D, Lavallée J M, et al. (2011) Fatty liver deposition and sparing: a pictorial review. Insights Imaging. 2(5): 533-538.
-
Pirmoazen A, Khurana A, El Kaffas A, Kamaya A (2020) Quantitative ultrasound approaches for diagnosis and monitoring hepatic steatosis in nonalcoholic fatty liver disease. Theranostics 10(9): 4277-4289.
-
Hernaez R, Lazo M, Bonekamp S, Kamel I, Frederick LB, et al. (2011) Diagnostic accuracy and reliability of ultrasonography for the detection of fatty liver: A meta- analysis. Hepatology. 54(3): 1082-1090.
-
Gaillard F (2021) Diffuse hepatic steatosis. Radiopaedia. org
-
Lee S, Park SH (2014) Radiologic evaluation of nonalcoholic fatty liver disease. World J Gastroenterol 20(23): 7392-7402.
-
Wells M, Li Z, Addeman B, McKenzie CA, Mujoomdar A, et al. Computed Tomography Measurement of Hepatic Steatosis: Prevalence of Hepatic Steatosis in a Canadian Population. Can J Gastroenterol Hepatol 2016: 1-7.
-
Zhang Y, Fowler K, Hamilton G, Jennifer Y Cui , Ethan Z Sy, et al. (2018)Liver fat imaging-a clinical overview of ultrasound, CT and MR imaging. Br J Radiol 91(1089): 20170959.
-
Cassidy F, Yokoo T, Aganovic L, Robert FH, Mark B, et al. (2009) Fatty Liver Disease: MR Imaging Techniques for the Detection and Quantification of Liver Steatosis. RadioGraphics 29(1): 231-260.
-
Paige Fowler (2021) Fatty Liver Disease: Alcoholic and Non-Alcoholic Types. WebMD.
-
Gabata T, Matsui O, Kadoya M, Ueda K, Kawamori Y, et al. (1997) Aberrant gastric venous drainage in a Focal SPARED area of Segment IV in Fatty Liver: Demonstration with color DOPPLER SONOGRAPHY. Radiology 203(2): 461-463.
-
Décarie P, Lepanto L, Billiard J, Olivié D, Lavallée JM, et al. (2011) Fatty liver deposition and sparing: a pictorial review. Insights Imaging. 2(5): 533-538.
-
Kröncke TJ, Taupitz M, Kivelitz D, Daberkow U, Rudolph B, et al. (2000) Multifocal nodular fatty infiltration of the liver Mimicking metastatic disease on CT: IMAGING findings and diagnosis using MR imaging. European Radiology 10(7): 1095-1100.
-
Hamer OW, Diego A Aguirre, Giovanna Casola, Claude B Sirlin (2005) Imaging features of perivascular Fatty infiltration of the Liver: Initial observations. Radiology 237(1).
- Ultrasound Guided Therapeutic Nerve Blocks
- Cyclops Lesion Without ACL Reconstruction: A Rare Case in a Patient with Intact Anterior Cruciate Ligament and Tibial Plateau Fracture
- Dosimetric Comparison between Two Dose Calculation Algorithms in SBRT Treatment of Lung Cancer in Ring-based and C-arm Radiation Therapy Equipment
- Adolescent Testicular Adrenal Rest Tumors: A Case Report and Review of the Literature
- Giant Intrathoracic Lipoma: A Rare Presentation
- Image of a Right Renal Angiomyolipoma Complicated by Hemorrhage