The Impact of Clinical Features in Radiomics of CT Non-Small Cell Lung Cancer
Purpose: To investigate the impact of clinical features on model performance in CT-based Non-Small Cell Lung Cancer (NSCLC) and the potential uncertainty regarding their application in machine learning. Methods: Clinical and radiomic features were retrospectively retrieved from EMR and CT images of 496 NSCLC patients. Five feature datasets were constructed: radiomic features-only (Rad), clinical features-only (Clin), shape features-only (Shape), radiomic and clinical features (RaClin), shape and clinical features (ShClin). Five feature selection methods and seven predictive models, along with different cohort sizes, number of input features and validation methods were included for the uncertainty analysis, with two-year survival as the study endpoint. AUC values were calculated for comparisons and Kruskal-Wallis testing was performed to determine significant differences. Results: A total of 19740 distinct combinations of feature sets, feature selection methods, predictive models, cohort sizes and validation techniques are examined. Of those, 25 combinations produce an AUC > 0.7. The clinical-only feature dataset generally outperforms both the radiomic-only feature dataset and the hybrid (clinical and radiomic) feature dataset (P<0.01), which is primarily determined by the endpoint. The combination of different feature selection methods and predictive models, along with the variations in cohort size, number of input features and validation methods generate inconsistent results. Conclusion: Clinical features are a source of data that can improve machine learning model performance. However, its impact strongly depends on various factors that may lead to inconsistent results. A clear approach to incorporate clinical features to generate reliable results requires further investigation.
Introduction
The use of radiomic features for machine learning analysis of clinical images has gained significant attention as a non-invasive technique in recent years [1, 2, 3, 4]. These features can be readily extracted in large quantities from datasets of patient images, enabling the quantification of certain expressions within regions of interest (ROI) which can be associated with disease or other abnormal structures. A wide range of quantitative features can be explored, including broadly applicable texture and morphological features. While extracting quantitative features from patient images is the primary source of data for radiomic studies, they are not the only source of relevant data.
Prior studies have incorporated clinical features, also known as semantic features, which can provide highly relevant data to a machine learning algorithm and potentially improve predictive model robustness [5, 6, 7, 8, 9, 10]. These features are typically documented in patient charts and encompass various categories such as demographic information (e.g., age, gender, ethnicity), behavioral information (e.g., lifestyle, smoking status), and pathohistological information (e.g., tumor stage, histology). Clinical features have been explored for diagnostic and prognostic purposes, even before the advent of machine learning techniques and big data analysis [11, 12, 13, 14, 15, 16, 17].
Although clinical features have been included as an additional source of data in radiomic investigations, the impact of clinical features on CT-based non-small cell lung cancer (NSCLC) radiomics and the potential uncertainty regarding their use remains largely unexplored. To better understand this question, we perform a comparative study with radiomic features while considering various factors that may impact performance such as cohort size, feature selection methods and predictive models, the number of input features for model training, and model validation methods.
Clinical Features Overview
Building on our previous review of CT lung cancer radiomics studies [1], we further examined commonly used clinical features and their impact on model performance compared to radiomic features. A total of 53 studies were identified. Each of them included at least one of three comparisons: clinical feature dataset vs. radiomic feature dataset, clinical feature dataset vs. hybrid feature dataset, radiomic feature dataset vs. hybrid feature dataset. Here the hybrid feature dataset is referred to as the combination of clinical and radiomic features.
Table 1 presents a summary of the most frequently selected clinical and radiological features for model training. Other refers to features used only once in the reviewed studies. Clinical data such as gender, age, smoking status, and tumor stage, are often readily available within patient charts and easily accessible. Histologic and morphologic features were also commonly incorporated, as many of the reviewed studies seek to explore specific aspects (e.g., histologic classification and metastatic prediction) of lung cancer with established associations to these features.
| # Occurrences | |
|---|---|
| Gender | 20 |
| Age | 19 |
| Smoking status | 19 |
| Stage | 17 |
| Diameter | 16 |
| Histologic subtype | 13 |
| Location | 7 |
| Size/Volume | 7 |
| Spiculation | 6 |
| Pleural indentation | 4 |
| Pleural retraction | 4 |
| Air bronchogram | 3 |
| Ground-glass opacity | 3 |
| Lobulation | 3 |
| Shape | 3 |
| Solid component | 3 |
| Bubble-like | 2 |
| Cavitation | 2 |
| Emphysema | 2 |
| Family history | 2 |
| LN status | 2 |
| Local lymphadenopathy | 2 |
| Margins | 2 |
| Mean HU | 2 |
| Treatment response | 2 |
| Vascular convergence | 2 |
| Other | 32 |
Table 1: The most common clinical and radiological features for radiomics of NSCLC based on 53 studies reviewed.
The 53 reviewed studies included a total of 68 independent endpoints, as some studies include multiple endpoints. For example, Huyhn, et al. examined model performance for two distinct endpoints: distant metastasis and local recurrence [18]. This resulted in a total of 154 comparisons, with 51 for clinical feature dataset vs. radiomic feature dataset, 55 for radiomic feature dataset vs. hybrid, and 48 for clinical feature dataset vs. hybrid. Among 51 comparisons between clinical and radiomic feature datasets, only 17 favored the clinical feature dataset. Hybrid feature datasets generally outperformed both radiomic feature datasets (42 of 55 comparisons favored hybrid) and clinical feature datasets (41 of 48 favored hybrids). Overall, these findings imply that the combination of radiomic and clinical features can generate more reliable results than any of them individually. While existing literature shows this relationship, there have been no specific efforts to investigate how clinical features or the uncertainties associated with the use of clinical features influence the performance, which our work here will focus on.
Materials and Methods
Clinical Cohort
The study cohort included 496 pre-treatment CT image sets from NSCLC patients. The images were retrospectively retrieved from Eclipse (Varian, Palo Alto, USA). The cohort is summarized in Table 2. All patients were scanned on a GE VCT (GE Healthcare, USA) using the same acquisition protocol, 120kV, collimation of 16 X 0.625mm, and scan FOV of 50 cm with Auto mA/Smart mA ‘on’. Filtered Back Projection and STANDARD kernel were used to reconstruct images with a slice thickness of 2.5mm. Gross tumor volume (GTV) were delineated and reviewed by radiation oncologists prior to treatment.
| Characteristics | Number of patients | Percentage of patients (%) |
|---|---|---|
| n, number of patients | 496 | NA |
| Gender | ||
| Male | 255 | 51.4 |
| Female | 241 | 48.6 |
| Smoking status | ||
| Yes | 476 | 96 |
| No | 20 | 4 |
| Age | ||
| 30-39 | 3 | 0.6 |
| 40-49 | 21 | 4.2 |
| 50-59 | 90 | 18.1 |
| 60-69 | 184 | 37.1 |
| 70-79 | 152 | 30.6 |
| 80-89 | 45 | 9.1 |
| 90-99 | 1 | 0.2 |
| Stage | ||
| Occult | 1 | 0.2 |
| IA | 170 | 34.3 |
| IB | 81 | 16.3 |
| IIA | 7 | 1.4 |
| IIB | 25 | 5 |
| IIIA | 53 | 10.7 |
| IIIB | 61 | 12.3 |
| IIIC | 6 | 1.2 |
| IV | 62 | 12.5 |
| IVA | 11 | 2.2 |
| IVB | 11 | 2.2 |
| NA | 8 | 1.6 |
| Survival (months) | ||
| <24 | 237 | 47.8 |
| >=24 | 259 | 52.2 |
Table 2: Characteristics of the patient cohort.
Radiomics Features
The GTV contours that were previously delineated were exported to IBEX (MD Anderson, Houston, USA) and used as the ROI contours for feature extraction [19]. A total of 125 radiomic features were extracted. The extracted features were categorized as Intensity Direct features (n=33), Intensity Histogram features (n=9), 2D and 3D Gray Level Co-occurrence features (n=44), Gray Level Run Length features (n=11), 2D and 3D Neighbor Intensity Difference features (n=10), and Shape features (n=18). No preprocessing was applied to the images prior to feature extraction. Some features were directionally dependent or percentile-based and were calculated separately for each direction or percentile, respectively. When counting all versions of the extracted features, a total of 1419 radiomic features were extracted for each patient image set. The extracted radiomic features and feature extraction method are also the same as in our previous study [20]. All analysis of the radiomic features, feature selection methods, predictive model training, and predictive model validation was done using Python 3.10 (Python Software Foundation, https:// www.python.org/)
Clinical Features
Electronic medical records (EMR) were retrospectively retrieved from the XXXXX (KCR). The EMR data included demographic and histopathologic variables, which were evaluated for inclusion as clinical features. The demographic variables selected for inclusion were: gender, smoking pack years, and age at diagnosis. The histopathologic variables selected for inclusion were: TNM staging, SEER staging, laterality, topography, tumor size, and treatment method. A total of 9 clinical features were selected. Smoking pack-years, age at diagnosis, and tumor size were included as is. The remaining categorical features were assigned integer labels so they could be used as ordinal features (e.g., gender: male – 0, female – 1, TNM staging: IA – 10, IB – 11, IIA – 20, etc.).
Feature Datasets for Comparison
Both radiomic features and clinical features were employed in this study. Three single feature datasets were established: Rad, Shape, Clin. The Rad feature dataset consisted of radiomic features extracted using IBEX [19], including all available first- and second-order radiomic features as in our previous work (n=125) [20]. The Shape feature dataset was a subset of Rad, including only the features within the Shape category (n=18). Morphological features have historically played a significant role in in clinical decision-making processes, e.g., RECIST, which relies on tumor size measurements to evaluate treatment response [21]. Moreover, our previous findings indicated that Shape features are rarely selected by common feature selection methods [20]. By isolating the Shape features, we aimed to investigate the morphological features independently from other quantitative features in Rad. The Clin feature dataset comprised clinical features obtained from patient EMR variables (n=9). Additionally, two combined feature datasets (RaClin, ShClin) were established: RaClin, which combined Rad and Clin, and ShClin, which combined Shape and Clin. Given that Shape is a subset of Rad, a separate combined feature dataset was deemed unnecessary. Table 3 provides a description of the five feature datasets employed in the study.
| for header rows | for data cells | for header rows | for data cells | |
|---|---|---|---|---|
| Single feature sets | ||||
| Rad | Radiomic only | Intensity Direct (n=33) | 125 | |
| Intensity Histogram (n=9) | (1419 w/ variations) | |||
| Gray Level Co-occurrence (n=44) | ||||
| Gray Level Run Length features (n=11) | ||||
| Neighbor Intensity Difference (n=10) | ||||
| Shape features (n=18) | ||||
| Clin | Clinical only | Gender | 9 | |
| Age at Diagnosis | ||||
| Smoking Pack Years | ||||
| Topography | ||||
| Laterality | ||||
| SEER Stage | ||||
| Stage | ||||
| Tumor size | ||||
| Treatment | ||||
| Shape | Shape only | Shape features (n=18) | 18 | |
| Combined feature sets | ||||
| RaClin | Radiomic + Clinical | 125 + 9 | ||
| ShClin | Shape + Clinical | 18 + 9 |
Table 3: Feature set characteristics.
Feature Selection: Five common feature selection methods were employed: analysis of variance (ANOVA), least absolute shrinkage and selection operator (LASSO), maximum relevance-minimum redundancy (mRMR), mutual information (MI), and Relief [1]. Pearson correlation filtering was applied to Rad to remove redundant radiomic features, using a correlation threshold of 0.95 [22, 23, 24, 25]. Pearson correlation was not conducted for the Shape and Clin feature datasets due to their low number of features. The feature selection methods were applied to each of the individual feature datasets (Rad, Shape, Clin) to rank features. For Rad, the top 25 features were retained after ranking, representing a selection at the higher end commonly seen in other radiomic studies [1]. The top 15 features were retained for Shape after ranking. All features in Clin were retained after ranking. Differences in feature rank order for Shape and Clin were examined to determine the stability of shape and clinical features across feature selection methods. The Rad feature dataset had already been examined in our previous work [20].
Predictive Model Training
Seven common predictive models were used: Decision Tree, Random Forest, Logistic Regression, Support Vector Classifier, k-Nearest Neighbor, Gradient Boosting, and Naïve-Bayesian [1]. The number of input features used to train predictive models was varied depending on the feature dataset. For Rad, the top 25 radiomic features were retained after feature selection and the top 5, 10, 15, 20, and 25 features were used for predictive model training, respectively. For Shape, all 15 features retained after feature selection were used. For Clin, all 9 features were used. RaClin combined Rad and Clin and had 25 combinations of different numbers of input features ([5, 10, 15, 20, 25 Rad] x [1, 3, 5, 7, 9 Clin]). ShClin combined Shape and Clin and had 15 combinations ([5, 10, 15 Shape] x [1, 3, 5, 7, 9 Clin]). Each separate combination was treated as a separate instance when training the predictive models. This approach ensured that both the radiomic and clinical features were included in model training, even if the clinical features have otherwise been ranked below the top radiomic features. A 2-, 5-, and 10-fold cross-validation (CV) were used for predictive model validation. These three methods were commonly adopted in existing studies [1].
Performance Analysis
The study endpoint for model prediction was two- year survival. To assess the performance of the predictive models, Area under the Curve (AUC) values were calculated. Combinations that yielded AUC values greater than 0.7 were considered to have fair performance based on established criteria [26, 27, 28]. The mean AUC value for each variation was calculated to examine the relative performance associated with different feature datasets. For example, the average AUC value of all model outputs using the ANOVA feature selection method was calculated for Rad, Shape, Clin, RaClin, and ShClin. This process was repeated for each feature selection method, predictive model, cohort size, validation method, and number of radiomic features. This resulted in 19740 individual models (5 feature selection methods * 7 predictive models * 4 cohort sizes * 3 validation methods * [5 Rad + 1 Shape + 1 Clin + 25 RaClin + 15 ShClin] number of input features) for evaluation. The AUC values for each of the feature datasets were grouped into individual boxplots to visualize relative performance. Kruskal-Wallis testing was performed to determine significant differences across all feature datasets and subsequent pairwise analysis was performed to determine relative performance of the feature datasets. This retrospective study was performed in accordance to relevant guidelines and regulations, and was approved by the X institutional review board (IRB).
Results
The feature rankings across the feature selection methods for the Shape feature are listed in Table 4A. While many of the Shape features are ranked inconsistently, the features that have the highest average ranks are Orientation, Surface Area, Surface Area Density, Volume, Compactness1, and Number of Voxel. Other than Orientation, the remaining features directly pertain to the physical size of the ROI, implying that the ROI shape and orientation may be less influential. For the Clin feature dataset, the feature rank orders are also inconsistent, as shown in Table 4B. Compared to the other feature selection methods, mRMR ranks the Clin features in almost a reverse order. The ranks of Smoking
Pack Years and Age at Diagnosis indicate the two features are highly associated with survival, which aligns with finding from previous studies [12, 13, 14, 29, 30, 31]. Our previous findings when examining feature rank order for the Rad feature dataset show similar inconsistencies to the results found for Shape and Clin [20]. It is important to note that the relative importance of a given feature, shape, clinical, or radiomic, is contingent upon the chosen feature selection method.
| ANOVA | LASSO | MI | MRMR | RELIEF | |
|---|---|---|---|---|---|
| 1 | Compactness1 | Sphericity | Orientation | Compactness1 | Number Of Voxel |
| 2 | Surface Area | Orientation | Surface Area | Surface Area Density | ConvexHullVolume3D |
| 3 | Surface Area Density | Number Of Objects | Volume | Surface Area | Orientation |
| 4 | Convex Hull Volume | Volume | Sphericity | Voxel Size | Surface Area |
| 5 | Mean Breadth | Roundness | Voxel Size | Mean Breadth Density | Convex Hull Volume |
| 6 | Max3DDiameter | Compactness1 | Convex | Convex Hull Volume | Mass |
| 7 | ConvexHullVolume3D | Number Of Voxel | Roundness | Max3Ddiameter | Volume |
| 8 | Mass | Compactness2 | Surface Area Density | Mass | Max3Ddiameter |
| 9 | Volume | Mean Breadth | Number Of Voxel | Volume | Mean Breadth |
| 10 | Number Of Voxel | Max3Ddiameter | ConvexHullVolume3D | ConvexHullVolume3D | Number of Objects |
| 11 | Voxel Size | Mass | Convex Hull Volume | Number Of Voxel | Surface Area Density |
| 12 | Roundness | ConvexHullVolume3D | Mean Breadth | Roundness | Compactness1 |
| 13 | Sphericity | Convex Hull Volume | Number Of Objects | Comapctness2 | Spherical Disproportion |
| 14 | Compactness2 | Convex | Mass | Sphericity | Compactness2 |
| 15 | Spherical Disproportion | Voxel Size | Compactness1 | Spherical Disproportion | Roundness |
Table 4: Combinations of workflow variations with AUC > 0.7.
Table 4A: Rankings for the Shape feature set using different feature selection methods.
| ANOVA | LASSO | MI | MRMR | RELIEF | |
|---|---|---|---|---|---|
| 1 | Smoking Pack Years | Stage | Gender | Treatment | Tumor Size |
| 2 | Laterality | Age at Diagnosis | Age at Diagnosis | Gender | Smoking Pack Years |
| 3 | Age at Diagnosis | Smoking Pack Years | Smoking Pack Years | SEER Stage | Age at Diagnosis |
| 4 | Topography | Topography | Topography | Tumor Size | Treatment |
| 5 | SEER Stage | Laterality | Laterality | Stage | Gender |
| 6 | Stage | SEER Stage | SEER Stage | Topography | Laterality |
| 7 | Gender | Gender | Stage | Laterality | SEER Stage |
| 8 | Tumor Size | Tumor Size | Tumor Size | Age at Diagnosis | Stage |
| 9 | Treatment | Treatment | Treatment | Smoking Pack Years | Topography |
Table 5: Combinations of workflow variations with AUC > 0.7.
Table 4B: Rankings for the Clin feature set using different feature selection methods.
| Feature | Cohort Size (%) | Validation Method | Number of Input Features | Feature Se- lection | Predictive Model | AUC | ||
|---|---|---|---|---|---|---|---|---|
| Radiomic | Shape | Clinical | ||||||
| Rad | 50 | 2F | 25 | - | - | LASSO | GB | 0.973 |
| Rad | 75 | 2F | 15 | - | - | MI | LR | 0.872 |
| Clin | 25 | 5F | - | - | 9 | MI | RF | 0.724 |
| Clin | 25 | 5F | - | - | 9 | Relief | RF | 0.721 |
| Clin | 25 | 5F | - | - | 9 | mRMR | RF | 0.716 |
| Clin | 25 | 5F | - | - | 9 | LASSO | RF | 0.71 |
| Clin | 25 | 10F | - | - | 9 | LASSO | RF | 0.702 |
| Clin | 25 | 5F | - | - | 9 | ANOVA | RF | 0.701 |
| RaClin | 25 | 10F | 5 | - | 7 | Relief | GB | 0.727 |
| RaClin | 25 | 10F | 10 | - | 9 | Relief | DT | 0.717 |
| RaClin | 25 | 10F | 10 | - | 5 | mRMR | LR | 0.713 |
| RaClin | 25 | 10F | 5 | - | 9 | Relief | GB | 0.711 |
| RaClin | 25 | 10F | 5 | - | 5 | Relief | GB | 0.709 |
| RaClin | 25 | 10F | 5 | - | 5 | Relief | RF | 0.707 |
| RaClin | 25 | 10F | 5 | - | 1 | mRMR | LR | 0.706 |
| RaClin | 50 | 2F | 25 | - | 7 | mRMR | RF | 0.704 |
| RaClin | 25 | 5F | 5 | - | 5 | Relief | RF | 0.703 |
| RaClin | 25 | 10F | 5 | - | 7 | mRMR | LR | 0.702 |
| RaClin | 25 | 10F | 5 | - | 9 | MI | RF | 0.702 |
| RaClin | 25 | 10F | 5 | - | 5 | mRMR | LR | 0.7 |
| ShClin | 25 | 10F | - | 5 | 7 | mRMR | DT | 0.728 |
| ShClin | 25 | 10F | - | 5 | 5 | mRMR | DT | 0.723 |
| ShClin | 25 | 10F | - | 10 | 5 | mRMR | DT | 0.715 |
| ShClin | 25 | 10F | - | 15 | 5 | Relief | GB | 0.714 |
| ShClin | 25 | 10F | - | 5 | 9 | MI | RF | 0.702 |
Table 6: Combinations of workflow variations with AUC > 0.7.
Table 5 displays the highest performing combinations for the five feature datasets (Rad, Clin, RaClin, ShClin, Shape), only including combinations with AUC > 0.7. The highest performing combination for each feature dataset is bolded. Combinations using the Shape feature dataset are not included since its maximum AUC is 0.651. In total, there are 2 combinations for Rad, 6 for Clin, 12 for RaClin, and 5 for ShClin in this table. These combinations represent a very small percentage of the total tested combinations for each feature dataset, specifically 0.09% (2/2100) for Rad, 1.4% (6/420) for Clin, 0.11% (12/10500) for RaClin, and 0.07% (5/6300) for ShClin. The highest performing combination is from Rad (AUC = 0.973) and the second highest performing combination is also from Rad (AUC = 0.872), suggesting a high level of predictive performance. However, it is important to note that these combinations are clear outliers when compared to the performance of combinations in Rad, all of which have AUC values less than 0.667. Thus, the high AUC values obtained may not accurately represent the overall performance of the dataset. For each feature dataset in Table 5, Clin (Max AUC: 0.724), RaClin (Max AUC: 0.727), and ShClin (Max AUC: 0.728) all incorporate clinical features and show similar max AUC values. All but one combination uses the 25% patient sub-cohort, and all but one combination uses 5- or 10-fold CV. The feature selection methods that are most commonly used in these combinations are mRMR and Relief, with 9 and 8 occurrences, respectively. The predictive model that appears most commonly in this table is Random Forest, with 11 occurrences.
| Category | Variation | Rad | Shape | Clin | RaClin | ShClin |
|---|---|---|---|---|---|---|
| Feature Selection Method | ANOVA | 0.582 | 0.57 | 0.584 | 0.587 | 0.577 |
| LASSO | 0.522 | 0.563 | 0.583 | 0.543 | 0.576 | |
| MI | 0.553 | 0.565 | 0.583 | 0.553 | 0.575 | |
| mRMR | 0.577 | 0.567 | 0.584 | 0.601 | 0.601 | |
| Relief | 0.53 | 0.569 | 0.586 | 0.55 | 0.587 | |
| Predictive Model | Decision Tree | 0.538 | 0.516 | 0.594 | 0.558 | 0.556 |
| Random Forest | 0.579 | 0.58 | 0.632 | 0.611 | 0.608 | |
| Logistic Regression | 0.565 | 0.596 | 0.615 | 0.571 | 0.601 | |
| SVC | 0.541 | 0.612 | 0.53 | 0.544 | 0.602 | |
| KNN | 0.534 | 0.551 | 0.498 | 0.543 | 0.543 | |
| GBoost | 0.563 | 0.541 | 0.621 | 0.59 | 0.59 | |
| NB | 0.55 | 0.571 | 0.598 | 0.551 | 0.583 | |
| Cohort Size (%) | 100 | 0.552 | 0.537 | 0.572 | 0.567 | 0.591 |
| 75 | 0.55 | 0.582 | 0.566 | 0.564 | 0.589 | |
| 50 | 0.553 | 0.579 | 0.593 | 0.568 | 0.588 | |
| 25 | 0.555 | 0.57 | 0.604 | 0.568 | 0.565 | |
| Validation Method | 2 | 0.549 | 0.565 | 0.577 | 0.56 | 0.578 |
| 5 | 0.554 | 0.563 | 0.586 | 0.567 | 0.582 | |
| 10 | 0.556 | 0.572 | 0.589 | 0.573 | 0.59 | |
| Number of Radiomic Features | 5 | 0.555 | - | - | 0.568 | - |
| 10 | 0.551 | - | - | 0.569 | - | |
| 15 | 0.552 | - | - | 0.568 | - | |
| 20 | 0.553 | - | - | 0.564 | - | |
| 25 | 0.553 | - | - | 0.565 | - |
Table 7: Summary of average performance for all tested variations.
Table 6 compiles the relative performance of the sources of variation examined in this study. The highest performing variation in each category is bolded. In Shape and Clin feature datasets, the mean AUC values of the feature selection methods exhibit only slight variations. This may be attributed to the relatively low number of features in both datasets, which may diminish the impact of different feature selection methods, leading to similar average performance. However, in the larger feature datasets (Rad, RaClin, ShClin), the performance differences between the feature selection methods are larger. This suggests that the choice of feature selection method may have a greater impact on the predictive performance in feature datasets with a larger number of features. From the bolded mean values in Table 6, it can be seen that the feature datasets that include clinical features generally outperform those without clinical features. Additional analysis is shown in Figure 1 and Table 7.
| Group A | Group B | Lower CI | Mean | Upper CI | p-value |
|---|---|---|---|---|---|
| Rad | Shape | -2533.3 | -1702.4 | -871.6 | 2.26E-07 |
| Rad | Clin | -4444.9 | -3614 | -2783.1 | 0 |
| Rad | RaClin | -1945.9 | -1574.3 | -1202.8 | 0 |
| Rad | ShClin | -3912 | -3520.3 | -3128.6 | 0 |
| Shape | Clin | -2984.2 | -1911.5 | -838.9 | 1.15E-05 |
| Shape | RaClin | -645.4 | 128.1 | 901.6 | 0.991 |
| Shape | ShClin | -2601.2 | -1817.9 | -1034.5 | 2.36E-09 |
| Clin | RaClin | 1266.1 | 2039.6 | 2813.2 | 5.28E-12 |
| Clin | ShClin | -689.7 | 93.7 | 877 | 0.998 |
| RaClin | ShClin | -2193.7 | -1946 | -1698.2 | 0 |
Table 8: Pairwise evaluation of the performance of each feature set.
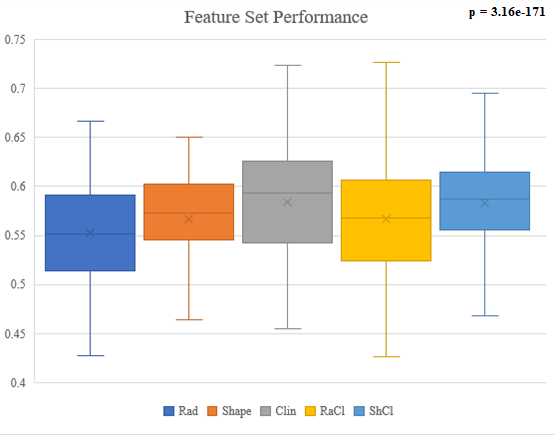
The boxplot in Figure 1 shows all AUC values for each of the feature datasets. Kruskal-Wallis analysis shows significant difference across all feature datasets (p = 3.16e- 171). Further pairwise testing in Table 7 shows the relative performance of each feature dataset. The feature datasets are ranked as follows: (Clin and ShClin) > (Shape and RaClin) > Rad. There is no significant difference between the Shape and RaClin feature datasets as well as the Clin and ShClin feature datasets.
Discussion
In general, our results agree that the inclusion of clinical features improve model performance. However, contrary to existing studies, our results show the clinical- only feature dataset outperformed both the radiomic- only feature dataset and the hybrid feature dataset. The selection of endpoints could be a primary source behind this disagreement. Based on above mentioned 53 reviewed studies, there are basically three types of endpoints: histological classification (e.g., mutation status, malignancy classification), metastatic prediction (e.g., lymph node status, distant metastasis), and survival prediction (e.g., progression-free survival, treatment response). For the metastatic prediction endpoint, 31 of 33 comparisons show a consistent conclusion that both radiomic and hybrid feature datasets outperform clinical feature datasets. For the 40 comparisons with survival prediction as the endpoint, approximately 35% of comparisons favor the clinical feature dataset over the radiomic or hybrid feature datasets. For the 82 comparisons with histological classification as the endpoint, approximately 30% of comparisons the favor clinical feature dataset over the radiomic or hybrid feature datasets. This indicates that the impact of clinical features depends on the selection of endpoint. Note that this study uses the two-year survival as endpoint, which belongs to the category of survival prediction.
Another reason for this disagreement may be due to the variation of various factors associated with radiomics studies, such as cohort size, feature selection methods, number of input features, selection of predictive models, and validation methods. Our previous study has shown the variations in these factors generate inconsistent results, leading to inconsistent conclusions [20]. It is worth noting that a radiomics study typically intends to design and train the best possible model. While various combinations of factors may be tested, only the best performance is typically reported. This is of course relevant to the study goals but may not reflect the overall influence of various factors on model performance. We examined 19740 distinct combinations of feature datasets, feature selection methods, predictive models, cohort variations, and validation techniques. Of these, only 25 combinations produced an AUC > 0.7 as seen in Table 5, highlighting the challenge of designing a high performing predictive model. The factors that researchers have the most control over feature selection, number of input features, and predictive model, exhibit limited agreement in these combinations. Validation method is consistent, most combinations use 10-fold CV, but this method is considered standard which leaves little room for adjustment [1]. The other factor that displays consistency is cohort size, which is not controllable in most scenarios. This shows that there is no clear way to combine clinical features with radiomic features and other factors to generate consistent, high-performing models. The wide availability of different machine learning methods and constantly-evolving techniques poses a difficult challenge when preparing studies, especially if studies do not plan to implement wide-ranging test arrays as we have.
There are several limitations to this study. The clinical features retrieved from the KCR are limited in number, though still comparable to other studies and include most commonly used features in Table 1. The number of methods included in this study may be another limitation. We chose the most popular/frequently used methods based on our review of literature since 2012 in CT lung cancer studies [1]. There are other methods that are not included in this study that may be investigated in the future. The radiomic features for comparison could be a limitation as well, since only first and second order radiomic features are employed. High-order features such as wavelets and Laws features may improve the performance with radiomic features.
Conclusion
Incorporating relevant clinical features alongside radiomic features can have a positive impact on model performance, as the combination of both types of features generally outperforms using clinical or radiomic features alone. However, clinical features are just as susceptible as radiomic features to the same inconsistencies associated with variations in the radiomic workflow and further investigations are needed to improve their implementation with the goal of producing robust radiomic models.
Data Availability Statement
The data cannot be made publicly available upon publication because they contain sensitive personal information. The data that support the findings of this study are available upon reasonable request from the authors.
Ethical Statement
All patient data included in this study are anonymized. Patient data was acquired retrospectively from the XXXXX under an IRB-approved protocol (IRB number 43505), and written informed consent was waived. This research was conducted in accordance with the Declaration of Helsinki and in accordance with local statutory requirements.
References
-
Ge G, Zhang J (2023) Feature selection methods and predictive models in CT lung cancer radiomics. J Appl Clin Med Phys 24(1): e13869.
-
Binczyk F, Wojciech P, Pawel B, Joanna P (2021) Radiomics and artificial intelligence in lung cancer screening. Transl Lung Cancer Res 10(2): 1186-1199.
-
Ninatti G, Margarita K, Emanuele N, Martina S, Arturo C (2020) Imaging-Based Prediction of Molecular Therapy Targets in NSCLC by Radiogenomics and AI Approaches: A Systematic Review. Diagnostics (Basel) 10(6): 359.
-
Avanzo M, Joseph S, Giovanni P, Giovanna S (2020) Radiomics and deep learning in lung cancer. Strahlenther Onkol 196(10): 879-887.
-
Chen A, Lin L, Xuehui P, Tongfu Y, Hao Y, et al. (2019) CT- Based Radiomics Model for Predicting Brain Metastasis in Category T1 Lung Adenocarcinoma. AJR Am J Roentgenol 213(1): 134-139.
-
Gu Q, Zhichao F, Xiaoli H, Mengtian M, Mwajuma M, et al. (2019) Radiomics in predicting tumor molecular marker P63 for non-small cell lung cancer. Zhong Nan Da Xue Xue Bao Yi Xue Ban 44(9): 1055-1062.
-
Hou D, Weihua L, Sicong W, Yao H, Jianwei W, et al. (2021) Different Clinicopathologic and Computed Tomography Imaging Characteristics of Primary and Acquired EGFR T790M Mutations in Patients with Non-Small-Cell Lung Cancer. Cancer Manag Res 13: 6389-6401.
-
Rios VE, Chintan P, Ying L, Thibaud PC, Gisele C, et al. ( 2017) Somatic Mutations Drive Distinct Imaging Phenotypes in Lung Cancer. Cancer Res 77(14): 3922- 3930.
-
Weng Q, Junguo H, Hailin W, Chuanqiang L, Jiansheng H, et al. (2021) Radiomic Feature-Based Nomogram: A Novel Technique to Predict EGFR-Activating Mutations for EGFR Tyrosin Kinase Inhibitor Therapy. Front Oncol 11: 590937.
-
Zhang G, Yuntai C, Jing Z, Jialiang R, Zhiyong Z, et al. (2021) Predicting EGFR mutation status in lung adenocarcinoma: development and validation of a computed tomography-based radiomics signature. Am J Cancer Res 11(2): 546-560.
-
Riihimaki M, Hemminki A, Fallah M, Thomsen H, Sundquist K, et al. (2014) Metastatic sites and survival in lung cancer. Lung Cancer 86(1): 78-84.
-
Rigel DS, Friedman RJ, Levine J, Kopf AW, Levenstein M (1981) Cigarette smoking and malignant melanoma. Prognostic implications. J Dermatol Surg Oncol 7(11): 889-891.
-
Riggs JE (1995) Increasing Lung Cancer Mortality Rates in the Elderly: A Manifestation of Differential Survival. Regul Toxicol pharmacol 21(3): 370-374.
-
Rojewski AM, Nichole TT, Lin D, James GR, Mulugeta G, et al. (2018) Tobacco Dependence Predicts Higher Lung Cancer and Mortality Rates and Lower Rates of Smoking Cessation in the National Lung Screening Trial. Chest 154(1): 110-118.
-
Khan KA (2015) Radiological characteristics, histological features and clinical outcomes of lung cancer patients with coexistent idiopathic pulmonary fibrosis. Lung 193(1): 71-77.
-
Iyen-Omofoman B, Tata LJ, Baldwin DR, Smith CJP, Hubbard RB (2013) Using socio-demographic and early clinical features in general practice to identify people with lung cancer earlier. Thorax 68(5): 451-459.
-
Shoji F, Morodomi Y, Kyuragi R, Okamoto T, Matsumoto T, et al. (2013) Clinico-pathological features and management of lung cancer patients with atherosclerotic vascular diseases. Ann Thorac Cardiovasc Surg, 2013. 19(5): 345-350.
-
Huynh E, Coroller TP, Narayan V, Agrawal V, Romano J, et al. (2017) Associations of Radiomic Data Extracted from Static and Respiratory-Gated CT Scans with Disease Recurrence in Lung Cancer Patients Treated with SBRT. PLoS One 12(1): e0169172.
-
Zhang L, Fried DV, Fave XJ, Hunter LA, Yanget J, et al. (2015) Ibex: An open infrastructure software platform to facilitate collaborative work in radiomics. Medical Physics 42(3): 1341-1353.
-
Ge G, Siddique A, Zhang J (2023) Inconsistent CT NSCLC radiomics associated with feature selection methods, predictive models and related factors. Phys Med Biol 68(12).
-
Eisenhauer EA, Therasse P, Bogaerts J, Schwartz LH, Sargent D, et al. (2009) New response evaluation criteria in solid tumours: revised RECIST guideline (version 1.1). Eur J Cancer 45(2): 228-247.
-
Kim H, Park CM, Keam B, Park SJ, Kim M, et al. (2017) The prognostic value of CT radiomic features for patients with pulmonary adenocarcinoma treated with EGFR tyrosine kinase inhibitors. PLoS One 12(11): e0187500.
-
Li Q, Kim J, Balagurunathan Y, Qi J, Liu Y, et al. (2017) CT imaging features associated with recurrence in non- small cell lung cancer patients after stereotactic body radiotherapy. Radiat Oncol 12(1): 158.
-
Li Q, Kim J, Balagurunathan Y, Liu Y, Latifi K, et al. (2017) Imaging features from pretreatment CT scans are associated with clinical outcomes in nonsmall-cell lung cancer patients treated with stereotactic body radiotherapy. Med Phys 44(8): 4341-4349.
-
Budai BK, Tóth A, Borsos P, Frank VG, Shariati S, et al. (2020) Three-dimensional CT texture analysis of anatomic liver segments can differentiate between low- grade and high-grade fibrosis. BMC Med Imaging 20(1): 108.
-
Mandrekar JN (2010) Receiver Operating Characteristic Curve in Diagnostic Test Assessment. J Thorac Oncol 5(9): 1315-1316.
-
Obuchowski NA (2003) Receiver operating characteristic curves and their use in radiology. Radiology 229(1): 3-8.
-
Metz CE (1978) Basic principles of ROC analysis. Semin Nucl Med 8(4): 283-298.
-
Moolgavkar SH, Holford TR, Levy DT, Kong CY, Foy M, et al. (2012) Impact of Reduced Tobacco Smoking on Lung Cancer Mortality in the United States During 1975–2000. JNCI: Journal of the National Cancer Institute 104(7): 541-548.
-
Jeon J, Holford TR, Levy DT, Feuer EJ, Cao P, et al. (2018) Smoking and Lung Cancer Mortality in the United States From 2015 to 2065 a comparative modeling approach. Ann Intern Med 169(10): 684-693.
-
Baum P, Winter H, Eichhorn ME, Roesch RM, Taberet S, et al. (2022) Trends in age- and sex-specific lung cancer mortality in Europe and Northern America: Analysis of vital registration data from the WHO Mortality Database between 2000 and 2017. European Journal of Cancer 171: 269-279.
- Ultrasound Guided Therapeutic Nerve Blocks
- Cyclops Lesion Without ACL Reconstruction: A Rare Case in a Patient with Intact Anterior Cruciate Ligament and Tibial Plateau Fracture
- Dosimetric Comparison between Two Dose Calculation Algorithms in SBRT Treatment of Lung Cancer in Ring-based and C-arm Radiation Therapy Equipment
- Adolescent Testicular Adrenal Rest Tumors: A Case Report and Review of the Literature
- Giant Intrathoracic Lipoma: A Rare Presentation
- Image of a Right Renal Angiomyolipoma Complicated by Hemorrhage