Starvation and Cellular uptake of LDL Stimulates Cell Proliferation: Is it a Reason for Fat Cell Proliferation in Obesity?
Serum depletion in culture medium stimulates cell proliferation. Serum depletion promotes cellular starvation in respect of growth factors supplied by serum. In starvation, cells consume nutrients more aggressively and this leads more cell growth and cell proliferation. This study has shown that LDL, a major constituent of fat diet, is taken up by cells exponentially high in serum deficient medium and the uptake rate increases inversely with serum concentration in the medium. The study has also shown that addition of LDL in extremely low serum fortified medium can compensate the need for cell growth/proliferation and cells get equivalent growth pattern with higher concentration of serum in the medium. The phenomena may consider as a model example for the cases of fat cell proliferation following fat intake after chronic starvation or to those having habits for periodic starvation.
Introduction
Homeostasis is a process that maintains constant conditions within a cell or organism in response to either internal or external stimulus [1, 2, 3, 4, 5, 6]. Cellular homeostasis of cholesterol is maintained by equilibrium between cholesterol intake and utilization by cellular metabolism. LDL receptor (LDLR) is a major gateway for the entry of cholesterol into the cells in the form of low density lipoprotein particle [2, 7]. The intracellular cholesterol pool is used as precursor for the synthesis of metabolic and structural components like steroids, bile and cell membranes [8]. All these agents are responsible either directly or indirectly for cell growth and cell proliferation. Looking from this perspective, cholesterol can be considered as an important growth promoter or in other words a growth factor for cell proliferation. Cholesterol is extremely essential for making extra- and intracellular membranes in dividing cells. The mechanism of cellular growth or cell proliferation by intracellular cholesterol is not yet entirely understood. However, the slope of cell growth has been found interlinked to the state of intracellular cholesterol homeostasis [9]. A putative sensor translates small fluctuations in plasma membrane cholesterol into relatively large changes in LDL flux, thereby setting the magnitude of the intracellular pools. This intracellular cholesterol pool is perturbed by intracellular effectors through intracellular feedback loop(s) [10] and thus maintains the ultimate fate of cellular growth and cell proliferation.
Material & Methods
Cell culture (HepG2, a Liver cell line)
Cells were grown in DMEM (Dulbecco’s modified eagle’s medium) containing glucose (4.5g/L), HEPES (5.96g/L) NaHCO3 (3.7g/L) and 10% Fetal calf serum (FCS) (v/v). Anti-biotic and anti-mycotic was added in the concentration of Penicillin (100 unit/ml), streptomycin (100mg/ml) and amphotericin B (250ng/ml). The HepG2 culture was maintained at 37ºC in an atmosphere of 95% air and 5% CO2, either on 75mm or 25mm flasks. To carry out experiments at various serum concentrations, the cells were initially grown in 10% FCS till 30% confluence and then serum concentration was adjusted to the respective level for further processing.
Cell counting
Cells were collected by trypsynization and manually counted by using Improved Neubauer counting chamber. Preparation of LDL from human blood plasma: LDL was isolated from human blood plasma by NaCl-KBr density gradient ultracentrifugation according to Havel et al [11].The LDL band density was collected and dialyzed and total cholesterol was estimated using the o- pthaldehyde method of Zlatkis and Zak [12]. The protein concentration of the preparation was measured by Bradford Technique [13] and different concentrations of LDL-protein were used for LDL uptake study. LDL uptake study by HepG2 cell: 90mm falcon plates were used for LDL uptake study. HepG2 cells were counted in the Improved Neubauer chamber and 106 cells per plate along with DMEM media were used. Cells were incubated at 37◦C for overnight (24hr) and microscopic examination was done to check the confluent of cells. When cells reached approximately 30% confluent, various concentration of Fetal Calf Serum (2%,5%,7% and 10%) was adjusted for incubation till next stipulated time. Culture medium was adjusted with LDL at concentrations of 0, 10, 20, 30, 50, 75 and 100µg/ml and incubated for five and half hour at 37◦C. After incubation, the medium and cells were collected separately and LDL estimation was performed as reported earlier [14, 15]. Staining of cells: Cells were stained by Haematoxylin and eosin to see any morphological variation if produced by the stress incurred in serum deprive medium.
Results
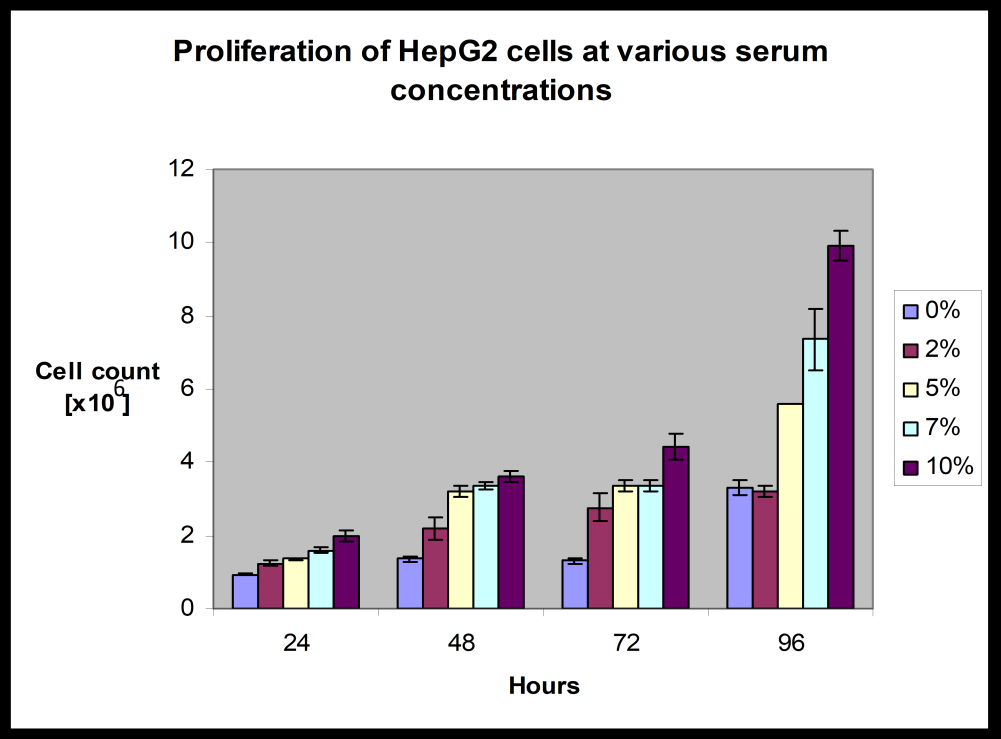
Culture of HepG2 cells is normally maintained in 10% fetal calf serum (FCS) fortified medium. Concentration of FCS has been reported to be reduced in several occasions to stimulate the expression of certain proteins on the cell surface [16, 17]. Since FCS provides growth factors to maintain the cell growth; growth rate is expected to be reduced with decreased concentration of FCS. As a matter of fact the viability of cells is also expected to be affected. In this study, the proliferation pattern of 106 cells has been followed over 96hrs at various concentrations of FCS. It is obvious from the (Table-1) (Graphical presentation in Figure-1) that the extent of cell proliferation has been decreased with decreased concentration of FCS. Although a spontaneous drop in the total number of cells was apparent with the fall of FCS concentration in the culture medium; the trend gets lost below 5% FCS deficient state. There is apparently no difference in cell concentration over 96hrs between 0% and 2% FCS fortified medium. This means that below 5% serum the cells lose their constant ability to grow. It is also apparent that increase of cells over each 24hrs is almost negligible in 0% and 2% FCS supplemented medium as compared to the changes found with 5% through 10% FCS supplemented states. It is also obvious from Table – 1 that in 96hrs time there is almost 50% reduction to the cell numbers with 5%FCS supplementation as compared to 10%FCS supplemented cells. This above starvation model was prepared to check the role of LDL on cell proliferation. Since at 5% FCS concentration, the cell proliferation profile was reduced to 50% of that found in the 10% FCS fortified state, the cells were maintained at 5% FCS concentration to verify the effects of LDL on the cell proliferation pattern. LDL was used at concentration of 50 and 100μg/ml medium because these concentrations of LDL do not affect the normal functional activity of LDL receptors [15]. At LDL concentration of 50μg/ml in the medium of 106 cells population, the cells were also found not saturated with cholesterol and hence the feedback inhibition by cholesterol laden cells on LDL receptor expression can be avoided. It is quite clear from (Table 2) that LDL did work as growth stimulant and promoted cell proliferation. Thus LDL acted like a mitogen and activated proliferation of the slow growing cells in serum deficient medium. The profile of LDL uptake at various serum deficient conditions (2, 5, and 10% FCS) was compared in (Figure 2A). The time of incubation of the cell culture was restricted at 48h. The uptake rate was calculated in μg
LDL consumed per 106 cells. The LDL uptake rate of HepG2 cells was almost parallel in 5% and 10% serum supplemented culture medium. But in 2% serum fortified medium the uptake rate was incredibly high. This suggests that starved cells consume more LDL to restore their growth potential. It is apparent from (table 2) that LDL acts like a mitogen. Thus in serum deficient medium the cells get more vigor to consume more LDL as supplement for the growth factor from which the cell are deprived to maintain cell growth. This gives the thrust that starvation makes the cells more vigor for nutrients to increase cell proliferation rate which may sometimes be the reason of abnormal incidence e.g. in case of adipose cells the obesity may be encouraged for making more fat storage cells (adipose cells) to support cells for energy during prolong starvation. Consumption of more LDL in the form of fat may gear this process.
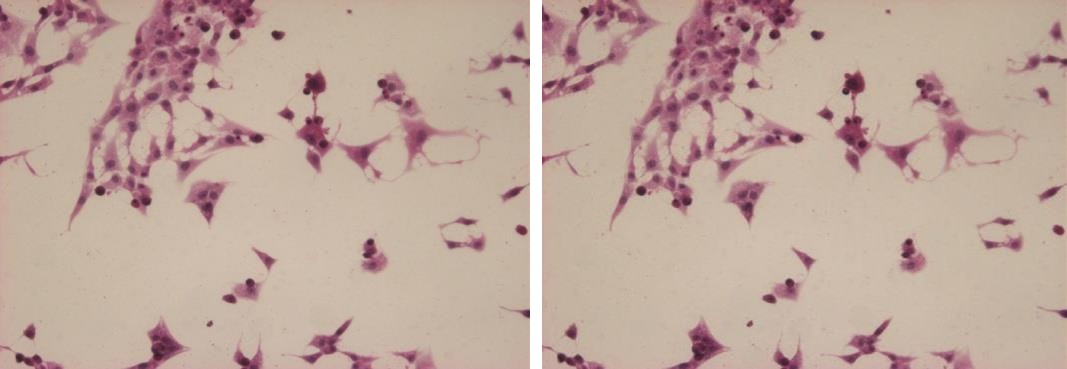
The differences of LDL uptake rate at various serum deficient states were found wider with more incubation time. While cells were incubated for 96hrs in serum deficient medium, the LDL uptake rate was found more vigorous (Figure 2B). The cells show no change in their morphology by the decrease of serum concentration from 10 to 2% and addition of LDL in the culture medium (Figure 3). This shows that the cells maintained their cellular integrity even in the nutritionally stressed situation.
Cell number per plate at 0hr: 106 Proliferated cell count per plate: [Mean x106 ± SD] Concentration of Fetal $$
\begin{array}{l l l l l} 0 \% & 0. 9 4 \pm 0. 0 3 &
Cell number per plate at 0hr: 106 Proliferated cell count per plate: [Mean x106 ± SD] Concentration of Fetal $$ \begin{array}{l l l l l} 0 \% & 0. 9 4 \pm 0. 0 3 & 1. 3 6 \pm 0. 0 8 & 1. 3 0 \pm 0. 0 6 & 3. 3 0 \pm 0. 2 1 \\ 2 \% & 1. 2 4 \pm 0. 0 8 & 2. 1 7 2 \pm 0. 3 1 & 2. 7 7 \pm 0. 3 9 & 3. 2 0 \pm 0. 1 6 \\ 5 \% & 1. 3 5 \pm 0. 0 2 & 3. 1 9 2 \pm 0. 1 6 & 3. 3 6 \pm 0. 1 5 & 5. 6 0 \pm 0. 0 1 \\ 7 \% & 1. 5 9 \pm 0. 0 8 & 3. 3 4 \pm 0. 1 1 & 3. 3 7 \pm 0. 1 6 & 7. 3 6 \pm 0. 8 5 \\ 1 0 \% & 2. 0 \pm 0. 1 6 & 3. 6 \pm 0. 1 4 & 4. 4 4 \pm 0. 3 6 & 9. 9 2 \pm 0. 4 0 \end{array} $$
- Mean ± SD represents four sets of experiments.
Table 1: Proliferation of HepG2 cells grown in various concentrations of fetal calf serum, at different time intervals
| Cell number per plate at 0hr: 106 Proliferated cell count per plate: [Mean x 106 ± SD] | ||||||||||||||
| 24h | 48hr | 72hr | 96hr | |||||||||||
| Presence of Stimulants | ||||||||||||||
| Mean ± SD | Mean ± SD | Mean ± SD | Mean ± SD | |||||||||||
| NIL | 1.35 ± 0.02 | 3.192 ± 0.08 | 3.36 ± 0.07 | 5.60 ± 0.01 | ||||||||||
| LDL (50mg/ml) | 0.94 ± 0.01 | 4.5 ± 0.05 | 6.8 ± 0.04 | 7.60 ± 0.01 | ||||||||||
| LDL(100mg/ml) | 1.58 ± 0.05 | 7.9 ± 0.03 | 12.8 ± 0.01 | 13.6 ± 0.01 |
Table 2: Proliferation of Hepg2 Cells Grown in Deficient Serum Concentration (5% FCS) at Different Time Intervals with and withou
Mean ± SD represents results from four sets of experiments. Table 2: Proliferation of Hepg2 Cells Grown in Deficient Serum Concentration (5% FCS) at Different Time Intervals with and without LDL in the Medium.
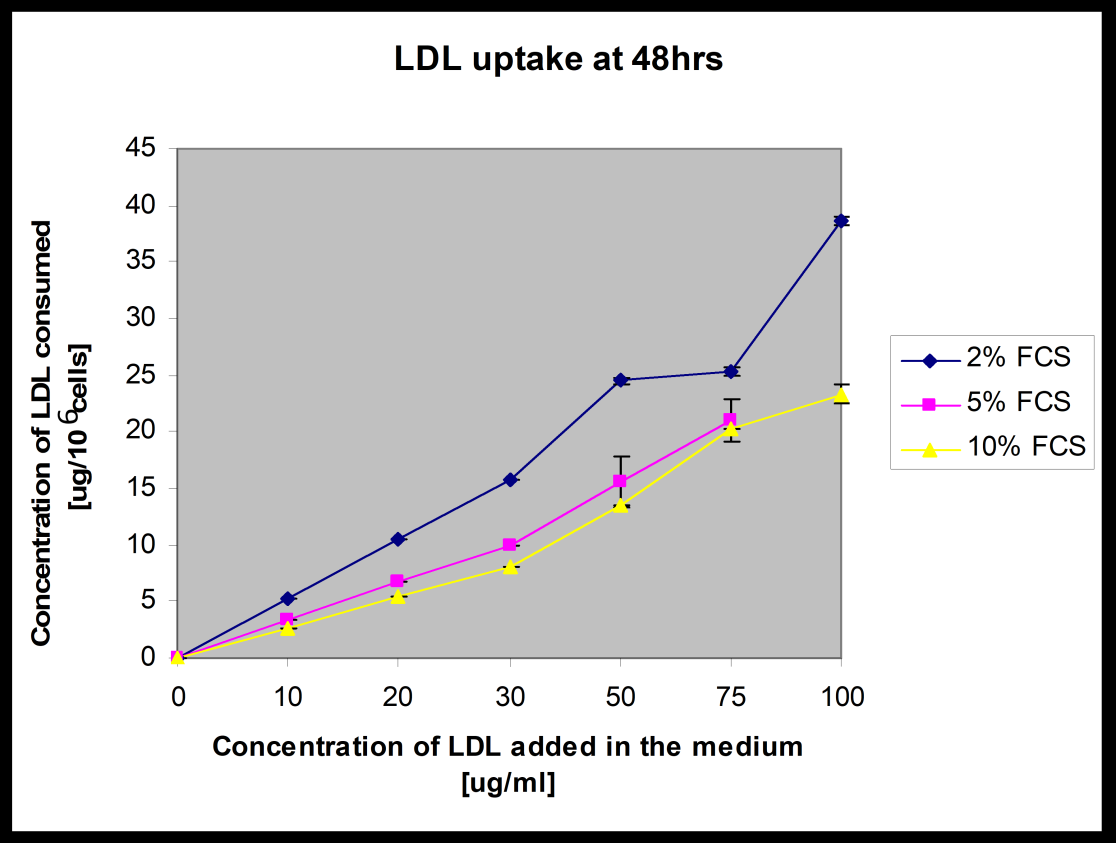
Figure 2(A): LDL uptake by 48hr cultured and serum starved HepG2 cells.
![Figure 3: Cell morphology at various serum concentrations [with and without LDL] after 48hrs incubation. The decrease of serum concentration from 10% to 2% and addition of LDL in the culture medium did not make any change in the cell morphology](/fulltextimages/216/fig_3.jpeg)
Figure 2(B): The figures show increased rate of uptake of LDL by cells at extremely low serum Fortified- medium.
5% FCS 5% FCS +LDL
10% FCS 10% FCS+LDL
Discussion
The low density lipoprotein receptor (LDLR) is a major plasma LDL clearing protein that exists on the plasma membrane of cells except in erythrocytes. The LDL taken into the cells by LDLR provides the cells with metabolic and structural components e.g. essential fatty acids, cholesterol and amino acids for cellular growth and proliferation. The known feedback mechanism for LDLR expression [10] is related to the maintenance of plasma cholesterol balance in relation to intracellular cholesterol pool by the control of plasma membrane located LDL receptor’s functional activity. Functionally hyperactive LDL receptors add more cholesterol to intracellular pool. In non-steroidogenic cells the intracellular cholesterol pool is maximally used for membrane synthesis and metabolic maintenance. Since cell replication is associated with new membrane formation; cholesterol is substantially used for new cell generation or in other words more cholesterol store stimulates new cell formation i.e. cell proliferation. This study has shown that cells with its progress into the severity of starvation get more and more sensitive for procuring LDL to restore its normal growth pattern. This model culture study has shown that serum starved cells are more vibrant than cells in complete medium (serum fortified) to consume growth promoter molecules like LDL. The immerging reports have also shown the presence of cholesterol in association with sphingomyelin in the cell nucleus [18]. It is also true that DNA multiplication will fail to produce new cells without membrane formation. Cholesterol is one of the major components of cell membrane. Hence, the intracellular cholesterol concentration is needed to be increased side by side with
References
-
Holtta-Vuori M, Tanhuanpaa K, Mobius W, Somerharju P, Ikonen E (2002) Modulation of cellular cholesterol transport and homeostasis by Rab11. Mol Biol Cell 13(9): 3107-3122.
-
Brown MS, Goldstein JL (1986) A receptor-mediated pathway for cholesterol homeostasis. Science 232(4746): 34-47.
-
Choi YS, Freeman DA (1998) The movement of plasma membrane cholesterol through the cell. In: Chang TY (Eds.) Intracellular Cholesterol Trafficking. Kluwer Academic Publishing, Boston, pp 101-121.
-
Vance DE, Van den Bosch H (2000) Cholesterol in the year 2000. Biochim Biophys Acta 1529(1-3): 1-8.
-
Frolov A, Zielinski SE, Crowley JR, Dudley-Rucker N, Schaffer JE, et al. (2003) NPC1 and NPC2 regulate cellular cholesterol homeostasis through generation of low density lipoprotein cholesterol-derived oxysterols. J Biol Chem 278(28): 25517-25525.
-
Sugii S, Reid PC, Ohgami N, Du H, Chang TY (2003) Distinct endosomal compartments in early trafficking of low density lipoprotein-derived cholesterol. J Biol Chem 278: 27180-27189.
-
Goldstein JL, Anderson RGW, Brown MS (1990) Coated pits, coated vesicles and receptor mediated endocytosis. Nature 279(5715): 679-685.
-
Mark T Mc Auley, Darren J Wilkinson, Janette JL Jones, Thomas BL Kirkwood (2012) A whole-body mathematical model of cholesterol metabolism and its age-associated dysregulation. BMC Systems Biology (Open Access) 6: 130.
-
Pelton K, Coticchia CM, Curatolo AS, Schaffner CP, Zurakowski D (2014) Hypercholesterolemia Induces Angiogenesis and Accelerates Growth of Breast Tumors in Vivo. Am J Pathol 184(7): 2099-2110.
-
Brown MS, Goldstein JL (1997) The SREBP pathway: regulation of cholesterol metabolism by proteolysis of a membrane bound transcription factor. Cell 89(3): 331-340.
-
Havel RJ, Eder HA, Bragdon JH (1995) The distribution and chemical composition of ultra centrifugally separated lipoprotein in human serum. J Clin Invest 34(9): 1345-1353.
-
Zlatkis A, Zak B (1969) Study of a new cholesterol reagent. Anal Biochem 29(1): 143-148.
-
Bradford MM (1976) A rapid and sensitive method for the quantization of microgram quantities of protein using the principle of protein dye binding. Anal Biochem 72: 248-254.
-
Gopalakrishnan Ramakrishnan, Anita Rana, Chandana Das, Nimai Chand Chandra (2007) Study of low- density lipoprotein receptor regulation by oral (steroid) contraceptives: desogestrel, levonorgestrel and ethinyl estradiol in JEG-3 cell line and placental tissue. Contraception 76(4): 297-305.
-
Gopalakrishnan Ramakrishnan, Albina Arjuman, Shilpa Suneja, Chandana Das, Nimai C Chandra (2012) The association between insulin and low-density lipoprotein receptors. Diabetes & Vascular Disease Research 9(3): 196-204.
-
Bruinink A, Tobler U, Halg M, Grunert J (2004) Effects of serum and serum heat-inactivation on human bone derived osteoblast progenitor cells. J Mater Sci Mater Med 15(4): 497-501.
-
Huang FP, Stott DI (1995) Dual inhibitory and stimulatory activities in serum from SLE patients and lupus mice that regulate the proliferation of an IL-2- dependent T cell line. Lupus 4(4): 297-303.
-
Albi E, Peloso I, Viola Magni MP (1999) Nuclear membrane sphingomeylin-cholesterol changes in rat liver after hepatectomy. Biochemical and Biophysical Research Communications 262(3): 692-695.
- Investigation of Polymorphisms in PPAR-Ɣ and TRHR Genes and their Impact on Turkish Diabetic and Obese Individuals
- The Impact of Aircraft Noise Exposure on the Efficacy of Empagliflozin Therapy in an Animal Model of Obesity
- Rooibos Mitigates Metabolic and Inflammatory Dysfunctions in Mice Fed a High-Carbohydrate Diet
- Synergistic Effect of Combined Leaf Extract of Vernonia amygdalina, Ocimum gratissimum, and Zingiber officinale Tuber on Phytochemical Profile, Antioxidant Activity, Serum Insulin, and Biochemical Parameters in Streptozotocin-Induced Diabetic Rats
- Investigation of Cardiovascular Responses to Aerobic Exercise in Obese University Students
- A Look at the Phase Angle Obtained by Electrical Bioimpedance