Relationship of Serum C - Reactive Protein with Indices of Metabolic Syndrome among Type 2 Diabetic Pakistani Subjects
Back ground: Metabolic syndrome is risk factor for diabetes and inflammation is the characteristic of metabolic syndrome. The C-reactive protein (CRP) is highly conserved and preferred marker of inflammation. Objective: This cross sectional study was conducted on newly diagnosed type 2 diabetic patients to evaluate the status of CRP with potential risk factors of diabetes including glycemic levels, obesity and lipid profile on their first visit to Amin Hayat Memorial Hospital Lahore. Methods: In this study a total of 100 subjects with age range 40-65 years were included. The subjects were stratified into 4 categories underweight, normal weight, overweight and obese subjects according to Asian standards. Different demographic parameters age, gender, BMI, waist circumference, WHR, B.P, personal history, socioeconomic status were recorded. Serum CRP level was assessed by ELISA technique. Lipid profile was assessed by Hitachi chemical analyzer. Results: It was concluded from the present study that serum CRP level (mg/L) and triglyceride level (mg/dl) were significantly higher among newly diagnosed type-2 diabetic subjects and CRP was significantly associated with indices of metabolic syndrome (BMI, Lipid profile) and random glucose level (
Introduction
An increase in the incidence and prevalence of diabetes mellitus and its complications has been observed in recent decades [1]. In Pakistan according to the National Health Survey the prevalence of diabetes among the population age >35 years, is 22.4% [2].High sensitive C - reactive protein is preferred and sensitive marker of inflammation [3]. CRP is a highly conserved plasma protein [4]. Levels of CRP in plasma usually rise dramatically after myocardial infarction. When glucose level is increased in blood a number of intracellular proteins are released from the damaged cells [5]. Chronic Inflammation has been postulated to play a role in the pathogenesis of diabetes mellitus [6]. Insulin resistance, obesity and lipolysis act as inflammatory stimulus for the elevated level of CRP and CRP measurement predicts the diabetes [7, 8]. CRP level is low in prediabetic subjects and elevated levels predict diabetes. Elevated level indicates that there is high risk for development of diabetes and CVD [9, 10].Diabetic subjects with metabolic syndrome have high risk for CVD than diabetic subjects without metabolic syndrome [12, 13]. Limited information is available about the relationship of CRP with other indices of metabolic syndrome from Pakistani population. This study was conducted to evaluate the association between CRP and other traditional risk factors of diabetes among newly diagnosed type 2 diabetic subjects.
Materials and Methods
This cross-sectional study was conducted on 100 newly diagnosed diabetic subjects (age range 40-65 years) who attended the Amin-Hayyat Memorial Hospital in Lahore from Jan 2010 to June 2010. During the study period these subjects were diagnosed as hyperglycemic. They were informed verbally to visit the clinic after 12-hrs fast for detailed checkup. All the subjects in the study completed a questionnaire that included information about the subject΄s age, height, weight, BMI, WHR ratio, personal habits, family history of diabetes, duration of disease, disease history, dietary pattern, systolic and diasystolic blood pressure, and socioeconomic status of the subjects. We calculated the body mass index by measuring the weight of each subject in kilogram and individual body weight is divided by the square of his or her height. WHR was also calculated. Baseline biochemical tests included both fasting and random blood glucose levels and lipid profile (triglyceride, cholesterol, HDL and LDL) by chemistry analyzer. Cholesterol CHOD-pap kit was used for the cholesterol assessment by Hitachi 902 biochemical analyzer. Cobas triglycerides GPO-PAP kit was used for the assessment of serum triglyceride by using Hitachi 902 biochemical analyzer. Cobas HDL-C plus 3rd generation kit was used for the measurement of HDL serum cholesterol. CE Fluitest LDL- Cholesterol kit was used for the LDL measurement (Hitachi 902 Chemistry analyzer). CRP was measured by using high sensitive sandwiched enzyme linked immunoassay. The high sensitivity C-reactive protein (hsCRP) kit is intended for the quantitative determination of C-reactive protein (CRP) in human serum. In general population reference range for CRP is 0.05-0.20 mg/l (Naik, 2007). CRP level is a criteria to diagnose the diabetes. Patients with CRP level below this range were considered to be normal and patients above this range were diabetics.
Statistical Analysis
Statistical analysis of demographic and biochemical parameters was performed. The difference between the groups and within the groups was done by ANOVA using Post Hoc Tukey test. Pearson’s correlation was calculated to find the correlation between CRP and glycemic level. All the statements of significance are based on the 0.05 level of probability at 95% confidence interval. All the statistical analysis applied in this study, was done by using SPSS version 13.0.
Results
The study was conducted on newly diagnosed type-2 diabetic patients to evaluate the serum CRP and its relationship with indictors of metabolic syndrome.
Anthropometric Measurement
Mean age value for all the subjects was 51.52 ± 0.787 years, mean value for the BMI was 25 ± 0.458 kg/m2 and mean value for the WHR was 1.002 ± 0.0008 cm.
BMI
Subjects were stratified into four groups on the basis of BMI. 9% subjects were included in the underweight group, 39% subjects were included in the normal weight group, 30% subjects were included in the overweight group and 22% subjects were in obese group. Descriptive Statistics revealed that the mean values for these BMI groups were 17.267 ± 0.267 kg/m2, 21.607 ± 0.216 kg/m2, 26.391 ± 0.207 kg/m2, 33.424 ± 0.677 kg/m2 respectively. The number of individuals in underweight group (<18.5 kg/m2) was 8. Mean age value for this group was 52.6 ± 1.84 years; mean value for WHR was 0.974 ± 0.016 cm, mean value for random glucose was 276.2 ± 16.8 mg/dl. Mean value for CRP was 2.30 ± 0.80 mg/l and showing significant difference at p<0.05. The number of individuals in normal weight group (18.5-24.9 kg/m2) was 35. Mean age value for this group was 50.3 ± 1.47 years; mean value for WHR was 1.02 ± 0.01 cm, mean value for random glucose was 278 ± 8.44 mg/dl. Mean value for CRP was 3.82 ± 0.39 mg/l and showing significant difference at p<0.05. The number of individuals in overweight group (25-29.9 kg/m2) was 27. Mean age value for this group was 51.9 ± 1.25 years; mean value for WHR was 0.99 ± 0.009 cm, mean value for random glucose was 290.1 ± 6.94 mg/dl and mean value for CRP was 4 ± 0.54 mg/l (p<0.05).
The number of individuals in obese group (≥30 kg/m2) was 20. Mean age value for this group was 52.7 ± 1.38 years; mean value for WHR was 2.96 ± 1.97 cm, mean value for random glucose was 294.1 ± 8.87 mg/dl and mean value for CRP was 4.33 ± 0.59 mg/l (p<0.05) (Table 1).
| Parameters | Underweight | Normal weight | Overweight | Obese | ANOVA |
|---|
Table 1: Demographic and Biochemical Characteristics of Study Population by BMI groups * Significant Data is presented in the for
| (n) | (n) | (n) | (n) | ||
|---|---|---|---|---|---|
| 8 | 35 | 27 | 20 | p-value | |
| mean ± SEM | mean ± SEM | mean ± SEM | mean ± SEM | ||
| Age (years) | 52.6 ± 1.84 | 50.3 ± 1.47 | 51.9 ± 1.25 | 52.7 ± 1.38 | - |
| WHR (cm) | 0.974 ± 0.016 | 1.02 ± 0.01 | 0.99 ± 0.009 | 2.96 ± 1.97 | - |
| Fasting glucose(mg/dl) | 212.3 ± 14.5 | 192.8 ± 7.90 | 194.4 ± 7.41 | 198 ± 9.68 | >0.05 |
| Random glucose(mg/dl) | 276.2 ± 16.8 | 278 ± 8.44 | 290.1 ± 6.94 | 294.1 ± 8.87 | <0.05* |
| Cholesterol (mg/dl) | 194.7 ± 11.7 | 192 ± 5.74 | 189 ± 7.22 | 190 ± 8.64 | >0.05 |
| Triglyceride (mg/dl) | 198 ± 20.5 | 216 ± 13.5 | 232 ± 21.6 | 233 ± 15.8 | <0.05* |
| HDL (mg/dl) | 38.4 ± 1.91 | 39.4 ± 0.8 | 39.57 ± 1.93 | 38.69 ± 0.97 | >0.05 |
| LDL (mg/dl) | 134.3 ± 10.6 | 124 ± 4.44 | 117.4 ± 5.61 | 114 ± 5.17 | >0.05 |
| CRP (mg/l) | 2.34 ± 0.80 | 3.82 ± 0.39 | 4 ± 0.54 | 4.33 ± 0.59 | <0.05* |
Table 2: Demographic and Biochemical Characteristics of Study Population by BMI groups * Significant Data is presented in the for
Biochemical Analysis
Glycemic Level
Mean concentrations of fasting and random glucose were 195.93 ± 4.58 and 286.83 ± 4.34 mg/dl respectively. Glycemic level was observed in BMI groups. The mean concentration of random glucose
294.1 ± 8.87 mg/dl was significantly higher in obese subjects (BMI 4) when compared with overweight, normal weight and underweight subjects (p <0.05) and the mean random glucose concentration 276.2 ± 16.8mg/dl was significantly lower in underweight subjects (BMI 1) when compared with normal, overweight and obese subjects (p<0.05).
Lipid Profile
A significant gender difference for lipid profile was observed (p<0.05) (Table 1).
| Parameters | All | Male | Female | ||||||
|---|---|---|---|---|---|---|---|---|---|
| mean ± SEM | mean ± SEM | mean ± SEM | |||||||
| Age (Years) | 51.52 ± 0.787 | 53.63 ± 0.924 | 48.4 ± 1.3 | ||||||
| Height (cm) | 166.8 ± 1.21 | 170.2 ± 1.67 | 161.4 ± 1.47 | ||||||
| Weight (kg) | 69.08 ± 1.14 | 73.42 ± 1.36 | 62.58 ± 1.69 | ||||||
| BMI (Kg/m2) | 25 ± 0.458 | 25.7 ± 0.54 | 25 ± 0.811 | ||||||
| Waist (cm) | 97.69 ± 0.962 | 96.83 ± 1.35 | 98.98 ± 1.29 | ||||||
| Hip (cm) | 97.28 ± 0.738 | 96.51 ± 0.99 | 98.43 ± 1.07 | ||||||
| WHR | 1.002 ± 0.008 | 1 ± 0.01 | 1.003 ± 0.008 | ||||||
| Fasting Glucose(mg/dl) | 195.93 ± 4.58 | 196.7 ± 5.6 | 194.87 ± 7.82 | ||||||
| Random Glucose(mg/dl) | 286.83 ± 4.34 | 283.62 ± 5.49 | 295 ± 7.08 | ||||||
| Cholesterol (mg/dl) | 189 ± 3.74 | 186 ± 4.96 | 192 ± 5.7 | ||||||
| Triglycerides (mg/dl) | 223 ± 112.65 | 225 ± 10.6 | 204 ± 16.8 | ||||||
| HDL (mg/dl) | 39.1 ± 0.702 | 38.4 ± 0.577 | 40 ± 1.53 | ||||||
| LDL (mg/dl) | 121 ± 2.84 | 118 ± 3.62 | 125 ± 4.55 | ||||||
| CRP (mg/l) | 3.86 ± 0.26 | 3.90 ± 0.34 | 3.8 ± 0.43 |
Table 3: Demographic and Biochemical Characteristics of Study Population
Data is presented in the form of mean and standard error mean. Table 2: Demographic and Biochemical Characteristics of Study Population
C- Reactive Protein
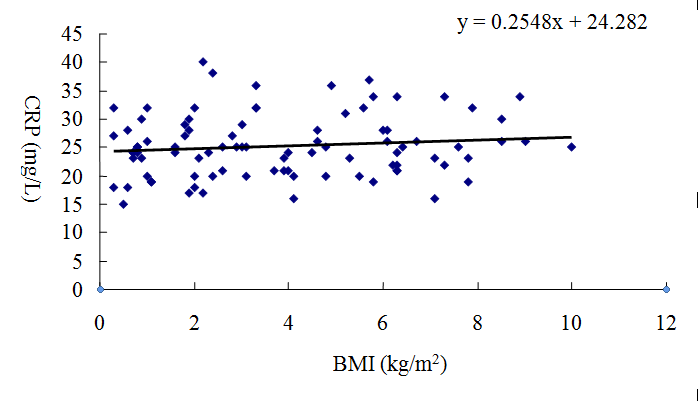
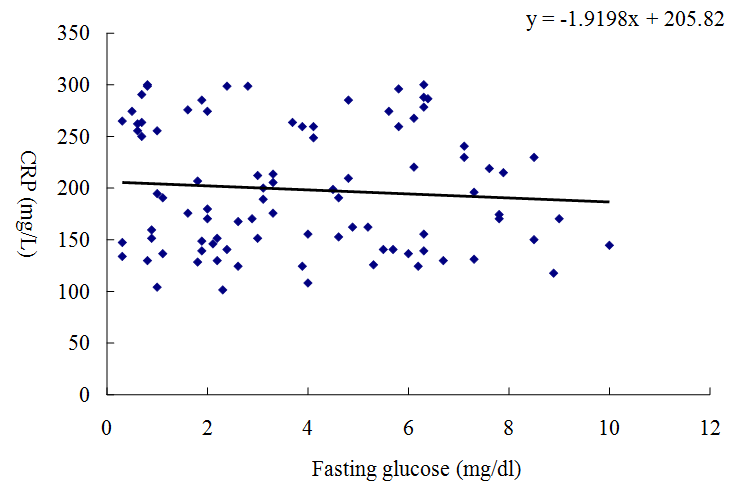
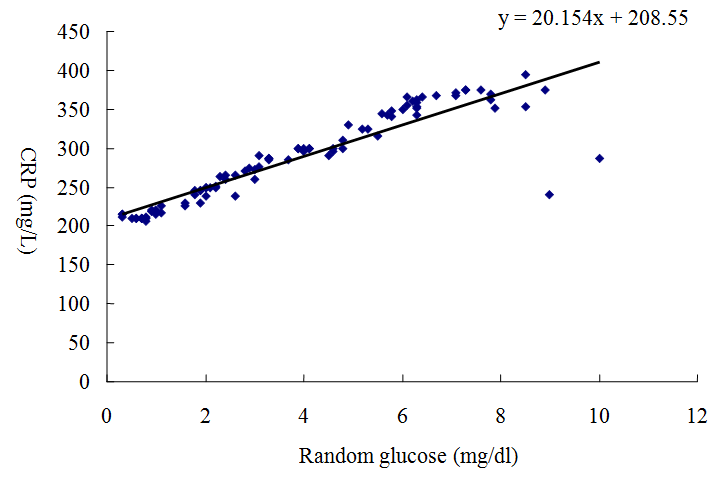
CRP was compared in different BMI groups, in addition to this CRP was associated with glycemic levels. The mean CRP concentration 4.33 ± 0.59 mg/l was significantly higher in obese subjects (≥30 kg/m2) when compared with overweight subjects (25-29.9 kg/m2) 4 ± 0.44 mg/l (p <0.05). The mean CRP concentration 4 ± 0.44 mg/l was significantly higher in overweight subjects when compared with normal subjects (18.5-24.9 kg/m2) 3.82 ± 0.39mg/l (p <0.05). The mean CRP concentration 3.82 ± 0.39 mg/l was significantly higher in normal subjects when compared with underweight subjects (<18.5 Kg/m2) 2.34 ± 0.80 mg/l (p <0.05). A comparison of the serum CRP concentration among different BMI groups has been shown by the bar graph that revealed the highest value of CRP was in the obese group (≥30 kg/m2) (Figure 1). Statistical analysis reveals that there was significant difference between CRP and BMI groups (p<0.05). Significant correlation was observed between CRP (mg/L) and BMI (kg/m2) (r =0.123, p <0.05). As shown in (Figure 2). Significant correlation was observed between CRP (mg/L) and Random glucose (mg/dl) for fasting glucose (Figure 3, 4). Correlation values for them were (r =0.98, p<0.01) and (r = -0.43, p<0.05) respectively.
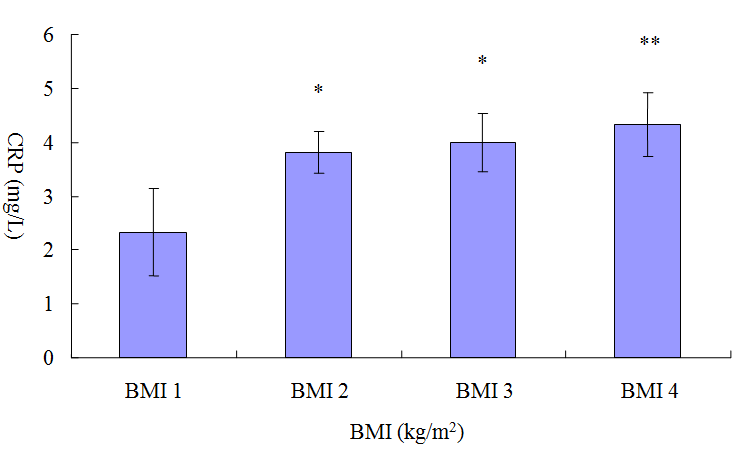
Figure 1: Comparison of the C-Reactive protein among different BMI groups. BMI 1: Underweight subjects (<18.5 Kg/m2). BMI 2: Normal weight subjects (18.5-24.9 kg/m2). BMI 3: Overweight subjects (25-29.9 kg/m2). BMI 4: Obese subjects (≥30 kg/m2). Significance *-- Difference between the groups (BMI 1 and BMI 2, BMI 1 and BMI 3) is significant (p < 0.05). **-- Difference between the groups is highly significant (BMI 1 and BMI 4) (p < 0.01).
Discussion
Diabetes mellitus is one of the most abundant disorders. In an estimate it was observed that 6.2 million people have diabetes in Pakistan. This is expected to rise up to 11.6 million by 2050 [14]. Sedentary lifestyle and nutrional habits have increased the obesity among populations. Obesity is a major metabolic disorder for diabetes and other complications [15]. The metabolic syndrome which comprises the central obesity is a risk factor for the development of diabetes [16]. In this study we assess the relationship of CRP with indices of metabolic syndrome and type 2 diabetes. Increased level of the nontraditional risk factor CRP is associated with metabolic syndrome and type2 diabetes. In obese subjects gain in body weight was observed which was higher than normal group. This weight gain in diabetic subjects may be due to the reduction in removal rate of cholesterol and triglycerides which is due to the decrease in the lipolytic activity. In underweight subjects loss in body weight was observed than normal subjects. This reduction in weight may be due to the accelerated rate of degradation of most lipids out of proportion to synthesis, so body lipid depot consequently become depleted and levels of various plasma lipid components fall. In the present study BMI was positively associated with the CRP (r =0.123) and a strong risk factor for the occurrence of metabolic syndrome and diabetes. Mean concentration of CRP increases with increasing BMI. CRP value is significantly higher in obese subjects and CRP value is significantly lower in underweight subjects. In present study Random plasma glucose was closely associated with CRP. There was a positive significant correlation between them (r =0.98) which indicate direct relation between CRP and Random plasma glucose. Obese subjects have elevated CRP level than overweight subjects because obese subjects have high random plasma glucose level than plasma glucose level of overweight subjects. Similarly CRP level of overweight subjects was high than normal weight subjects and CRP level of normal subjects was high than underweight subjects because random glucose level of overweight subjects was high than normal weight subjects and random glucose level of normal subjects was high than underweight subjects. This result indicates that as plasma glucose level was increased, CRP concentration was also increased. Our finding about Fasting glucose level reveals that it was not significantly associated with CRP. In present study 15.5% individuals were observed whose CRP level is less than 1 mg/l and have low risk for diabetes. 53.3% individuals were observed whose CRP level is between 1-3 mg/l and have moderate risk for diabetes. 31.1% individuals were observed whose CRP level is greater than 3 and have high risk for diabetes. No individual was observed whose CRP is greater than 10 mg/l. Waist circumference, triglycerides, fasting plasma glucose concentration and blood pressure are important risk factors for diabetes. In the present study triglyceride level was positively associated with the BMI and a strong risk factor for the occurrence of diabetes. In this study we observe that there was no significant difference in HDL, LDL and cholesterol levels of overweight and obese subjects. The difference among the groups is non-significant (p>0.05) according to statistical analysis. These results showed that there was no association between BMI and lipid profile. Conflicting results from other studies have been reported. This may be due to socioeconomic factors which determine the access to health center. It was concluded from the present study that serum CRP level and triglycerides level were significantly higher in newly diagnosed type-2 diabetic subjects and it was significantly associated with indicators of metabolic syndrome BMI, Lipid profile and random glucose level among diabetic subjects but association was not significant with fasting glucose level.
Acknowledgments
We gratefully acknowledge Dr. M Abu Zafar of Amin Hayat Memorial Hospital for facilitating research work throughout the study period. We acknowledge the financial support of Lahore College for Women University.
References
-
Kollias NA, Ulbig WM (2010) Diabetic retinopathy. Dtsch Arztebl Int 107(5): 75-84.
-
Sheraa S, Basitb A, Fawwadc A, Hakeem R, Ahmedani MY, et al. (2010) Pakistan National Diabetes Survey: Prevalance of glucose intolerance and associated factors in Punjab Province of Pakistan. Prim Care Diabetes 4(2): 79-83.
-
Thang SH, Naveed S, William K, Gonzalez- Villalpando C, Lean ME et al. (2002) Prospective Study of C-Reactive Protein in relation to the Development of Diabetes and Metabolic syndrome in the Mexico City Diabetes Study. Diabetes Care 25(11): 2016-2021.
-
Black S, Agrawal A, Smols D (2004) C-reactive protein. Immunol 279 (47), 48487-48490.
-
Naik P (2007) Coronary heart disease, Cardiac markers and Lipid profile: Biochemistry 2nd (edn) J Medical publisher, USA, pp.530-540.
-
Pickup JC, Crook MA (1998) Is type 2 diabetes mellitus a disease of the innate immune system? Diabetologia 41(10): 1241-1248.
-
Visser M, Bouter LM, McQuillan GM, Wener MH, Harris TB (1999) Elevated C - Reactive Protein Levels in Overweight and Obese Adults. JAMA 282(22): 2131-2135.
-
Aruna D, Pradhan MD, Joann E (2001) C - reactive protein, Interleukin6 and Risk of Developing Type-2 Diabetes Mellitus. JAMA 286(3): 327-334.
-
Grau AJ, Buggle F, Becher H, erle E, Hacke W (1996) The association of leukocyte count, fibrinogen and C-reactive protein with vascular risk factors and ischemic vascular diseases. Thromb Res 82(3): 245- 255.
-
Pickup JC, Mattock MB, Chusney GD, Burt D (1997) NIDDM as a disease of the innate immune system: Association of acute phase reactants and Interleukin-6 with metabolic syndrome X. Diabetologia 40(11): 1286-1292.
-
Pepys MB (1996) The acute phase response and C- reactive protein: Oxford Textbook of Medicine. New York 1527-1533.
-
Hunt KJ, Resendez RG, William K, Haffner SM, Stern MP, et al. (2004) National Cholesterol Education Program versus World Health Organization metabolic syndrome in relation to all cause and cardiovascular mortality in the San Antonio Heart Study. Circulation 110(10): 1251-1257.
-
Mendall MA, Patel P, Ballam L, Strachan D, Northfield TC (1996) C-reactive protein and its relation to cardiovascular risk factors: Population based cross-sectional study. BMJ 312(7038): 1061- 1065.
-
West S, Sommer A (2001) Prevention of blindness and priorities for the future. Bulletin of World Health Organization 79: 244-248.
-
Kahn SE, Zinman B, Haffner SM, O'Neill MC, Kravitz BG, et al. (2006) Obesity is a major determinant of the Association of C-Reactive Protein Levels and the Metabolic Syndrome in Type2 Diabetes. Diabetes 55(8): 2357-2364.
-
Juhan-Vague I, Alessi MC, Mavri A Morange PE (2003) Plasminogen activator inhibitor-1, inflammation, obesity, insulin resistance and vascular risk. J Throm Haemost 1(7): 1575-1579.
- Investigation of Polymorphisms in PPAR-Ɣ and TRHR Genes and their Impact on Turkish Diabetic and Obese Individuals
- The Impact of Aircraft Noise Exposure on the Efficacy of Empagliflozin Therapy in an Animal Model of Obesity
- Rooibos Mitigates Metabolic and Inflammatory Dysfunctions in Mice Fed a High-Carbohydrate Diet
- Synergistic Effect of Combined Leaf Extract of Vernonia amygdalina, Ocimum gratissimum, and Zingiber officinale Tuber on Phytochemical Profile, Antioxidant Activity, Serum Insulin, and Biochemical Parameters in Streptozotocin-Induced Diabetic Rats
- Investigation of Cardiovascular Responses to Aerobic Exercise in Obese University Students
- A Look at the Phase Angle Obtained by Electrical Bioimpedance