Screening of Diabetic Patients for Frailty with the Frail Scale: A Comparison with the Fried’s Phenotype Criteria in Saudi Arabia
Background and Aims: Frailty is a serious health issue that is associated with the decline of muscle and nerve functions. Several conditions have been associated with frailty, such as dementia, cancer, and diabetes. The aim of the study is to evaluate the prevalence of frailty in Saudi diabetic patients and assess the association between diabetes and frailty. Also, to investigate if the FRAIL scale is an adequate tool to identify frail patients to pre-frail and healthy patients. Methods: Seventy-eight participants were divided into three categories; group-I, the control group, included 31 healthy men 65 to 75 years, group-II 25 patients with DM2 aged 50–64, and group-III included 22 patients with DM2 aged 65–80 years old. Frailty index using Fried’s criteria (CHS) and FRAIL scale was determined for all the participants. In ROC analysis, we evaluated diagnostic accuracy and AUC areas of the FRAIL scale compared with the CHS criteria. Results: Frail patients were more in Group II and III (diabetics) (44%, 55%) respectively than in Group-I (non-diabetics) 10%. People aged 63 years old or more are more likely to have frailty syndrome. Diabetic patients with FBG level ≥ 220 mg/dL, HbA1c level ≥ 9.5%, are more likely to be frail patients (P-values: 0.029, 0.002) respectively. Comparisons of the FRAIL scale to CHS components showed an independent diagnostic property. Conclusion: Frailty is a very serious condition, and it’s a leading cause of morbidity and mortality. FRAIL scale is a promising diagnostic tool, and more diagnostic studies are recommended.
Highlights
- Frailty is a serious health issue that requires a high level of care.
- Diabetic patients have a higher risk of developing this syndrome.
- An accurate assessment tool is needed to detect patients early.
- Several outcomes related to frailty can be managed if the condition is detected early.
Introduction
Frailty is considered as a geriatric condition [1, 2]. It leads to a decline in muscle and nerve functions and loss of cardiopulmonary function [3]. It is the most serious health issue in the world and the major risk factor for morbidity and mortality in the elderly [4]. Frailty is an impairment in multiple physiologic systems, which leads to a limitation in physical function [1, 5, 6, 7, 8, 9, 10, 11]. There are many other risk factors associated with frailty including socioeconomic factors such as poverty and low educational level; psychologic factors such as depression, and nutritional factors; and also some diseases such as cancer, dementia and endocrine disorder like diabetes mellitus [5, 7, 12, 13, 14, 15]. Several studies showed that frailty is more in older diabetic patients, which results in increasing the mortality in frail than non-frail diabetic patients [16, 17, 18, 19].
Frailty is independent of age, although the prevalence increases with it [20]. In United States, the prevalence of frailty is estimated to be between 4.0–59.1% and when tested, especially among diabetic patients, is estimated to be between 5–48% [21, 22].
Globally, there are a limited number of studies that were conducted to assess the prevalence of frailty in elderly diabetic people. One of these studies was done among the Mexican American population in Texas, and it revealed that diabetes significantly contributes to increased frailty prevalence in older adults.
In 2001, more than 27 definitions were published to diagnose frailty [23, 24]. The frailty phenotype by fried and colleagues the (Cardiovascular Health Study Index [CHS]) [2] and the Frailty Index (FI) by Mitnitski and colleagues [17] are the most two strategies used to diagnose frailty (69% and 12% of published studies, respectively) [24].
However, both strategies (CHS and FI) are challenging to use in clinical settings because they need trained staff to do it. An adequate way used to screen frailty is a simple method using simple instruments, while the complex ones are preserved for specialized geriatric services [25].
There is no study aimed at evaluating the association between diabetes and frailty in Saudi Arabia; despite the increased number of diabetic patients. Therefore, this study is constructed and established to estimate the frailty index in Saudi diabetic patients using CHS score and compared it with the pre-elderly diabetics and age-matched healthy population. Also, to investigate the diagnostic accuracy of FRAIL SCALE with CHS scores (as gold standard in this study).
Methods
The present study included 78 men who attended the Chronic Diseases Clinics, Al- Ahsa, from December 2018 to January 2019. The participants had the following inclusion criteria: age > 50 years for diabetic participants and > 65 years for non-diabetic participants, stable medical condition over the past month, and regular clinical follow-up. Subjects were excluded if they had dementia, Parkinson’s disease, severe depression, or could not complete this study’s procedures. Participants were divided into three groups. Group I included 31 non-diabetic participants between the age of 65 and 75 years and identified as the control group; group II included 25 patients with type 2 DM aged 50-64 years; and group III included 22 patients with type 2 DM 65-80 years old. Written consent has been obtained from participants after informing them of the benefit and purpose of this study.
An extended and detailed medical history was obtained from each participant of groups II and III, emphasizing the onset, duration, and treatment of diabetes. Lab results have been seen from patients’ files for possible additional diagnoses such as myopathy diseases or low testosterone hormone levels.
The FRAIL Scale
The FRAIL scale includes five simple questions [26, 27]. The FRAIL scale is based on self-report without any objective measurement. The five questions require a yes or no answer, with 1 point given to any affirmative response. Four of them were based on the Fried index criteria components [2], and one (i.e., number of illnesses) was based on the Frailty Index (FI) by Mitnitski and colleagues [28]. The score ranges from 0 to 5 points, and based on the score individuals can be classified as non-frail (0 points), prefrail (1 to 2 points), or frail (>3 points). The scale evaluates the presence of fatigue, muscle resistance, aerobic capacity, disease burden, and weight loss. Fatigue is evaluated by asking participants if they felt tired most of the time; muscle resistance is measured by participants’ report on his or her capacity to climb a flight of stairs; aerobic reserve is evaluated by participants’ report on his or her ability to independently walk a block ; disease burden by the presence of 5 or more of a total of 11 diseases (ie, diabetes mellitus, hypertension, cancer, chronic obstructive pulmonary disease, coronary artery disease or myocardial infarction, stroke, congestive heart failure, asthma, chronic renal failure, arthritis,); and unintentional weight loss by 5% or more within the past 6 months.
The Cardiovascular Health Study Index or Fried’s Frailty Phenotype (CHS)
The CHS frailty phenotype includes five objective components (i.e., reduced grip strength, unintentional weight loss, self-reported exhaustion, self-reported low physical activity, and reduced gait speed) assessed according to a predefined protocol [2]. According to the number of criteria they have, individuals are classified as follows: frail (>= 3), prefrail (1 - 2), and non-frail (0). In this study, the CHS criteria measures were performed as follows and received 1 point if: weight loss of 5% or more was reported in the last year; fatigue was reported according to two questions depending on the Center for Epidemiological Studies Depression Scale [29]; the patient was in lowest of physical activity adjusted for sex according to a weighted score of kilocalories expended per week; grip strength in the lowest quintile, adjusted for body mass index (BMI) and gender; and gait speed was in the lowest quintile, depending on needed time to walk a distance equals to 4.6 meters, adjusted for standing height and gender. Strength of grip was obtained by the mean measure of three attempts using a manual hydraulic hand grip device (Jamar model) with the elbow at a 90-degree angle, with a brief rest between measurements, and with verbal stimulation during the measurement.
Group III was compared with their age-matched controls in group I, and group II was compared with group III. Frailty index was correlated with the duration of diabetes in groups II and III, and also with the glycemic level.
Frailty index using CHS score was determined for all participants; patients were categorized as frail when they attain three or more of the following parameters, pre-frail if they fulfilled one or two parameters, and non-frail if they did not attain any of the following parameters: (a) Weight loss: unintentional weight loss of at least 4.5 kg over the last year. (b) Weakness (i.e., low hand-grip strength): tested by grip strength of the dominant hand (mean of three measurements) using a Jamar hand-held dynamometer. The patient is asked to hold the dynamometer in the dominant hand, with the arm at right angles, and the elbow should be placed by the patient’s side. The base rests on the first metacarpal, and the handle rests around the rest of the fingers. Once the patient is ready with the proper seating and the dynamometer’s right grip, the participant should squeeze the device with maximum effort for five seconds. Meanwhile, the participant is not allowed to move any other body part. The cut-off points adjusted for BMI were (1) ≤32 kg for BMI>28; (2) ≤30 kg for BMI 24.1-28; (3) ≤29 kg for BMI≤24. (c)Fatigue or poor endurance: Depression scale is used in this study to evaluate poor endurance. The following two statements are specifically used for the evaluation: (a) ‘I felt that everything I did was an effort’ and (b) ‘I could not get going’. The participant is determined as positive once he fulfills one at the minimum for at least three days over the last week. (d) Slowness: slowness is assessed by asking the participant to stand up from the chair, walk six meters distance, turn around, go back to the chair, and sit down again. The time of this process normally should be approximately 16 seconds. (e) Low physical activity level: the level of physical activity is dependent on the participant’s self-report. Those who have reported not doing daily activities, e.g., gardening, walking, or any sport over the last week are considered physically inactive. Participants were evaluated later for frailty with the FRAIL scale, and the scores for the two scales (FRAIL scale and CHS score) were compared.
Statistical Analysis
Data were collected and coded and then entered into an IBM compatible computer using SPSS version 21. Addition to the obtained frequency tables, means and SDs were used to summarize data of categorical variables. Statistical significance was evaluated by Chi-square tests; with P values corrected using the Monte Carlo method for better precision. Receiver operating characteristic (ROC) analyses were performed to assess the diagnostic accuracy of the FRAIL scale and calculating areas under the curve (AUCs), sensibilities, specificities, positive predictive values, and negative predictive values. The CHS criteria were used as the gold standard to identify frailty status in accuracy analyses. Four items of the FRAIL scale were compared with correspondent components of the CHS by Chi-square test. The level of statistical significance was set at .05 level in 2-tailed tests.
Verbal consent from the participants has been taken before starting the study. It was clear to all participants that confidentiality and de-identification of data are respected in the study. Lastly, ethical clearance from the IRB committee in King Fahad Hospital, AlAhssa, has been taken.
Results
A total of 78 participants were included in the present study, 43 of them were males (55.1%), and 46 were diabetics (59%) (Table 1). According to their age and diabetes status, participants were divided into three groups (Table 2). The age range in group I was 65-75 years, with a mean of 70.4± 5.7 years; the age range in group II was 50-64 years, with a mean of 58.4 2.8 years; and the age range in group III was 65- 80 years, with a mean of 71.6 4.9 years. Participants of both groups II & III were diabetic patients, with a range duration of DM 5 – 11 years, 11 – 15 years, respectively. Participants in group I were non-diabetics.
| Variable | Frequency | (%) |
|---|---|---|
| Gender | ||
| Male | 43 | 55.1 |
| Female | 35 | 44.9 |
| Presence of Diabetes | ||
| Yes | 46 | 59 |
| No | 32 | 41 |
Table 1: Characteristics of the participants involved in the study.
| Group | N | Age Range | Mean ± SD | Duration of DM | FBG(mg/dL) | HbA1c (%) |
|---|---|---|---|---|---|---|
| Non-Diabetic Patients (Group I) | 31 | 65-75 | 70.4 ± 5.7 | - | - | - |
| Diabetic Patients (Group II) | 25 | 50-64 | 58.4 ± 2.8 | 5-11 Years | 213 ± 44 | 9.4 ± 1.2 |
| Diabetic Patients (Group III) | 22 | 65-80 | 71.6 ± 4.9 | 11-15 Years | 217 ± 44 | 10.2 ± 1.8 |
Table 2: Distribution of the studied groups according to age (years). DM: Diabetes Mellitus; FBG: Fasting Blood Glucose; HbA1c, g
Regarding the evaluation of frailty status using CHS score, in group I, twenty patients (65%) were non-frail, eight (25%) were prefrail, and three (10%) were frail; in group II, eight patients (32%) were non-frail, six (24%) were prefrail, and eleven (44%) were frail; and in group III, four patients (18%) were non-frail, six (27%) were prefrail, and twelve (55%) were frail (Table 3). There was a significant difference between groups I and II, groups I and III in favor of participants in groups II and III, more likely to be frail than patients in group I. (P-value: 0.009, <0.001), respectively. Nevertheless, there was no significant difference between groups II and III (P-value: 0.552).
| Parameters | Group I | Group II | Group III | ||
|---|---|---|---|---|---|
| Friedd index score (CHS) | n (%) | n (%) | n (%) | ||
| Nonfrail(0) | 20 (65) | 8 (32) | 4 (18) | ||
| prefrail (1-2) | 8 (25) | 6 (24) | 6 (27) | ||
| Frail (3-5) | 3 (10) | 11 (44) | 12 (55) | ||
| Total | 31 (100) | 25 (100) | 22 (100) | ||
| Group I vs. Group II | Group I vs. Group III | Group II vs. Group III | |||
| Chi-square | P value | Chi-square | P value | Chi-square | P value |
| 9.466 | 0.009* | 15.264 | <0.001* | 1.19 | 0.552 |
Table 3: Comparison between the studied groups regarding CHS score. *Correlation is significant at the 0.05 level.
Concerning the effect of the variables on the CHS score, the analysis showed that frailty syndrome (CHS score ≥ 3) is more likely to be present in participants who are 63 years old or more (p-value: 0.047) (Table 4). Similarly, there was a significant correlation between the CHS score and degree of Variables Fixed index score (CHS) Person Chi-Square p-Value ≥ 3 (Frail) n (%) < 3 (Non-Frail) n (%) Age < 63 years-old 11 (50) 11 (50) 3.83 10047* ≥ 63 Years-old 15 (26.8) 41 (73.2) Gender Males 12 (27.9) 31 (72.1) 1.27 0.188 Females 14 (40) 21 (60) FBG < 220 mg/dL 9 (34.6) 17 (65.4) 4.776 0.029* ≥ 220 mg/dL 14 (66.7) 7 (33.3) HbA1c < 9.5 5 (23.8) 16 (76.2) 9.591 0.002* ≥ 9.5 18 (69.2) 8 (30.8) glycemic control, in favor of patients who have FBG level 220 mg/dL or more, HbA1c level 9.5% or more, are more likely to have score 3 or more (P-values: 0.029, 0.002) respectively. There was no significant difference in the score regarding gender.
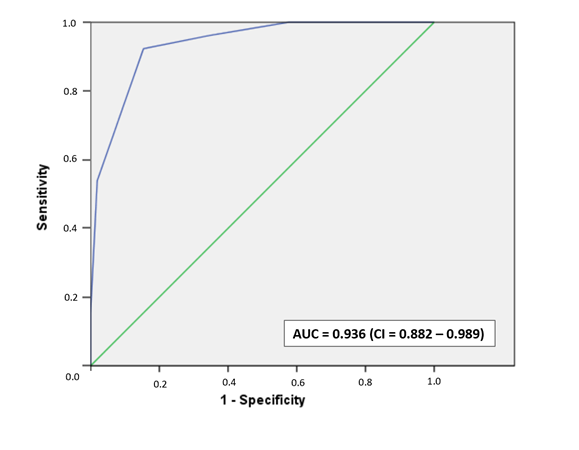
Prevalence of frailty differed according to the FRAIL scale (n = 33; 42.3%) and CHS score (n = 26; 33.3%) (Table 5). Twenty-four participants were classified as being frail by both instruments. Participants classified as non-frail using the FRIED index were 32 in comparison to the FRAIL scale 22. The two instruments appeared to be independent in the diagnostic evaluation of the sample (p = < 0.001) (Table 5). In ROC analyses, FRAIL SCALE AUC, was 0.936 (CI = 0.882 – 0.989) (Figure 1). By the cut-off score of >= 3 on the FRAIL scale, frailty was detected with a 0.923 sensitivity, and 0.827 specificity, positive likelihood ratio 5.3, and negative likelihood ratio 0.09 (Table 6).
| FRIED index score (CHS) | P-value | |||
|---|---|---|---|---|
| Frail, n=26 | Pre-frail, n=20 | Non-frail, n=32 | ||
| FREIL SCALE, n (%) | ||||
| Frail | 24 (92.3) | 5 (25) | 4 (12.5) | <0.001 |
| Pre-frail | 2 (7.7) | 8 (40) | 13 (40.6) | |
| Non-frail | 0 (0) | 7 (35) | 15 (46.9) |
Table 4: Prevalence of frailty differed according to the FRAIL scale (n = 33; 42.3%) and CHS score (n = 26; 33.3%)
| FRIED index score (CHS) | ||||
|---|---|---|---|---|
| ≥ 3 (Frail) | 3 < (Non-frail) | Total | ||
| FRAIL SCALE | ||||
| Frail patient | 24 | 9 | 33 | |
| Non Frail patient | 2 | 43 | 45 | |
| Total | 26 | 52 | 78 | |
| % | ||||
| Sensitivity | 92.3 | |||
| Specificity | 82.7 | |||
| Positive predictive value | 72.7 | |||
| Negative predictive value | 95.6 | |||
| Positive likelihood ratio | 5.3 | |||
| Negative likelihood ratio | 0.09 |
Table 5: Sensitivity, specificity, Predictive Values, and Likelihood ratios for identification of Frailty by using of FRAIL scale
Discussion
Aging is characterized by many syndromes and frailty is one of the most serious aging problems [1, 2], it is associated with poor prognosis including falls, high mortality and morbidities [1, 2, 3]. Diabetes mellitus type 2 plays major roles in accelerating the aging process, and diabetic patients are at higher risk of this syndrome [13].
The main aim if this study is to assess the correlation between frailty and diabetes in adult and older adults’ patients in Alahsa-Saudi Arabia. Seventy-eight patients enrolled in this study and divided into 3 groups. Group I included 31 healthy men between the ages of 65 and 75 years as a control group; group II included 25 patients with type 2 DM aged 50-64 years and group III included 22 patients with type 2 DM who were 65-80 years old. According to our data, the frailty score is higher among diabetic patients in groups 2 and 3 compared to those of non-diabetic patients in group 1. However, we could not identify a significant correlation in terms if diabetic patients could develop frailty at an earlier age than non-diabetic patients.
On the other hand, a significant positive correlation was found between poor diabetic control and the score of the frailty. The study by Park et al. screened 3075 older diabetic patients with muscle grip strength assessment and found muscle strength was lower in diabetic men compared to non- diabetic. [30]. Many other studies suggest the correlation between diabetes mellitus type 2 and the onset of frailty and also recommends the screening of frailty in diabetic patients above age of 55 [18, 31, 32]. Some articles examine the use of frail scale as timed and cost-effective methods to assess for frailty but not enough data for accuracy [33, 34]. In our article, we compared the frail scale to CHS score; however, the frail scale was reaching the sensitivity of 92.3% and specificity of 82.7%. The positive likelihood ratio is 5.3, while the negative likelihood ratio is 0.09. Our study supports screening diabetic patients for frailty; therefore, frailly screening could decrease frailty complications like falls and deaths. The frail scale could be used as a simple screening tool for frailty in Saudi patients.
Further studies with larger samples size needed to assess the prevalence of frailty in Saudi Arabia, assessing any possible correlation between diabetes and early onset of the frailty in addition to more diagnostic validation studies for the frail scale.
Conclusion
Frailty is a serious condition associated with very poor outcome; diabetes and frailty are related, especially among patients with poor glycemic control or medical comorbidities.
Frailty screening among diabetic patients is very important, and it could have a significant role in improving outcomes and avoiding life-threatening complications. Frail scale is a promising tool for screening but still lacks adequate diagnostic studies.
References
-
John E Morley, Bruno Vellas, G Abellan van Kan, Stefan D Anker, Juergen M Bauer, et al. (2014) Frailty Consensus: A Call to Action. J Am Med Dir Assoc 14(6): 392-397.
-
Fried LP, Tangen CM, Walston J, Newman AB, Hirsch C, et al. (2001) Frailty in Older Adults: Evidence for a Phenotype. The Journals of Gerontology Series A: Biological Sciences and Medical Sciences 56(3): M146-M157.
-
Yanase Toshihiko, Ikumi Yanagita, Kazuo Muta, Hajime Nawata (2018) Frailty in Elderly Diabetes Patients. Endocrine Journal 65(1): 1-11.
-
Vaupel James W (2018) Biodemography of Human Ageing. Bone 23(1): 1-7.
-
Andrew Clegg, John Young, Steve Iliffe, Marcel Olde Rikkert, Kenneth Rockwood (2014) Frailty in Older People. Lancet 381(9868): 752-762.
-
Gielen E, Verschueren S, O’Neill T W, Pye S R, O’Connell M D L, et al. (2012) Musculoskeletal Frailty: A Geriatric Syndrome at the Core of Fracture Occurrence in Older Age. Calcified Tissue International 91(3): 161-177.
-
Lang Pierre-Olivier, Jean Pierre Michel, Dina Zekry (2009) Frailty Syndrome: A Transitional State in a Dynamic Process. Gerontology 55(5): 539-549.
-
Cesari Matteo, Francesco Landi, Bruno Vellas, Roberto Bernabei, Emanuele Marzetti (2014) Sarcopenia and Physical Frailty: Two Sides of the Same Coin. Frontiers in Aging Neuroscience 6: 192.
-
Stephane Rochat, Robert G Cumming, Fiona Blyth, Helen Creasey, David Handelsman, et al. (2010) Frailty and Use of Health and Community Services by Community- Dwelling Older Men: The Concord Health And Ageing in Men Project. Age and Ageing 39(2): 228-233.
-
Song Xiaowei, Arnold Mitnitski, Kenneth Rockwood (2010) Prevalence and 10-Year Outcomes of Frailty in Older Adults in Relation to Deficit Accumulation. Journal of the American Geriatrics Society 58(4): 681-687.
-
Sánchez-García Sergio, Rosalinda Sánchez-Arenas, Carmen García-Peña, Oscar Rosas-Carrasco, José Alberto Ávila-Funes, et al. (2014) Frailty among Community- Dwelling Elderly Mexican People: Prevalence and Association with Sociodemographic Characteristics, Health State and the Use of Health Services. Geriatrics and Gerontology International 14(2): 395-402.
-
Xue Qian-Li (1998) The Frailty Syndrome: Definition and Natural History. 17th European Colloquium 27(1): 337- 342.
-
Heuberger Roschelle A (2011) The Frailty Syndrome: A Comprehensive Review. Journal of Nutrition in Gerontology and Geriatrics 30(4): 315-368.
-
Hoogendijk Emiel O, Hein PJ van Hout, Martijn W Heymans, Henriëtte E van der Horst, Dinnus H M Frijters, et al. (2014) Explaining the Association between Educational Level and Frailty in Older Adults: Results from a 13-Year Longitudinal Study in the Netherlands. Annals of Epidemiology 24(7): 538.e2-544.e2.
-
Castrejón-Pérez RC, Borges-Yáñez SA (2014) Frailty from an Oral Health Point of View. The Journal of Frailty & Aging 3(3): 180-186.
-
Rodríguez-Mañas, Leocadio Catherine Féart, Giovanni Mann, Jose Viña, Somnath Chatterji, et al. (2013) Searching for an Operational Definition of Frailty: A Delphi Method Based Consensus Statement: the Frailty Operative Definition-Consensus Conference Project. Journals of Gerontology - Series A Biological Sciences and Medical Sciences 68(1): 62-67.
-
Mitnitski AB, Mogilner AJ, Rockwood K (2001) Accumulation of Deficits as a Proxy Measure of Aging. The Scientific World Journal 1: 323-336.
-
Kai-Uwe Saum, Aida Karina Dieffenbach, Heiko Müller, Bernd Holleczek, Klaus Hauer, et al. (2014) Frailty Prevalence and 10-Year Survival in Community-Dwelling Older Adults: Results from the ESTHER Cohort Study. European Journal of Epidemiology 29(3): 171-179.
-
Francesco Cacciatore, Gianluca Testa, Gianluigi Galizia, David Della-Morte, Francesca Mazzella, et al. (2013) Clinical Frailty and Long-Term Mortality in Elderly Subjects with Diabetes. Acta Diabetologica 50(2): 251- 260.
-
Topinková Eva (2008) Aging, Disability and Frailty. Annals of Nutrition and Metabolism 52(S1): 6-11.
-
Collard Rose M, Han Boter, Robert A Schoevers, Richard C Oude Voshaar (2012) Prevalence of Frailty in Community-Dwelling Older Persons: A Systematic Review. Journal of the American Geriatrics Society 60(8): 1487-1492.
-
Perkisas Stany, Maurits Vandewoude (2014) Where Frailty Meets Diabetes. Diabetes/Metabolism Research and Reviews 32(30): 13-23.
-
Bouillon Kim, Mika Kivimaki, Mark Hamer, Severine Sabia, Eleonor I Fransson, et al. (2013) Measures of Frailty in Population-Based Studies: An Overview. BMC Geriatrics 13(1): 64.
-
Buta Brian J, Jeremy D Walston, Job G Godino, Minsun Park, Rita R Kalyani, et al. (2017) Frailty Assessment Instruments: Systematic Characterization of the Uses and Contexts of Highly-Cited Instruments. Proteomics 9(390): 53-61.
-
Aprahamian Ivan, Natália Oiring de Castro Cezar, Rafael Izbicki, Sumika Mori Lin, Débora Lee Vianna Paulo, et al. (2017) Screening for Frailty With the FRAIL Scale: A Comparison With the Phenotype Criteria. Journal of the American Medical Directors Association 18(7): 592-596.
-
Abellan van Kan G, Rolland YM, Morley JE, Vellas B (2008) Frailty: Toward a clinicaldefinition. J Am Med Dir Assoc 9(2): 71-72.
-
Abellan van Kan G, Rolland Y, Bergman H, Morley JE, Kritchevsky SB, et al. (2008) The I.A.N.A. Task Force onfrailty assessment of older people in clinical practice. J Nutr Health Aging 12(1): 29-37.
-
Rockwood K, Hogan DB, MacKnight C (2000) Conceptualization and measurement of frailty in elderly people. Drugs Aging 17(4): 295-302.
-
Batistoni SS, Neri AL, Cupertino AP (2007) Validity of the center for epidemiological studies depression scale among Brazilian elderly. Rev Saude Publica 41(4): 598- 605.
-
Park Seok Won, Bret H Goodpaster, Elsa S Strotmeyer, Nathalie De Rekeneire, Tamara B Harris, et al. (2006) Decreased Muscle Strength and Quality in Older Adults with Type 2 Diabetes: The Health, Aging, and Body Composition Study. Diabetes 55(6): 1813-1818.
-
Seo Yeong Mi, Jong Ryeal Hahm, Tae Kyung Kim, Won Hee Choi (2015) Factors Affecting Fatigue in Patients with Type II Diabetes Mellitus in Korea. Asian Nursing Research 9(1): 60-64.
-
Jung Hee Won, Sun Wook Kim, Soyeon Ahn, Jae Young Lim, Ji Won Han, et al. (2014) Prevalence and Outcomes of Frailty in Korean Elderly Population: Comparisons of a Multidimensional Frailty Index with Two Phenotype Models. PLoS ONE 9(2): e87958.
-
Woo Jean, Jason Leung, John E Morley (2012) Comparison of Frailty Indicators Based on Clinical Phenotype and the Multiple Deficit Approach in Predicting Mortality and Physical Limitation. Journal of the American Geriatrics Society 60(8): 1478-1486.
-
Jung Hee Won, Il Young Jang, Young Soo Lee, Chang Ki Lee, Eun Il Cho, et al. (2016) Prevalence of Frailty and Aging-Related Health Conditions in Older Koreans in Rural Communities: A Cross-Sectional Analysis of the Aging Study of Pyeongchang Rural Area. Journal of Korean Medical Science 31(4): 345-352.
- Investigation of Polymorphisms in PPAR-Ɣ and TRHR Genes and their Impact on Turkish Diabetic and Obese Individuals
- The Impact of Aircraft Noise Exposure on the Efficacy of Empagliflozin Therapy in an Animal Model of Obesity
- Rooibos Mitigates Metabolic and Inflammatory Dysfunctions in Mice Fed a High-Carbohydrate Diet
- Synergistic Effect of Combined Leaf Extract of Vernonia amygdalina, Ocimum gratissimum, and Zingiber officinale Tuber on Phytochemical Profile, Antioxidant Activity, Serum Insulin, and Biochemical Parameters in Streptozotocin-Induced Diabetic Rats
- Investigation of Cardiovascular Responses to Aerobic Exercise in Obese University Students
- A Look at the Phase Angle Obtained by Electrical Bioimpedance