Investigation of Impact of Biofield Energy Healing Treatment on Physicochemical, Thermal and Spectral Properties of Magnesium Gluconate
Magnesium plays important role in the functioning of cells, nerves, muscles, and bones of human body. It is incorporated in the form of magnesium gluconate in various pharmaceutical and nutraceutical supplements due to its wide applications. This study was done with the objective to analyse the effect of The Trivedi Effect®- Energy of Consciousness Healing Treatment on the physical, thermal, and spectral properties of magnesium gluconate. In this regard, the sample of magnesium gluconate was divided in two parts, in which first part was kept untreated and termed as control sample. Besides, the second part was remotely treated by the renowned Biofield Energy Healer, Mr. Mahendra Kumar Trivedi with The Trivedi Effect®- Biofield Energy Healing Treatment and termed as Biofield Energy Treated sample. Consequently, both the samples were analyzed using PXRD, PSA, DSC, TGA/DTG, UV-Vis, and FT-IR analytical techniques. The PXRD analysis revealed that the crystallite sizes and relative peak intensities of the treated sample showed variations in the range of-25.01% to 185.79% and 6.99% to 32.99%, respectively along with 13.03% increase in average crystallite size as compared to the control sample. The particle sizes d10, d50, d90, and D(4,3) values of the treated sample were significantly decreased by 3.70%, 21.88%, 22.03%, and 21.16%, respectively, along with 10.75% increase in the surface area as compared to the control sample. The DSC studies showed minor decrease in melting point (0.10%) with 3.74% increase in the latent heat of fusion of the treated sample, compared to the control sample. Besides, The TGA/DTG analysis represented alterations in the weight loss pattern and maximum thermal degradation temperature (Tmax) of the treated sample. The analysis revealed three steps thermal degradation, in which the variation was observed from -6.79% to 10.14% in terms of weight loss along with 0.24% increase in the total weight loss of the treated sample, compared to the control sample. The Tmax of the first two peaks were found to be increased by 6.90% and 1.28%, while 3rd and 4th peaks were slightly decreased by 0.57% and 0.24% in the treated sample, compared to the control sample. The Energy of Consciousness Healing Treatment might produce a new polymorphic form of magnesium gluconate, which may have a better solubility, absorption and bioavailability profile along with altered thermal stability compared to the untreated sample. Thus, the Biofield Energy Treated magnesium gluconate would be helpful in designing the better nutraceutical/pharmaceutical formulations with better therapeutic responses against the magnesium deficiency.
Introduction
Magnesium is the fourth most abundant mineral in the human body and it is required by the body for more than 300 metabolic processes. It plays the crucial role in the normal functioning of nerves, cells, muscles, bones, and heart, etc [1]. Usually, the normal requirement of magnesium in the body could be fulfilled by a well-balanced diet. However, there are certain clinical situations in which the body started losing more magnesium as compared to its replenishment with the diet. Such conditions include a poor diet, medical conditions such as, problem with stomach/intestinal absorption, severe diarrhea/vomiting, and diabetes; alcoholism, and use of drugs such as, furosemide and hydrochlorothiazide, etc [2]. According to the research studies in U.S., many adults are not able to get the required amount of magnesium from their food. Thus, they are required to fulfill their need with the help of supplements [3]. The magnesium supplements also become very important if the person has the deficiency symptoms such as fatigue, muscle weakness, loss of appetite and nausea, etc [4]. Magnesium gluconate is used as a supplement for maintaining the required amount of magnesium in the body, and it shows the maximum bioavailability among the all available magnesium supplements [5]. It is also used to treat indigestion and heartburn as an antacid, where it reacts with stomach acid for increasing the gastric pH. Also, it is used as laxative and electrolyte replacement [6]. Magnesium also plays an important role in the body as a cofactor for various enzymatic pathways of phosphate transfer reactions, such as oxidative phosphorylation, oxygen radical reduction; where ATP and other nucleotides are used as substrates [7]. Apart from that, the magnesium gluconate supplements may also be used in regulating the blood pressure, thereby preventing the hypertension and cardiovascular disorders [8]. The role of magnesium supplements is also investigated by National Center for Complementary and Alternative Medicine in the treatment of mild to moderate persistent asthma [9].
The Trivedi Effect®-Energy of Consciousness Healing Treatment has been known for its impact on the various properties of drugs that would be helpful in enhancing the solubility and bioavailability of pharmaceutical/ nutraceutical compounds [10, 11, 12]. Biofield Energy is a kind of unique energy i.e., para-dimensional electromagnetic field around the human body. There are several Biofield (Putative Energy Fields) based Energy Healing Therapies that are known for their significant impacts against various disease conditions [13]. Biofield Energy Healers possess the ability of harnessing the energy from the “Universal Energy Field” and thereby, they can transmit it into any living or non-living object(s). This process through which the objects receive the Biofield Energy Treatment and respond into useful way is called as Biofield Energy Healing Treatment. Such energy therapies are recommended by the National Institute of Health/National Center for Complementary and Alternative Medicine (NIH/NCCAM) and they included them under the Complementary and Alternative Medicine (CAM) due to their several advantages [14]. The impact of Biofield Energy Healing Treatment (The Trivedi Effect®) is evident in various fields such as, pharmaceuticals [15, 16], material science [17, 18], nutraceuticals [19, 20], microbiology [21, 22], organic compounds [23, 24], agricultural [25, 26], and biotechnology [27, 28]. The solid state properties such as the physicochemical and thermal properties play crucial role in the formulation as well as performance of the drug product [29, 30]. Thus, this study was designed to investigate the impact of Biofield Energy Treatment (The Trivedi Effect®) on the physicochemical, thermal and spectroscopic properties of magnesium gluconate with the help of various analytical techniques such as, powder X-ray diffraction (PXRD), particle size analysis (PSA), differential scanning calorimetry (DSC), thermogravimetric analysis (TGA)/ Differential thermogravimetric analysis (DTG), UV-visible and FT-IR spectroscopy.
Materials and Methods
Chemicals and Reagents
Magnesium gluconate was procured from Tokyo Chemical Industry Co., Ltd., Japan. All other chemicals used in the experiment were of analytical grade available in India.
Consciousness Energy Healing Treatment Strategies
Magnesium gluconate i.e., the test compound was divided into two parts. Among both parts, one portion was denoted as control sample that did not receive the Biofield Energy Treatment. Besides, the other part of magnesium gluconate was considered as treated part that received the Energy of Consciousness Healing Treatment by the renowned Biofield Energy Healer, Mr. Mahendra Kumar Trivedi (USA), and named as the Biofield Energy Treated sample. In the process of Biofield Energy Treatment, the sample was kept under the standard laboratory conditions and the Biofield Energy Healer provided the Trivedi Effect® - Energy of Consciousness Healing Treatment to the sample, remotely, for 3 minutes through the Unique Energy Transmission process. On the other hand, the control magnesium gluconate was subjected to “sham” healer under the similar laboratory conditions, who did not have any knowledge about the Biofield Energy Healing Treatment. Consequently, the control as well as Biofield Energy Treated magnesium gluconate samples were kept in similar sealed conditions and further characterized by using PXRD, PSA, DSC, TGA/DTG, UV-Vis, and FT-IR techniques.
Characterization
Powder X-ray Diffraction (PXRD) Analysis: The PXRD analysis of the control and Biofield Energy Treated samples of magnesium gluconate was done with the help of PANalytical X'Pert3 powder X-ray diffractometer, UK. In this, the copper line was used as the radiation source for diffracting the analyte at 0.154 nm X-ray wavelengths, which is running at 40 mA current and 45 kV voltages. Also, the scanning rate for instrument was kept at 18.87°/second over a 20 range of 3-90° and the ratio of Kα-2 and Kα-1 was 0.5 (k, equipment constant). The data produced by the instrument was collected with the help of X'Pert data collector and X'Pert high score plus processing software. It provides the data in the form of a chart of the Bragg angle (20) vs. intensity (counts per second), and a table providing information regarding the peak intensity counts, d value (Å), full width half maximum (FWHM) (°20), relative intensity (%), and area (cts*°20). From this data, the crystallite size (G) was analyzed with the help of the Scherrer equation (1) [10, 11, 12] as follows:
$$G = k\lambda/(bCos\theta)$$ (1)
Where, k is the equipment constant (0.5), $\lambda$ is the X-ray wavelength (0.154 nm); b in radians is the full-width at half of the peaks and $\theta$ is the corresponding Bragg angle.
Later on, the percent change in crystallite size (G) of magnesium gluconate was calculated using following equation 2:
$$\% \text{change in crystallite size} = \frac{[G_{\text{Treated}} - G_{\text{control}}]}{G_{\text{control}}} \times 100$$ (2)
Where, $G_{\text{Control}}$ and $G_{\text{Treated}}$ are the crystallite size of the control and Biofield Energy Treated magnesium gluconate samples, respectively.
Particle Size Analysis (PSA): The particle size analysis was done using wet method, which involves the use of instrument, Malvern Mastersizer 3000, UK. The instrument has a detection range between 0.01 µm to 3000 µm [31], and the method involves the filling of sample unit (Hydro MV) with light liquid paraffin oil, which acts as dispersant medium. The refractive index values for dispersant medium and samples were 0.0 and 1.47, respectively. Later on, it was stirred at 2500 rpm, and the measurement was taken twice after reaching obscuration in between 10% and 20%, followed by averaging both measurements. The PS analysis provides data in the form of $d_{10}$ µm, $d_{50}$ µm, and $d_{90}$ µm, representing the particle diameter corresponding to 10% 50% and 90% of the cumulative distribution. D(4, 3) µm represents the average mass-volume diameter and SSA is the specific surface area (m²/Kg). The calculations were done by using software Mastersizer V3.50.
The percent change in particle size (d) for $d_{10}$, $d_{50}$, $d_{90}$ and D(4,3) was calculated using following equation 3:
$$\% \text{change in particle size} = \frac{[d_{\text{Treated}} - d_{\text{control}}]}{d_{\text{control}}} \times 100$$ (3)
Where, $d_{\text{control}}$ and $d_{\text{Treated}}$ are the particle size (µm) for at below 10% level ($d_{10}$) 50% level ($d_{50}$) and 90% level ($d_{90}$) of the control and Biofield Energy Treated samples, respectively.
Percent change in specific surface area (SSA) was calculated using following equation 4:
$$\% \text{change in specific surface area} = \frac{[d_{\text{Treated}} - d_{\text{control}}]}{d_{\text{control}}} \times 100$$ (4)
Where, $S_{\text{control}}$ and $S_{\text{Treated}}$ are the surface area of the control and Biofield Energy Treated magnesium gluconate, respectively.
Differential Scanning Calorimetry (Dsc): The DSC analysis of the samples was done under the dynamic nitrogen atmosphere with the help of DSC Q2000 differential scanning calorimeter, USA, at the flow rate of 50 mL/min. In this process, 2-4 mg sample was weighed and sealed in Aluminum pans. Later on, the sample was equilibrated at 30°C followed by heating up to 450°C at the rate of 10°C/min under nitrogen gas as purge atmosphere [32]. The thermogram reveals the value for onset, end set, peak temperature, peak height (mJ or mW), peak area, and change in heat (J/g) for each peak. Later on, the percent change in melting temperature (T) of the control and Biofield Energy Treated samples was calculated using following equation 5:
$$\% \text{change in melting temperature} = \frac{[T_{\text{Treated}} - T_{\text{control}}]}{T_{\text{control}}} \times 100$$ (5)
Where, $T_{\text{Tcontrol}}$ and $T_{\text{Treated}}$ are the melting temperature of the control and Biofield Energy Treated magnesium gluconate samples, respectively.
Also, the percent change in the latent heat of fusion (ΔH) was calculated using following equation 6:
$$\% \text{change in latent heat of fusion} = \frac{[\Delta H_{\text{Treated}} - \Delta H_{\text{control}}]}{\Delta H_{\text{control}}} \times 100$$ (6)
Where, $\Delta H_{\text{control}}$ and $\Delta H_{\text{Treated}}$ are the latent heat of fusion of the control and Biofield Energy Treated magnesium gluconate, respectively.
Thermal Gravimetric Analysis (TGA) / Differential Thermogravimetric Analysis (DTG): TGA/DTG analysis was done using TGA Q500 themoanalyzer apparatus, USA under dynamic nitrogen atmosphere (50 mL/min). It involves heating the samples from 25°C to 800°C at the rate of 10ºC/min using platinum crucible [32]. In TGA analysis, the weight loss in gram as well as percent loss for each step was recorded from the thermogram with respect to the initial weight of the sample. Consequently, the DTG analysis revealed the thermogram from which, the onset, endset, peak temperature and integral area for each peak was recorded. The percent change in weight loss (W) was calculated using following equation 7:
[W - W ] %changein Weight loss = ×100 W
Treated control
(7) control Where, WControl and WTreated are the weight loss of the control and Biofield Energy Treated samples, respectively.
Also, the percent change in maximum thermal degradation temperature (Tmax) (M) was calculated using following equation 8:
[M - M ] %changein T (M)= ×100 M
Treated control max control
(8) Where, MControl and MTreated are the Tmax values of the control and Biofield Energy Treated magnesium gluconate samples, respectively.
Ultraviolet-visible Spectroscopy (UV-Vis) Analysis: The UV-Vis spectral analysis of the control and Biofield Energy Treated magnesium gluconate samples was done with the help of Shimadzu UV-2400PC SERIES with UV Probe (Shimadzu, JAPAN). The spectrum was recorded in the wavelength range of 190-800 nm using 1 cm quartz cell having a slit width of 0.5 nm. The absorbance spectra (in the range of 0.2 to 0.9) and wavelength of maximum absorbance (λmax) were recorded.
Fourier Transform Infrared (FT-IR) Spectroscopy FT-IR spectroscopy of magnesium gluconate was done by using Spectrum ES Fourier transform infrared spectrometer (Perkin Elmer, USA) with the frequency array of 400-4000 cm-1. The process involves pressed KBr disk technique in which, ~2 mg of sample was taken along with about 300 mg of KBr as the diluent, followed by forming the pressed disk and running the sample in the spectrometer.
Results and Discussion
Powder X-ray Diffraction (PXRD) Analysis
The PXRD diffractograms of control and Biofield Energy Treated samples of magnesium gluconate are presented in Figure 1. The diffractograms showed sharp peaks that represents the crystalline nature of both samples. The PXRD data is presented in Table 1, which involves the details regarding Bragg angle (2θ), relative peak intensity (%), and crystallite size (G) for the control and Biofield Energy Treated magnesium gluconate samples. The crystallite size was calculated using Scherer equation [10, 11, 12].
| Entry No. | Bragg angle (°2θ) | Relative Peak Intensity (%) | Crystallite size (G, nm) | ||||
|---|---|---|---|---|---|---|---|
| Control | Treated | % changea | Control | Treated | % changeb | ||
| 1 | 5 | 100 | 100 | 0 | 38.28 | 38.28 | 0 |
| 2 | 9.9 | 29.16 | 32.26 | 10.63 | 34.54 | 38.38 | 11.12 |
| 3 | 10.7 | 5.41 | 5.9 | 9.06 | 28.8 | 43.21 | 50.03 |
| 4 | 12.1 | 2.86 | 3.06 | 6.99 | 23.06 | 26.62 | 15.44 |
| 5 | 13.9 | 33.34 | 37.42 | 12.24 | 31.51 | 34.67 | 10.03 |
| 6 | 15.3 | 5.25 | 6.39 | 21.71 | 43.41 | 43.41 | 0 |
| 7 | 15.8 | 19.59 | 22.54 | 15.06 | 31.58 | 34.74 | 10.01 |
| 8 | 16.4 | 12.09 | 14.19 | 17.37 | 26.74 | 31.61 | 18.21 |
| 9 | 18 | 31.31 | 33.54 | 7.12 | 20.49 | 17.42 | -14.98 |
| 10 | 18.5 | 56.81 | 69.29 | 21.97 | 31.7 | 34.87 | 10 |
| 11 | 19.1 | 34 | 39.99 | 17.62 | 17.45 | 49.87 | 185.79 |
| 12 | 20.1 | 12.37 | 15.2 | 22.88 | 31.77 | 31.77 | 0 |
| 13 | 20.9 | 18.23 | 22.71 | 24.57 | 26.91 | 31.81 | 18.21 |
| 14 | 22.4 | 28.04 | 33.07 | 17.94 | 31.89 | 31.89 | 0 |
| 15 | 23.6 | 27.76 | 33.44 | 20.46 | 39.07 | 29.3 | -25.01 |
| 16 | 24.7 | 11.45 | 13.1 | 14.41 | 27.1 | 25.16 | -7.16 |
| 17 | 27.4 | 18.43 | 22.61 | 22.68 | 20.83 | 23.61 | 13.35 |
| 18 | 29.3 | 15.94 | 19.1 | 19.82 | 32.34 | 44.48 | 37.54 |
| 19 | 31.4 | 9.89 | 12.07 | 22.04 | 32.5 | 35.75 | 10 |
| 20 | 34.5 | 7.7 | 10.24 | 32.99 | 22.52 | 20.02 | -11.1 |
| 21 | 35.7 | 11.2 | 12.93 | 15.45 | 24.1 | 25.82 | 7.14 |
| 22 | 37.6 | 7.04 | 8.14 | 15.63 | 33.05 | 30.3 | -8.32 |
| 23 | 39.6 | 9.94 | 11.53 | 16 | 33.26 | 45.74 | 37.52 |
| 24 | 40.4 | 11.6 | 13.34 | 15 | 28.21 | 30.56 | 8.33 |
| 25 | 44.1 | 7.25 | 8.4 | 15.86 | 37.14 | 46.44 | 25.04 |
Table 1: PXRD data for the control and Biofield Energy Treated magnesium gluconate. adenotes the percentage change in the relativ
![Figure 1: The diffractograms showed sharp peaks that represents the crystalline nature of both samples. The PXRD data is presented in Table 1, which involves the details regarding Bragg angle (2θ), relative peak intensity (%), and crystallite size (G) for the control and Biofield Energy Treated magnesium gluconate samples. The crystallite size was calculated using Scherer equation [10-12].](/fulltextimages/6741/fig_1.png)
The analysis revealed that the crystallite sizes of the Biofield Energy Treated sample at 2θ equal to nearly 5.0°, 15.3°, 20.1°, and 22.4° (Table 2, entry 1, 6, 12, and 14) didn’t show any change as compared to the control sample. However, the crystallite sizes of the Biofield Energy Treated magnesium gluconate at 2θ equal to nearly 18.0°, 23.6°, 24.7°, 34.5°, and 37.6° (Table 2, entry 9, 15, 16, 20 and 22) were significantly decreased in the range from 7.16% to 25.01% with respect to the control sample. Consequently, the crystallite sizes at the other 2θ positions (Table 2, entry 2-5, 7, 8, 10, 11, 13, 17-19, 21, and 23-25) of the Biofield Energy Treated sample were significantly increased in the range from 7.14% to 185.79% as compared to the control sample. Also, the average crystallite size was significantly increased by 13.03% in the Biofield Energy Treated sample in comparison to the control sample. The possible reason behind this alteration may be that the Biofield Energy might induce the movement of crystallite boundaries that is responsible for the crystal growth and ultimately, the increased crystallite size [33]. Besides, the PXRD diffractogram of both samples showed highest peak intensity (100%) at Bragg’s angle (2θ) equal to 5.0° (Table 2, entry 1), but, the other peaks of Biofield Energy Treated sample’s diffractogram showed significant alteration in relative intensities as compared to control sample. The relative intensity of the peaks of Biofield Energy Treated sample was found to be increased in the range of 6.99% to 32.99% in comparison to the control sample, which indicated that the crystallinity of the Biofield Energy Treated sample was increased after treatment.
According to the literature, the alterations in the crystallite sizes and relative intensities indicated the changes in the morphology of the crystal and could be considered as the proof of polymorphic transition [34, 35, 36]. Since, the crystallite size of the Biofield Energy Treated sample was significantly altered as compared with the control sample; it may indicate the appearance of a new polymorphic form of magnesium gluconate after the Biofield Energy Treatment. The polymorphic form of a compound along with the crystal pattern, morphology and crystallite size plays the important role in its solubility, dissolution, and bioavailability [37]. Thus, the Biofield Energy Treatment could be considered as a very useful method for altering the crystal morphology of magnesium gluconate.
Particle Size Analysis (PSA)
The particle size and surface area of the control and Biofield Energy Treated magnesium gluconate was calculated and presented in Table 2. The particle size distribution of the control sample was observed at d10 (10.8 µm), d50 (58.5 µm), d90 (227 µm), and D(4,3) (91.7 µm). Consequently, the particle size distribution of the Biofield Energy Treated sample at d10, d50, d90, and D(4,3) was found as 10.4 µm, 45.7 µm, 177 µm, and 72.3 µm, respectively. The analysis revealed that the particle size values at d10, d50, d90, and D(4,3) in Biofield Energy Treated magnesium gluconate was significantly decreased by 3.70%, 21.88%, 22.03%, and 21.16%, respectively as compared with the control sample. However, the specific surface area (SSA) of Biofield Energy Treated magnesium gluconate (218.5m2/Kg) was significantly increased by 10.75% with respect to the control sample (197.3m2/Kg).
| Test Item | d (µm) 10 | d (µm) 50 | d (µm) 90 | D(4,3) (µm) | SSA(m2/Kg) |
|---|---|---|---|---|---|
| Control sample | 10.8 | 58.5 | 227 | 91.7 | 197.3 |
| Biofield Energy Treated sample | 10.4 | 45.7 | 177 | 72.3 | 218.5 |
| Percent change* (%) | -3.7 | -21.88 | -22.03 | -21.16 | 10.75 |
Table 2: Particle size distribution of the control and Biofield Energy Treated magnesium gluconate. d10, d50, and d90: particle d
Table 2: Particle size distribution of the control and Biofield Energy Treated magnesium gluconate. d10, d50, and d90: particle diameter corresponding to 10%, 50%, and 90% of the cumulative distribution, D(4,3) : the average mass-volume diameter, SSA : the specific surface area; *denotes the percentage change in the particle size distribution of the Biofield Energy Treated sample with respect to the control sample.
The surface area plays an important role in the process of dissolution, as it influences the surface energy, which is the driving factor for dissolution efficiency. Moreover, it has been reported that decrease in particle size might increase the surface area [38], thus the Biofield Energy Treatment might be responsible for such alteration in the surface area that ultimately affects the dissolution profile of compound.
Differential Scanning Calorimetry (DSC) Analysis
The DSC thermograms of the control and Biofield Energy Treated magnesium gluconate exhibited two endothermic peaks (Figure 2). Since, the magnesium gluconate is generally present in the hydrate form, thus, the first peak (minor) of thermogram may be due to the evaporation of the water from the sample, whereas, the second sharp endothermic peak (major) was due to the melting point of the magnesium gluconate (Figure 2). The analysis revealed that there was a significant alteration in the vaporization temperature and latent heat of vaporization of the Biofield Energy Treated sample, as the values were decreased by 5.86% and 1.97%, respectively (Table 3), as compared to the control sample. Although, the melting point of the Biofield Energy Treated magnesium gluconate (169.80°C) was found almost similar as that of the control sample (169.97°C), but the latent heat of fusion (ΔHfusion) in the Biofield Energy Treated magnesium gluconate was slightly increased by 3.74% compared to the control sample (Table 3).
| Description | Melting Point (°C) | ΔHfusion(J/g) | |
|---|---|---|---|
| Peak 1 (Minor) | Control sample | 84.99 | 28.4 |
| Peak 1 (Minor) | Biofield Treated sample | 80.01 | 27.84 |
| Peak 1 (Minor) | % Change* | -5.86 | -1.97 |
| Peak 2 (Major) | Control sample | 169.97 | 320.5 |
| Peak 2 (Major) | Biofield Treated sample | 169.8 | 332.5 |
| Peak 2 (Major) | % Change* | -0.1 | 3.74 |
Table 3: The latent heat of fusion (J/G) and melting point (°C) values of the control and Biofield Energy Treated magnesium gluco
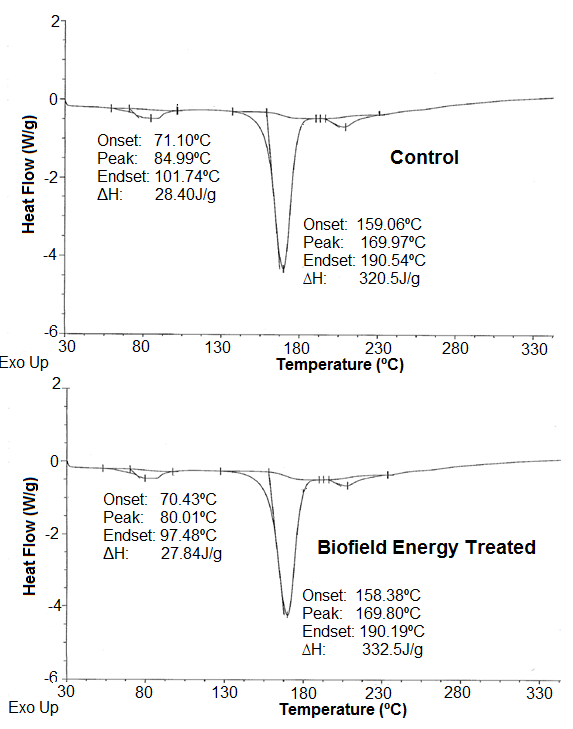
The analysis indicated that the energy required by the Biofield Energy Treated magnesium gluconate in the form of ∆H differs from the control sample to undergo the process of melting. Hence, it is presumed that the Biofield Energy Treatment might induce some alterations in the intermolecular forces, which may be responsible for the change in ∆H. Moreover, it is also hypothesized that the Biofield Energy Treatment may cause emission of less energy in the process of phase transition from solid to liquid state, which may lead to increase in ∆H in the Biofield Energy Treated sample as compared to the control sample.
Thermal Gravimetric Analysis (TGA)/ Differential Thermogravimetric Analysis (DTG)
The TGA/DTG analysis was done for determining the thermal stability of the samples, with the help of thermograms of the control and Biofield Energy Treated magnesium gluconate (Figures 3 & 4).
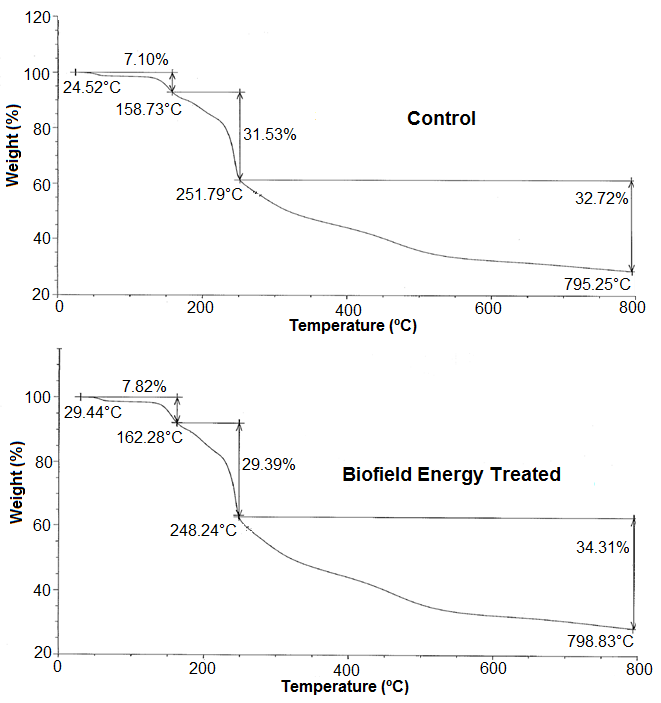
| Step | Temperature (oC) | Weight loss % | % Change* | ||
|---|---|---|---|---|---|
| Control | Treated | Control | Treated | ||
| 1st step of degradation | 158.73 | 162.28 | 7.1 | 7.82 | 10.14 |
| 2nd step of degradation | 251.79 | 248.24 | 31.53 | 29.39 | -6.79 |
| 3rd step of degradation | 795.25 | 793.83 | 32.72 | 34.31 | 4.86 |
| Total weight loss | - | - | 71.35 | 71.52 | 0.24 |
Table 4: Thermal degradation steps of the control and Biofield Energy Treated magnesium gluconate. *denotes the percentage change
Apart from that, the TGA and DTG data for both, the control and Biofield Energy Treated samples are given in the Tables 4 & 5. The thermograms of both the samples showed three-step thermal degradation, in which, the weight losses of the Biofield Energy Treated sample at the 1st and 3rd steps were found to be increased by 10.14% and 4.86%, respectively, compared to the control sample. On the other hand, the Biofield Energy Treated magnesium gluconate showed decreased weight loss by 6.79% at the 2nd step of thermal degradation as compared to the control sample. The total weight loss of the Biofield Energy Treated sample showed a slight increase of 0.24% compared with the control sample (Table 4).
The DTG thermograms of the control and Biofield Energy Treated samples (Figure 4) exhibited four peaks. The analysis revealed that the maximum thermal degradation temperature (Tmax) of 1st and 2nd peaks of the Biofield Energy Treated sample were increased by 6.90% and 1.28%, as compared to the control sample (Table 5). Besides, the Tmax of 3rd and 4th peaks of the Biofield Energy Treated sample were slightly decreased by 0.57% and 0.24% compare to the control sample (Table 5). Overall, the TGA/DTG analysis revealed that the thermal stability of the Biofield Energy Treated magnesium gluconate was altered as compared to the control sample, which might be due to the alteration in particle size of the treated sample after the Biofield Energy Treatment.
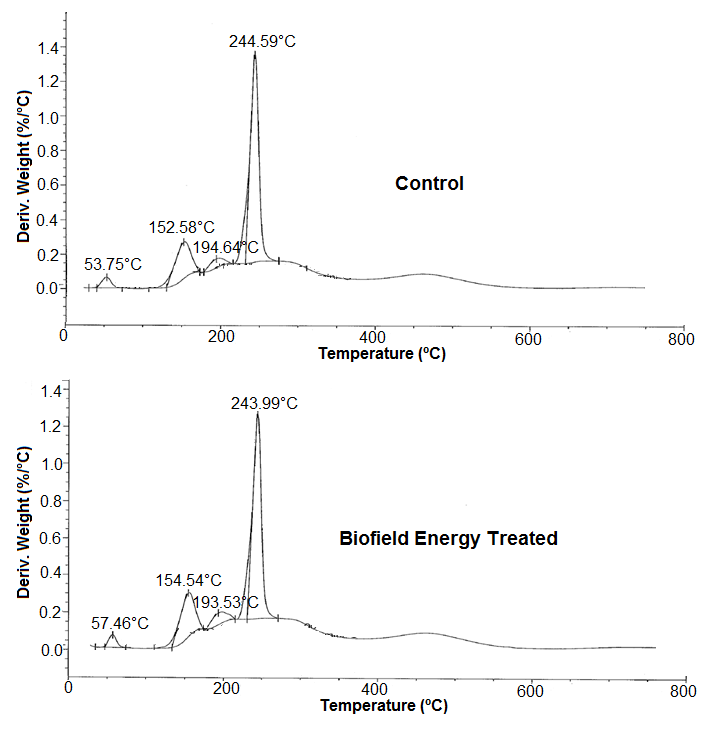
| Description | T (°C) max | |||
|---|---|---|---|---|
| 1st step | 2nd step | 3rd step | 4th step | |
| Control Sample | 53.75 | 152.58 | 194.64 | 244.59 |
| Biofield Energy Treated Sample | 57.46 | 154.54 | 193.53 | 243.99 |
| % Change* | 6.9 | 1.28 | -0.57 | -0.24 |
Table 5: The DTG thermal degradation steps of the control and Biofield Energy Treated magnesium gluconate. *denotes the percentag
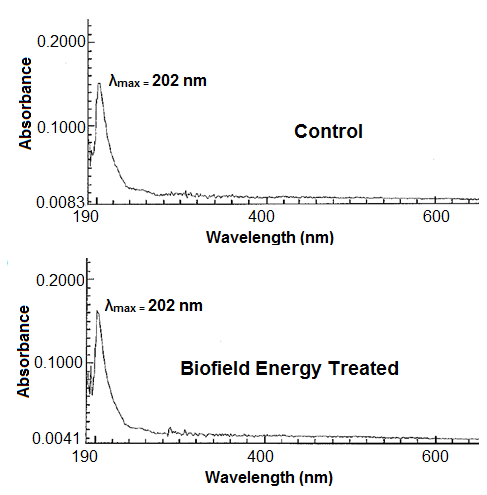
Ultraviolet-visible Spectroscopy (UV-Vis) Analysis
The UV-visible spectra of both, the control and Biofield Energy Treated magnesium gluconate samples are presented in Figure 5.
The spectra of both, the control and Biofield Energy Treated samples showed the maximum absorbance (λmax) at 202 nm, thus, no significant alteration was found in the absorbance maxima between the control and Biofield Energy Treated sample.
It reveals that there might not be any significant change in the electronic transitions between highest occupied molecular orbital and lowest unoccupied molecular orbital induced by the Biofield Energy Treatment.
Fourier Transform Infrared (FT-IR) Spectroscopy
The FT-IR spectra of both the control and Biofield Energy Treated magnesium gluconate are shown in Figure 6 and it showed the clear stretching and bending peaks in both the functional group as well as the fingerprint region. The spectra of both the samples showed broad peaks in the functional group area near 3398 cm-1, which may be due to the O-H stretching present in the primary and secondary alcohol and two water molecules.
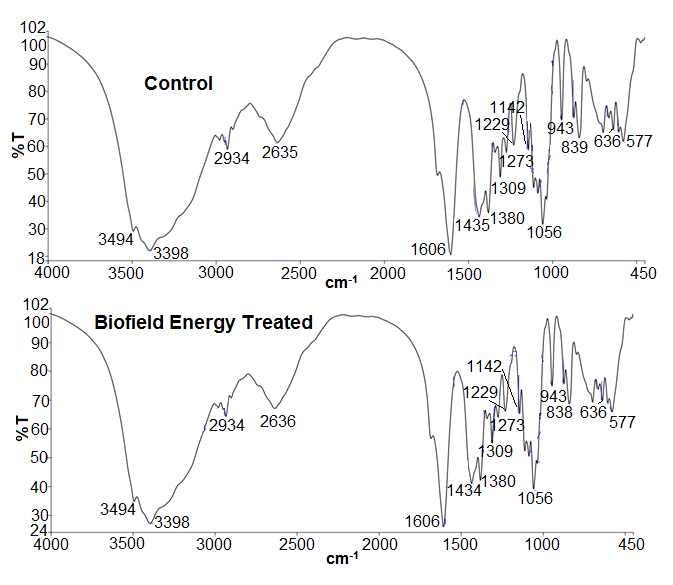
The peak may arise due to the stretching vibrations of hydroxyl groups originating from the water present in magnesium gluconate in its hydrate form. Moreover, the functional region also involves the stretching vibrations due to the primary and secondary hydroxyl groups of the gluconate part, which may not be visible due to the intensive broad band of water [36]. Moreover, the peaks for the deformation vibration of the hydroxyl groups in the plane δ (OH) and out-of-plane γ (OH) regarding the primary and secondary hydroxyl groups were observed at 1435 cm-1 and 636 cm-1 and 577 cm-1, respectively in the spectrum of the control sample, whereas, at 1434 cm-1 and 636 cm-1 and 577 cm-1, respectively in the spectrum of Biofield Energy Treated magnesium gluconate hydrate. The spectra of both the samples showed C-H stretching at 2934 cm-1. Similarly, the intensive peaks at 1606 and 1380 cm-1 in the spectra of both the samples were may be due to the asymmetric and symmetric vibrations of C=O of a carbonyl group of carboxylate anion. Later on, the fingerprint region of the control sample and Biofield Energy Treated sample was observed to be same. The peak regarding C-O stretching vibrations of the primary alcohol group was perceived at 1056 cm-1 in the spectra of both the control and Biofield Energy Treated sample. Similarly, the absorption peaks due to the C-O stretching vibrations of the secondary alcohol groups were observed at 1229 cm-1 and 1142 cm-1 in the spectra of both the samples. The overall FT-IR analysis indicated that there was no significant alteration in the frequency of the characteristic peaks in the Biofield Energy Treated sample compared to the control samples. Hence, it can be concluded that the structure of the magnesium gluconate hydrate remained the same in both the Biofield Energy Treated and control samples.
Conclusions
Overall, the study revealed the impact of Trivedi Effect® - Energy of Consciousness Healing Treatment on the physicochemical and thermal properties of magnesium gluconate. The PXRD data showed sharp and intense peaks in the diffractograms of both the samples, which revealed that the magnesium gluconate samples were crystalline in nature. The crystallite sizes of the Biofield Energy Treated sample showed significant alterations in the range of -25.01% to 185.79% with 13.03% increase in the average crystallite size as compared to the control sample. The relative peak intensities of the characteristic peaks were also significantly increased from 6.99% to 32.99% in the treated sample. The changes in relative intensities of peaks as well as crystallite size of the treated sample indicated some alterations in the crystallinity, morphology and polymorphic form of magnesium gluconate hydrate. On the other hand, the particle size values at d10, d50, d90, and D (4,3) in the Biofield Energy Treated magnesium gluconate sample was significantly decreased by 3.70%, 21.88%, 22.03%, and 21.16%, respectively as compared with the control sample. The impact of Biofield Energy Treatment was also revealed in the surface area of the treated sample that was significantly increased by 10.75% in comparison to the control sample. The decreased particle size and increased surface area of the Biofield Energy Treated magnesium gluconate may help in increasing the solubility, dissolution and bioavailability profile. The melting point of the Biofield Energy Treated sample was slightly lowered (0.10%), whereas, the latent heat of fusion was increased by 3.74% compared to the control sample. The TGA analysis of both the control and treated samples exhibited three steps thermal degradation. Among these steps, the weight loss of the Biofield Energy Treated sample was observed to differ in the range of -6.79% to 10.14%, along with 0.24% increase in the total weight loss as compared to the control sample. The DTG analysis showed that the maximum thermal degradation temperatures (Tmax) of the first two peaks were increased by 6.90% and 1.28%, while 3rd and 4th peaks were slightly decreased by 0.57% and 0.24%, respectively in the Biofield Energy Treated sample, compared to the control sample.
The overall thermal analysis revealed that the thermal stability of the treated magnesium gluconate sample was altered, when compared with the control sample. Thus, the study concluded that the Energy of Consciousness Healing Treatment might alter the crystallinity and polymorphic form of magnesium gluconate, which could provide a better solubility, dissolution, absorption, and bioavailability profile with altered thermal stability. Hence, the Energy of Consciousness Healing Treatment would be very useful in the designing of better formulation for the treatment of various disorders, such as, septic shock, arrhythmias, cancer, allergies, inflammatory diseases, diabetes mellitus, asthma, immunological disorders, gestational hypertension, etc.
Acknowledgements
The authors are grateful to GVK Biosciences Pvt. Ltd., Trivedi Science, Trivedi Global, Inc., and Trivedi Master Wellness for their assistance and support during this work.
References
-
Guerrera MP, Volpe SL, Mao JJ (2009) Therapeutic Uses of Magnesium. Am Fam Physician 80: 157-162.
-
LaValle JB (2006) Hidden disruptions in metabolic syndrome: drug-induced nutrient depletion as a pathway to accelerated pathophysiology of metabolic syndrome. Altern Ther Health Med 12: 26-31.
-
Alaimo K, McDowell MA, Briefel RR, Bischof AM, Caughman CR, et al. (1994) Dietary intake of vitamins, minerals, and fiber of person ages 2 months and over in the United States: Third National Health and Nutrition Examination Survey, Phase 1, 1988-91. Adv Data 258: 1-28.
-
Feinstein A (1996) Prevention’s healing with vitamins: the most effective vitamin and mineral treatments for everyday health problems and serious disease. From allergies and arthritis to water retention and wrinkles. Prevention Magazine Health Books, Rodale.
-
Coudray C, Rambeau M, Feillet-Coudray C, Gueux E, Tressol JC, et al. (2005) Study of magnesium bioavailability from ten organic and inorganic Mg salts in Mg-depleted rats using a stable isotope approach. Magnes Res 18(4): 215-223.
-
Gropper SS, Smith JL, Groff JL (2005) Magnesium. In: Advanced Nutrition and Human Metabolism (4th Edn.), Wadsworth Publishing, Belmont, Calif.
-
Takaya J, Higashino H, Kobayashi Y (2004) Intracellular magnesium and insulin resistance. Magnes Res 17(2): 126-136.
-
Barbagallo M, Dominguez LJ, Galioto A, Ferlisi A, Cani C, et al. (2003) Role of magnesium in insulin action, diabetes and cardiometabolic syndrome X. Mol Aspects Med 24(1-3): 39-52.
-
National Center for Complementary and Alternative Medicine. Magnesium and asthma-clinical trials.
-
Trivedi MK, Branton A, Trivedi D, Nayak G, Balmer AJ, et al. (2017) Evaluation of physicochemical, thermal, structural, and behavioral properties of magnesium gluconate treated with energy of consciousness (The Trivedi Effect®). Journal of Drug Design and Medicinal Chemistry 3: 5-17.
-
Trivedi MK, Branton A, Trivedi D, Nayak G, Balmer AJ, et al. (2017) Study of the energy of consciousness healing treatment on physical, structural, thermal, and behavioral properties of zinc chloride. Modern Chemistry 5(2): 19-28.
-
Trivedi MK, Branton A, Trivedi D, Nayak G, Balmer AJ, et al. (2017) Evaluation of physicochemical, spectral, thermal and behavioral properties of the biofield energy healing treated sodium selenate. Science Journal of Chemistry 5(2): 12-22.
-
Rubik B, Muehsam D, Hammerschlag R, Jain S (2015) Biofield science and healing: history, terminology, and concepts. Glob Adv Health Med 4(Suppl): 8-14.
-
Barnes PM, Bloom B, Nahin RL (2008) Complementary and alternative medicine use among adults and children: United States, 2007. Natl Health Stat Report 12: 1-23.
-
Trivedi MK, Patil S, Shettigar H, Singh R, Jana S (2015) An impact of biofield treatment on spectroscopic characterization of pharmaceutical compounds. Mod Chem Appl 3(3): 159.
-
Trivedi MK, Branton A, Trivedi D, Nayak G, Bairwa K, et al. (2015) Spectroscopic characterization of disulfiram and nicotinic acid after biofield treatment. J Anal Bioanal Tech 6: 265.
-
Trivedi MK, Tallapragada RM, Branton A, Trivedi D, Nayak G, et al. (2015) The Potential impact of biofield energy treatment on the atomic and physical properties of antimony tin oxide nanopowder. American Journal of Optics and Photonics 3: 123-128.
-
Trivedi MK, Tallapragada RM, Branton A, Trivedi D, Nayak G, et al. (2015) Characterization of physical and structural properties of aluminium carbide powder: Impact of biofield treatment. J Aeronaut Aerospace Eng 4: 142.
-
Trivedi MK, Branton A, Trivedi D, Nayak G, Plikerd WD, et al. (2017) A systematic study of the biofield energy healing treatment on physicochemical, thermal, structural, and behavioral properties of magnesium gluconate. International Journal of Bioorganic Chemistry 2: 135-145.
-
Trivedi MK, Branton A, Trivedi D, Nayak G, Lee AC, et al. (2017) investigation of physicochemical, spectral, and thermal properties of sodium selenate treated with the Energy of Consciousness (The Trivedi Effect®). American Journal of Life Sciences 5: 27-37.
-
Trivedi MK, Branton A, Trivedi D, Nayak G, Gangwar M, et al. (2015) Evaluation of vegetative growth parameters in biofield treated bottle gourd (_Lagenaria siceraria_) and okra (_Abelmoschus esculentus_), International Journal of Nutrition and Food Sciences 4(6): 688-694.
-
Trivedi MK, Patil S, Shettigar H, Gangwar M, Jana S (2015) Antimicrobial Sensitivity Pattern of _Pseudomonas_ _fluorescens_ after Biofield Treatment. J Infect Dis Ther 3(3): 222.
-
Trivedi MK, Branton A, Trivedi D, Nayak G, Bairwa K, et al. (2015) Impact of biofield treatment on spectroscopic and physicochemical properties of _p_-nitroaniline. Insights in Analytical Electrochemistry 1: 1-8.
-
Trivedi MK, Branton A, Trivedi D, Shettigar H, Bairwa K, et al. (2015) Fourier transform infrared and ultraviolet- visible spectroscopic characterization of biofield treated salicylic acid and sparfloxacin. Nat Prod Chem Res 3: 186.
-
Trivedi MK, Branton A, Trivedi D, Nayak G, Mondal SC, et al. (2015) Impact of biofield energy treatment on soil fertility. Earth Sciences 4(6): 275-279.
-
Trivedi MK, Branton A, Trivedi D, Nayak G, Gangwar M, et al. (2015) Evaluation of vegetative growth parameters in biofield treated bottle gourd (_Lagenaria siceraria_) and okra (_Abelmoschus esculentus_), International Journal of Nutrition and Food Sciences 4: 688-694.
-
Trivedi MK, Branton A, Trivedi D, Nayak G, Bairwa K, et al. (2015) Characterization of physicochemical and spectroscopic properties of biofield energy treated bio peptone. Advances in Bioscience and Bioengineering 3(6): 59-66.
-
Trivedi MK, Branton A, Trivedi D, Nayak G, Bairwa K, Jana S (2015) Physicochemical and spectroscopic properties of biofield energy treated protose. American Journal of Biomedical and Life Sciences 3: 104-110.
-
Storey RA, Ymen I (2011) Solid state characterization of Pharmaceuticals, Wiley-Blackwell, UK. 30. Gupta KR, Askarkar SS, Joshi RR, Padole YF (2015) Solid state properties: Preparation and characterization. Der Pharmacia Sinica 6: 45-64.
-
Trivedi MK, Branton A, Trivedi D, Nayak G, Lee AC, et al. (2017) A comprehensive analytical evaluation of the Trivedi Effect®-Energy of Consciousness Healing Treatment on the physical, structural, and thermal properties of zinc chloride. American Journal of Applied Chemistry 5(1): 7-18.
-
Trivedi MK, Branton A, Trivedi D, Nayak G, Plikerd WD, et al. (2017) A systematic study of the biofield energy healing treatment on physicochemical, thermal, structural, and behavioral properties of iron sulphate. International Journal of Bioorganic Chemistry 2(3): 135- 145.
-
Trivedi MK, Nayak G, Tallapragada RM, Patil S, Latiyal O, et al. (2015) Effect of biofield treatment on structural and morphological properties of silicon carbide. J Powder Metall Min 4: 132.
-
Inoue M, Hirasawa I (2013) The relationship between crystal morphology and XRD peak intensity on CaSO4.2H2O. J Crystal Growth 380: 169-175.
-
Raza K, Kumar P, Ratan S, Malik R, Arora S (2014) Polymorphism: The phenomenon affecting the performance of drugs. SOJ Pharm Pharm Sci 1(2): 10.
-
Brittain HG (2009) Polymorphism in pharmaceutical solids in Drugs and Pharmaceutical Sciences, 2nd (Edn.), Informa Healthcare USA, Inc. New York.
-
Blagden N, de Matas M, Gavan PT, York P (2007) Crystal engineering of active pharmaceutical ingredients to improve solubility and dissolution rates. Adv Drug Deliv Rev 59(7): 617-630.
-
Sun J, Wang F, Sui Y, She Z, Zhai W, et al. (2012) Effect of particle size on solubility, dissolution rate, and oral bioavailability: Evaluation using coenzyme Q10 as naked nanocrystals. Int J Nanomedicine 7: 5733-5744.
- The Role of Podocyte Apoptosis and the Involvement of SIRT1 in Diabetic Nephropathy
- Dealcoholization of Beer by Osmotic Distillation for the Beverage Industry
- Biopolymer-Based Edible Packaging- Biomaterials, Methods, and Applications in Food Industry: An Updated Review
- Influence of Bioprocessing Methods on 'China Rice' (Gawal R1), and Soyabean Supplementation on the Quality of Complementary Food
- Cassava (Manihot esculenta) Varietal Growth, Yield and Cyanide Content Performance in Three Sites in the South- Eastern Semi Arid Regions of Kenya
- Food Waste Treatment, Recycling, Management and Production of Value-Products-An Update on Methodologies and Current Trends