Effects of Storage Life and Variety on the Functional Properties of Stored Achicha
The effects of storage life and variety on the functional properties of stored achicha were determined.A-5 kg corms were sorted, washed and boiled for 3 hours and was cooled, peeled and cut into small sizes of average of 2.0 cm by 1.5 cm dimension with a sharp kitchen knife; dried under the sun for 5 days. The dried corms (achicha) were pulverized with a locally fabricated machine and stored in plastic containers for 0, 1, 2, 3 month(s) intervals. The data obtained were analyzed statistically using SPSS version 23. Means were separated at P ≤ 0.05 using Fisher’s Least Significant Differences. After 3 months storage, edeofe, cocoindia and anampu had the following functional properties of achicha: bulk density (0.85, 0.70, 0.60)g/ml, swelling index (0.82, 1.09, 0.92), water absorption capacity (2.08, 2.15, 2.13), oil absorption capacity(0.65, 0.85, 0.86), wettability (16.80, 13.81, 15.72)s, gelation capacity (0.78, 0.70, 0.39)g/5ml, gelation temperature (84, 80, 83)oC, foam stability (5.08, 6.94, 5.00)%, foam capacity (11.29, 12.78, 9.10)%, viscosity (0.11, 0.18, 0.16)mPa and pH (5.59, 6.35, 6.03) respectively. The functional properties showed that they have better potential as soup thickeners. This showed that cocoindia had higher values in functional properties than other varieties after 3 months storage which indicates that it would be a better thickener than other varieties in soup and sauce preparations.
Introduction
Cocoyam (Colocassia and Xanthosoma spp.) is a stem tuber that is widely grown in the tropical regions of the world [1]. About 60% of the World’s cocoyam production (5.7 million ton) is in Africa and majority of the remaining 40% in Asia and the Pacific. Eze, et al. [1] also reported that Nigeria is the largest producer of cocoyam in the world, accounting for about 40% of the total world output. According to Manner, et al. [2], in other parts of the world, species of Colocasia are often referred to as taro, while cocoyam or tannia is used for species of Xanthosoma.In the Pacific Island countries where taro is widely cultivated and consumed, two botanical varieties of Colocasia have been identified as C. esculenta var. esculenta, many times called dasheen, and C. esculanta Var. esculenta, frequently called eddoe. It is referred to as the third important staple root crop after yam and cassava in Nigeria and provides a cheaper yam replacement, especially during periods of food scarcity or insufficient food supply [3].
The traditional way to cook taro is roasting on stones or baking in a ground oven. More modern ways of processing taro include steaming, boiling, or baking in the oven [4]. It must be thoroughly cooked to prevent mouth and throat itching. The corms and leaves of taro are usually eaten by humans after heat treatments, such as boiling, blanching, steaming, baking, roasting, stewing, and frying and pressure cooking. These methods are effective in improving its digestibility, increasing nutrient bioavailability, minimizing anti-nutritional factors and food-borne diseases. When taro corms are processed into powder and further decrease will occur when processed into taro noodles and cookies [4]. Therefore, the combination of cooking time temperature program is necessary to preserve the nutrients and deactivates the anti-nutritional factors. Cooking substantially may be used in the management of non-communicable illnesses such as obesity, heart disease, blood pressure, diabetes, cancer and gastrointestinal disorders because of the high fibre content [4].
The roots and leaves of the cocoyam (Colocasia esculenta) are extremely perishable; post-harvest losses of up to 40–60% have been reported [5]. A significant obstacle to the broader use of the crop is the high perishability of the harvested and stored cocoyam roots and leaves; therefore, it is necessary to diversify the uses in order to boost demand and accelerate the rate of turnover or product sale. Production and processing are hampered by inadequate cocoyam processing technology. Over time, local farmers have turned to sun-drying as a method of cocoyam preservation because of the highly perishable nature of the crop. The impact of these procedures and storage techniques on the overall caliber of the cocoyam products must be assessed [6, 7]. Achicha (dried cocoyam corms/cormels) is a pre-cooked, sun-dried cocoyam corms/cormels and it lends its name to the vegetarian dish made with it. Achicha does not only have enjoyable taste and satisfying but also low in calories. Achicha can be cooked in combination with fiofio (pigeon pea) or black beans (akidi oji), these are highly nutritional. Green leafy vegetables can also be added to it, for example, green amaranth, ugu and scent leaf. Dry fish is also added which is an optional ingredient [6, 7].
Assessing how storage duration and variety affect the functional characteristics of a product made from cocoyam is the primary goal of this study (achicha). The production of achicha, or dried cocoyam corms or cormels, and an assessment of its functional qualities after three months of storage are the means by which this can be accomplished. Small-scale farmers will have a market if cocoyam corms and cormels are processed into more shelf-stable dry products like achicha, which will decrease post-harvest losses of cocoyam and increase its potential applications. Both the manufacturers and the consumers of this product would feel more confident after an evaluation of the achicha.
Materials and Methods
Materials
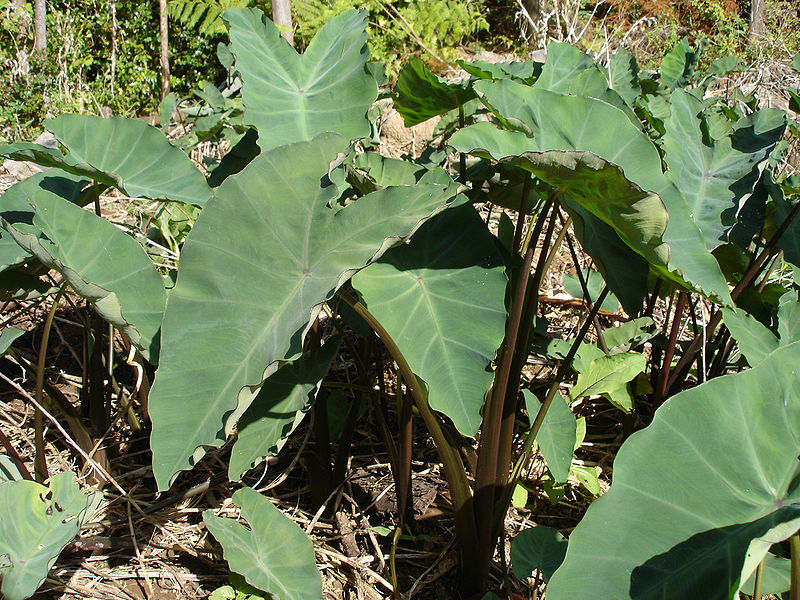
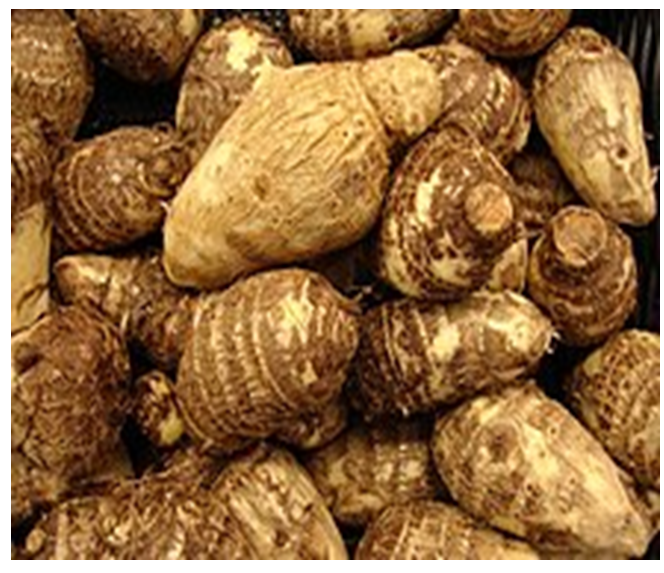
The National Root Crop Research Institute in Umudike, Abia State, provided the fresh cocoyam corms/cormels (ede ofe, NCE 002), cocoindia, NCE 001, and ukpong/anampu, NCE 004). The agronomist from the Cocoyam Unit of the National Research Institute Umudike, Abia State, identified the fresh samples. Figures 1 and 2 depict the cocoyam corms/cormels.
Methods
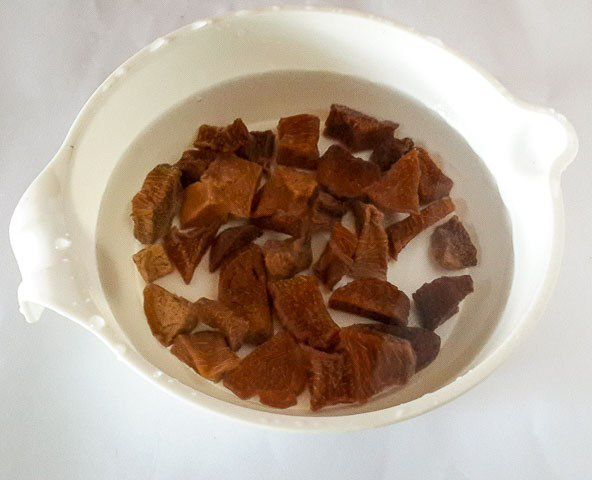
Processing of Corms/Cormels into Achicha (Dried Cocoyam): For every sample, five kilograms of cocoyam corms or cormels were sorted, cleaned, and cooked for three hours. With a sharp kitchen knife, it was cooled, peeled, and cut into small pieces, measuring an average of 2.0 cm by 1.5 cm. For five days, from nine in the morning to six in the evening, they were laid out on a mat and allowed to dry in the sun. A locally built machine was used to grind the dried cocoyam corms/cormels (achicha) before they were placed in different plastic containers for duration of three months. The samples were examined at zero, one, two, and three month intervals. Figures 1-4 display images of the cocoyam plant, corms/cormels, and processed achicha, respectively. Additionally, Figure 3 depicts the flow chart for producing achicha from cocoyam corms/cormels [6, 7].
Determination of Functional Properties of Achicha: The functional properties of the achicha flour samples were measured, and these included bulk density, swelling index, wettability, gelation capacity, gelation temperature, foam stability, foam capacity, viscosity, and pH.
• Determination of Bulk Density: Using the technique outlined by Chukwu, et al. [8] and Peter-Ikechukwu, et al. [9], the bulk density of the flour samples was calculated. The sample was put into an A-10 ml graduated cylinder. On a lab bench, the bottom of the cylinder was repeatedly tapped gently. Once the 10 ml mark was filled, the procedure was repeated until the sample level did not decrease any further. The weight of the samples divided by the sample volume (g/ml) was used to compute bulk density.
( ) ( ) ( )
Weight of Sample g Bulk density g/ml = Volume of Sample ml • Determination of Swelling Index: Using the technique outlined by Mbanali, et al. [10], the swelling index was calculated. It was calculated as the proportion of the swollen volume of extra water. A 1 g sample of flour was mixed with 10 ml of distilled water in a calibrated 10-milliliter measuring cylinder, and the volume was recorded. For one hour, the cylinder was allowed to remain undisturbed. After recording the volume that the sample subsequently occupied, the swelling capacity was computed as follows:
Volume occupied by sample after swelling Swelling Index = Volume occupied by sample before swelling • Determination of Water and Oil Absorption Capacity: According to Peter-Ikechukwu, et al. [9], the water and oil absorption capacity was determined. Ten milliliters of distilled water or oil were added to a graduated centrifuge tube containing a weighed sample weighing one gram. After that, the sample was well combined and left to stand at room temperature for half an hour. For thirty minutes, the mixture was centrifuged at 4000 rpm.For the purpose of converting the volume of free water or oil (the supernatant) to grams, its density was multiplied. The result was expressed as grams of water or oil absorbed per gram of sample. It was assumed that oil had a density of 0.88 g/ml and water had a density of 1 g/ml.
1 2 V -V WAC/OAC= D W Where: WAC= Water absorption capacity OAC= Oil absorption capacity V1= Initial volume of water or oil V2= Final volume after centrifuging W= Weight of sample. D= Density of water/ oil • Determination of Wettability: One gram of the sample was weighed into a 25 ml graduated cylinder with a 1 cm diameter, slightly modified from Chukwu, et al. [8]. The cylinder was inverted, clamped at a height of 10 cm from the surfaces of a 600 ml breaker containing 500 ml of distilled water, and the open end was covered with aluminum foil paper. The aluminum foil paper was then removed to allow the test material to be damped. The amount of time needed for the sample to get completely wet was its wettability.
• Determination of Gelation Capacity: The gelation capacity was calculated using an Onwuka [11] modified method. In test tubes, 2–20% (w/v) flour suspensions were made using 5 milliliters of distilled water. The suspensions were quickly cooled under cold running tap water after being brought to a boil in a water bath for an hour. The least gelling concentration, also known as the gelation capacity, was defined as the lowest concentration at which the gel formed did not collapse or slips from the invented test tube.
- Determination of Gelation Temperature: The gelation temperature was calculated utilizing the Onwuka [11] method. In a test tube, a 10% w/v sample was made. Thirty seconds after gelatinization was visibly observed, the temperature of the aqueous suspension was measured while it was heated in a boiling water bath while being continuously stirred.
- Determination of Foam Stability: Foam stability was assessed by applying the Onwuka [11] method. In a blender, 2 grams of each sample’s measured weight was whipped for 5 minutes at 1600 rpm using 100 milliliters of distilled water. The whipped mixture was poured into a graduated cylinder measuring 150 milliliter’s. After gently adding 10 milliliters of distilled water to the graduated cylinder, the blender jar was cleaned. The cylinder’s foam volume varies every 15, 30, 60, 90, and 120 seconds.
Foam Volume after time Foam stability = ×100 Initial Foam Volume
• Determination of Foam Capacity: The Chukwu, et al. [8] method was utilized to ascertain the foam capacity. Each sample was weighed out at 2 g, and it was blended for 5 minutes at 1600 rpm using 100 ml of distilled water in a blender. A 150 ml graduated cylinder was filled with the whipped mixture. After being cleaned with 10 milliliters of distilled water, the blender jar was carefully placed into the graduated cylinder, and after 30 seconds, the volume was recorded. Volumes recorded both before and after whipping were computed as follows:
Volume after whipping-Volume before whipping Foam capacity = ×100 Volume before whipping • Determination of Viscosity: According to Peter- Ikechukwu, et al. [12], a sample weighing 10 g was dissolved in 100 ml of distilled water and kept at room temperature for two hours while being mechanically stirred. We used a viscometer (model NDJ-9S) to measure the viscosity.
• Determination of pH: Chukwu, et al. [8] and Peter- Ikechukwu, et al. [9] provided the method used to determine the pH. In distilled water, a sample (10% w/v) was prepared. The sample was well combined, and a pH meter (model PHS-3C, China) was used to measure the pH.
Statistical Analysis: Version 23 of SPSS software was used to statistically analyze the obtained triplicate data. After determining the mean values, One-Way ANOVA was performed, and Fisher’s Least Significant Difference [13] was applied to separate the means (P ≤ 0.05).
Results and Discussion
Functional Properties of Achicha During Three Months of Storage
The comparison of the mean functional properties of three distinct Colocasia varieties (edeofe, cocoindia, and anampu) of processed achicha over a three-month storage period is presented in Table 1.
| Functional Properties | Edeofe (Month) | Cocoindia (Month) | Anampu (Month) | |||||||||
|---|---|---|---|---|---|---|---|---|---|---|---|---|
| 0 | 1 | 2 | 3 | 0 | 1 | 2 | 3 | 0 | 1 | 2 | 3 | |
| BD | 1.01a ±0.01 | 0.99b ±0.01 | 0.87c ±0.00 | 0.85d ±0.01 | 0.77e ±0.01 | 0.75f±0.01 | 0.73g ±0.00 | 0.70h ±0.01 | 0.66i ±0.01 | 0.65j ±0.00 | 0.62k ±0.01 | 0.60l ±0.00 |
| Swelling Index | 2.92a±0.03 | 1.33cde±0.03 | 1.01def±0.00 | 0.82f±0.03 | 2.10b±0.00 | 1.76bc±0.03 | 1.42cd±0.03 | 1.09cdef±0.00 | 2.57a±0.03 | 1.25cde±0.03 | 1.09cdef±0.66 | 0.92ef±0.00 |
| WAC | 2.20d ±0.01 | 2.16e±0.01 | 2.10h±0.01 | 2.08i ±0.01 | 2.30a ±0.01 | 2.22c±0.01 | 2.20d±0.01 | 2.15f±0.01 | 2.30a ±0.01 | 2.25b±0.01 | 2.20d ±0.01 | 2.13g ±0.01 |
| OAC | 0.88f±0.03 | 0.72i ±0.01 | 0.68j±0.01 | 0.65k±0.00 | 1.06c±0.01 | 0.98d±0.00 | 0.92e ±0.00 | 0.85h±0.00 | 2.11a±0.01 | 2.00b±0.00 | 0.90e±0.00 | 0.86g ±0.00 |
| Wettability | 27.05a±0.03 | 27.00b±0.00 | 16.89d±0.03 | 16.80e±0.00 | 15.24i±0.03 | 14.15j±0.03 | 14.10k±0.03 | 13.81l±0.03 | 17.1N5c±0.03 | 16.05f±0.03 | 15.80g±0.03 | 15.72h±0.00 |
| Gelation capacity | 0.92a±0.90 | 0.91a±0.70 | 0.91a±0.50 | 0.78b±0.78 | 0.91a±0.72 | 0.72c±0.41 | 0.70c±0.91 | 0.70c±0.70 | 0.50d±0.41 | 0.41e±0.92 | 0.41e±0.91 | 0.39e±0.39 |
| Gelation Temperature | 91.00abc±2.83 | 88.00bc±2.83 | 85.00cd±2.83 | 84.00d±2.83 | 88.00bc±2.83 | 86.00c±2.83 | 81.50d±2.83 | 80.00d±2.83 | 90.00abc±0.00 | 86.00c±2.83 | 83.00d±0.28 | 83.00d±2.83 |
| Foam Stability | 6.72e±0.03 | 5.43f±0.03 | 5.10g±0.03 | 5.08g±0.03 | 10.78a±0.03 | 9.56b±0.03 | 8.07c±0.03 | 6.94d±0.03 | 6.22e±0.03 | 5.79f±0.03 | 5.22f±0.03 | 5.00g±0.03 |
| Foam Capacity | 13.69c±0.04 | 12.69f±0.03 | 11.63i±0.03 | 11.29j±0.04 | 14.84a±0.03 | 14.36b±0.03 | 13.27d±0.03 | 12.78e±0.03 | 12.43g±0.03 | 12.30h±0.04 | 9.44k±0.03 | 9.10l±0.03 |
| Viscosity | 0.19a±0.18 | 0.17ab±0.02 | 0.12c±0.18 | 0.11c±0.17 | 0.20a±0.20 | 0.20a±0.18 | 0.19a±0.13 | 0.18a±0.19 | 0.18a±0.18 | 0.18a±0.11 | 0.18a±0.18 | 0.16ab±0.16 |
| pH | 5.99f±0.00 | 5.71g±0.03 | 5.65h±0.00 | 5.59i±0.00 | 6.64a±0.03 | 6.50b±0.00 | 6.44c±0.03 | 6.35d±0.03 | 6.44c±0.03 | 6.34d±0.00 | 6.12e±0.00 | 6.03f±0.03 |
Table 1: Functional Properties of Achicha during Three Months Storage.
Values are means of three independent determinations ±SD. Means in the same row with the same superscript are not significantly p> 0.05 different.
Bulk Density (g/ml): Achicha’s bulk density varied between 0.60 and 1.01 g/ml. There was a significant difference (p<0.05) observed between the samples. At one month, edeofe had the highest bulk density, while at three months, anampu had the lowest. Sample bulk densities decreased with lengthening storage times. The bulk density of the flour samples is greater than the 0.57–0.71 g/ml and 0.689 g/ml values for taro flours reported by Njintang, et al. [14] and Kaur, et al. [15]. Ezeocha, et al. [16] found that cooked trifoliate yam flour had a bulk density of 0.86 g/cm3. In numerous handling, storing, and processing procedures, the bulk characteristics of particulate foods are directly and significantly important. According to Adepeju, et al. [17], high bulk density is preferred because it allows for more packing advantage by allowing for the packing of larger quantities into a given volume. The powder’s flow ability and storage stability may be impacted by internal cohesion, which is one physical characteristic that they can indirectly indicate [12]. Drying reduces flour’s bulk density, according to Hayata, et al. [18]. It measures the weight of solid samples, which is crucial for figuring out how to handle materials, package products, and apply them in the food business [19]. According to Owuamanam, et al. [20], bulk density and porosity are influenced by the flour’s particle size and are crucial factors in the mixing, sorting, packing, and transportation of particulate matter (Dough formation). For improved disperability and a thinner paste, a higher bulk density is generally preferred [21]. Chukwu, et al. [8] state that a high bulk density is a beneficial physical characteristic for assessing the mixing quality of particulate matter. As particle size and bulk density are inversely correlated, bulk density is a function of particle size [22]. Low bulk density may arise from the starch polymers’ loose structure, according to reports that the starch polymers’ structure affects bulk density [23]. Since food products typically use flours with high bulk densities (>0.7 g/cm3) as thickeners, the edeofe and cocoindia in this study may also be appropriate for this purpose. For babies, low bulk density is beneficial because it increases the child’s calorie and nutritional density with each feeding. Since flour has a low bulk density, it can be easily distributed and transported to the necessary locations, making it a good physical attribute for transportation and storability [24].
Swelling Index: The range of the swelling index was 0.92 to 2.9. There was a significant difference (p<0.05) between the samples. The edeofe (2.92 ml) had the highest swelling index value at zero months, while the anampu (0.92 ml) had the lowest value at three months. The size of the particles, the variety, and the types of unit operations or processing techniques all affect how much a flour can swell. Research indicates that parboiled rice flour has a higher capacity to swell than raw rice flour. When compared to other root crops like cassava, cocoyam samples typically exhibit a good swelling index. This can be attributed to the unique granule form and high digestibility of cocoyam starch. About one tenth of the starch grain in potatoes is found in cocoyams [9, 25]. The size of specifics, variety types, and processing techniques or unit operations all affect the flours’ swelling index. Loose particles affect both the swelling capacity and the swelling index [8].
Water Absorption Capacity (WAC): Achicha has a range of water absorption capacities, from 2.08 to 2.30. There was a significant difference (p<0.05) observed between the samples. At zero months, the highest WAC values were found in Cocoindia (2.30) and Anampu (2.30). At three months, edeofe had the lowest WAC value (2.08).According to Abiodun, et al. [26], the amounts of flour obtained from trifoliate yams that were left untreated and those that were soaked at room temperature varied from 1.47 to 2.53 ml/ H2O/g and 1.66 to 2.25 ml/H2O/g, respectively. The water that a food product retains after filtering and applying a light centrifugal pressure is referred to as its water absorption capacity. Increased flour water absorption contributes to the preservation of bread, cakes, and sausage freshness. Flour’s superior ability to absorb water makes it a preferred ingredient for thickening soups. The loss of starch crystalline structure, increased amylose leaching, and increased solubility have all historically been linked to rising WAC levels. It’s possible that the flour with high water absorption contains more hydrophilic ingredients, like polysaccharides. Proteins can interact with water in food because they are both hydrophilic and hydrophobic in nature. According to Butt and Batool, variations in protein concentration, their levels of water interaction, and their conformational traits could be the cause of the variation in the samples. Flour absorbs more when it is dried [18]. According to Niba, et al. [27], baking applications as well as product consistency and bulking depend on water absorption capacity. When developing ready-to-eat foods, the ability to absorb water is crucial, and a high absorption capacity can ensure the cohesiveness of the final product [28]. The degree to which native starch granules disintegrate affects the water absorption capacity of flours, indicating that undamaged starches have low potential absorption capacities. According to Chukwu, et al. [8], the WAC of flour allows the processor to add more water during food preparation, improving handling characteristics and profit ability while maintaining the freshness of bakery products. Colocasia species are well suited for use as a soup thickener due to their high water absorption capacity [20]. In line with the findings of Malomo, et al. [23], which show that the WAC decreases with increasing protein content, the water absorption capacity in this work decreases as protein content increases [29]. When it comes to dough and pastes, for example, the water absorption characteristics show how well the production associate can bind with water [10, 30]. Food materials’ ability to absorb water is sometimes linked to the amount of protein and starch they contain Ali, et al. [31]. It is also thought that boiling the food can cause the protein molecules to separate or change into monomeric subunits, which may have more water binding sites [32]. Kinsella, et al. [33] state that all forms of hydrated water and some water that is still loosely connected to protein after centrifugation are included in the binding water [8]. Palatability, digestibility, physical structure, and technical handling are all significantly influenced by the amount of water present in food and its concentration, which is determined by the water absorption capacity and stability [32]. In food systems, having the ability to absorb water is desirable for increasing food consistency, yield, and body [34]. The ability of a substance to absorb water depends on its size, shape, pH, salt content, and the presence of proteins, carbs, and fats. Prior processing may also have an impact, including heating, alkali processing, disulfide linking, etc [35].
Oil Absorption Capacity (ml/g): The achicha flour had an oil absorption capacity (OAC) ranging from 0.65 to 2.11. There was a significant difference between the samples (p<0.05). At one month, the OAC value was highest in Anampu, and at three months, it was lowest in Edeofe. OAC was reported to range between 22.0 and 27.5% by Falade, et al. [19]. An extremely desirable feature in products like mayonnaise, oil absorption capacity indicates the emulsifying capacity and the amount of oil that can be picked up by a sample during frying. Protein, which consists of both hydrophilic and hydrophobic components, is the main chemical factor influencing oil absorption capacity. Lipid hydrocarbon chains and non-polar amino acid side chains can interact hydrophobically [36]. Fats enhance food’s flavour and mouth feel, so fat absorption is a crucial component of food formulations [17]. Oils are physically trapped, which is the primary cause of oil absorption capacity. As stated by Onimawo, et al. [22], it is a measure of the speed at which protein binds to fat in food formulas. Food formulas like sausages and baked goods benefit from the use of OAC. Fat enhances the mouth-feel of food and helps to hold onto flavor. Fatty ingredients improve the texture of the baked good and boost the baking powder’s leavening power. Protein, which is made up of both hydrophilic and hydrophobic components, is the main chemical element that affects OAC. According to Jitingarmkusol, et al. [37], Chukwu, et al. [8], Mbanali, et al. [10], Mbanali, et al. [30], Peter-Ikechukwu, et al. [9], Peter- Ikechukwu, et al. [12] side chains of non-polar amino acids can interact hydrophobically with the hydrocarbon chains of lipids.
Wettability (Second): Samples’ wettability varied from 13.81 s to 27.0 5 s. The samples differed significantly (p<0.05). The wettability value in edeofe was 27.05 s at zero months, while the value in cocoindia was 13.81 s at three months. In the formulation of food, wettability is crucial. Protein wettability is determined by the size, microstructure, topography, texture, and area of the protein particles as well as by surface polarity, but not always by the quantity of native structure [8]. Different D. alata flour varieties (27-35 s) were noted by Udensi, et al. [21].
Gelation Capacity (g/5ml): The samples varied in ways that were statistically significant (p<0.05). Samples ranged in gelation capacity from 0.39 to 0.92 g/5 ml. The gelation capacity of edeofe (0.92 g/5ml) at zero months was the highest, while that of 0.39 g/5ml at three months was the lowest. According to Aremu, et al. [38], Peter-Ikechukwu, et al. [9] and Peter-Ikechukwu, et al. [12], interactions between various constituents, including protein, carbohydrates, and lipids, may play a significant role in the functional properties of pulse/legume flours, which could explain the variation in their gelling properties. The ability of a flour sample to form gel is known as its gelation capacity. The values of least gelation concentration compared favorably to those reported by Abbey, et al. [39] for African yam beans, which ranged from 16 to 20%.
Gelation Temperature (oC): Sample differences were statistically significant (p<0.05). The sample was gelled at a temperature between 80 oC and 91oC. The temperature at which gelation occurred was highest in edeofe (91oC) at zero month, and lowest in cocoindia (80oC) at three months. Compared to Xanthosoma spp., Colocasia spp. displayed a higher gelling point. This suggested that the crystals of Colocasia spp. flour were more stable when heated. According to Sai-Ut, et al. [40], the gelling temperature is the point at which applying heat causes a food solution to visibly thicken. The presence of additional ingredients, such as proteins and lipids, in cocoyam flours may prevent granules from swelling and hence raise the amount of heat needed to achieve the final swelling, which could account for the flour samples’ comparatively high gelling temperature [8, 9, 12]. Previous reports have documented comparable observations [8]. The cocoyam flours’ boiling points ranged widely, from 88.5°C (Xanthosoma spp.) to 80°C (edeofe). This temperature is the point at which starch begins to gel. The results of the study showed that higher starch flour required the lowest temperature to gelatinize. According to Amandiki [41], a high gelling temperature denotes low starch content. The relative ratio of amylose to amylopectin in flour may be related to the gelling temperature, as suggested by Owuamanam, et al. [20]. That means using less energy to cook the food is the implication of the outcome.
Foam Stability (%): Foam stability ranged from 5.02 to 10.78 percent. Anampu (2.22 %) had the least amount of foam stability among the samples at three months, while cocoindia (10.78 %) had the highest foam stability at zero months. There was a significant difference between the samples (p<0.05). Foam stability and capacity are inversely correlated. Large air bubbles surrounded by a thinner, less flexible protein film may form on frothy flours. According to Jitngarmkusol, et al. [37], Chukwu, et al. [8], Peter- Ikechukwu, et al. [9] and Peter-Ikechukwu, et al. [12], these air bubbles may be less stable because they collapse more easily. Moreover, the quantity of polar and non-polar lipids as well as solubilized protein in a sample affects foam stability [42].
Foam Capacity (%): The range of foam capacity was 9.10% to 14.84 %. There was a significant difference (p<0.05) between the samples. The zero-month cocoindia had the highest foam capacity (14.84%), while the three-month anampu had the lowest foam capacity (9.10%). According to Zhou, et al. [42], foam stability and capacity indicate the amount of adsorbed air on the air-liquid interface during whipping or bubbling as well as the material’s capacity to form a cohesive viscoelastic film via intermolecular interactions. Moreover, the quantity of solubilized protein and the amount of polar and non-polar lipids in a sample are connected to foam stability [42]. Previous studies, however, have demonstrated that surface tension, pH, protein types, processing techniques, and viscosity all affect foam stability and capacity [43]. Food texture, consistency, and appearance can all be enhanced with the use of foams. The amount of interfacial area that a protein can create is referred to as its foam capacity. A colloidal of numerous gas bubbles trapped in a liquid or solid is called foam. Thin liquid films encircle tiny air bubbles. The low protein content of cocoyam flour has been linked to its generally low foaming capacity [44]. However, Amon, et al. [45] found that the flour from boiling taro corms had the highest capacity to foam and proposed that heating had a positive impact on the three main components of foam formation: surface tension, viscosity, and protein film characteristics. Food’s foam properties are related functional properties of proteins. In order to achieve the best foam formation, the surfactant needs to be soluble in liquid phase and have the ability to migrate and orient quickly in order to create an interfacial film around gas bubbles that are just beginning to form. On the other hand, Kinsella, et al. [33] found that limited heating promotes foam formation by raising the rate of surface adsorption, stable surface pressures, and surface concentration of globular proteins, which causes partial unfolding of the proteins without causing thermal coagulation. Protein solubility is often reduced as a sign of denaturation [8, 9, 12].
Viscosity (mPa.): The samples’ viscosities varied from 0.11 to 0.20 mPa. All samples, with the exception of edeofe at two and three months (0.12 mPa and 0.11 mPa), were significantly (p>0.05) similar. At zero and one month, cocoindia (0.20 mPa.) had the highest viscosity value. The three months of edeofe had the lowest viscosity (0.11 mPa). A higher viscosity indicates that the starch granules are intact, whereas viscosity is lost in starch that has experienced chemical and microbial damage [9, 10, 12, 30]. Viscosity can be thought of as a measure of the strength of starch granules.
pH: The achicha had pH values between 5.59 and 6.64. At zero month, cocoindia had the highest pH value (6.64). Sample differences were statistically significant (p<0.05). According to Chukwu, et al. [8], Peter-Ikechukwu, et al. [9] and Peter-Ikechukwu, et al. [12], the cocoyam samples’ pH values fell between 5.9 and 6.64, which is considered low acidity and may encourage the growth and multiplication of microorganisms, especially in slurry form. As a result, in order to prolong the storage life, preservation measures such as water activity reduction and the addition of chemical anti- microbial agents and antioxidants may be necessary [20]. Based on this study, it is expected that edeofe will last longer than the other samples. Colocasia species displayed lower pH values than their Xanthosoma species, according to Falade, et al. [19]. While the pH values of each sample ranged from 6.56 (cocoindia) to 7.59 (edeofe green), they were all within the neutral pH range. The pH range of 4 to 8, where the cocoyam flours fall, may encourage the growth and multiplication of microorganisms, especially when they are in a slurry form. Owuamanam, et al. [20] reported that comparable pH ranges (4.2–5.78) were noted in certain additional cocoyam cultivars. Accordingly, preservation measures like adding chemical anti-microbial agents and antioxidants, decreasing water activity, and increasing storage life may be necessary [20]. According to Davies, et al. [46], pH is a crucial property for starch-related industrial applications because it typically indicates whether a liquid medium is acidic or alkaline [47, 48, 49, 50, 51].
Conclusion
Their potential as thickeners is greater, as indicated by their functional properties. But after three months of storage, all of the varieties’ functional qualities decreased. The results of the three-month storage period showed that edeofe had the highest mean value in terms of bulk density, wettability, gelation capacity, and gelation temperature; cocoindia had the highest mean value in terms of swelling index, water absorption capacity, foam stability, foam capacity, viscosity, and pH; and anampu had the highest mean value in terms of oil absorption capacity alone.This demonstrated that cocoindia had higher values in functional properties than other varieties after 3 months storage which indicates that it would be a better thickener than other varieties in soup and sauce preparations.
Recommendation
In order to support achicha’s complete inclusion in the list of vegetables in recipes for traditional cuisines, efforts should be directed toward identifying and refining appropriate food processing methods. Additional research on the impact of storing these products made from cocoyams should be done.
References
-
Eze CC, Okorji EC (2003) Cocoyam production by women farmers under improved and local technologies in Imo State. Nigeria Journal of Science 5(1): 113-116.
-
Manner HI, Taylor M (2010) Farm and forestry production and marketing profile for Taro (_Colocasia_ _esculenta_). In: Elevitch CR, et al. (Eds.), Specialty crops for Pacific Island Agroforestry, PermanentAgriculture Resources (PAR) Holualoa, Hawaii, pp: 1-34.
-
Onyeka J (2014) Status of Cocoyam (_Colocasia esculenta_ and _Xanthosoma spp_) in West and Central Africa: Production, Household Importance and the Threat from Leaf Blight. Lima (Peru). CGIAR Research Program on Roots, Tubers and Bananas (RTB).
-
Soundy ID, Delatour P, Grancher D (2010) Effects of traditional soaking on the nutritional profile of taro flour (_Colocasia esculenta_ L. Schott) produced in Chad. Revue Med Vet 1: 37-42.
-
Anele I, Nwawuisi JU (2008) Comparison of the effects of three pathogenic fungi on cocoyam storage. Proc 42nd Ann Conf Agric Soc of Nigeria, pp: 183-186.
-
David-Chukwu NP, Onwuka GI, Aji RU, Odom TC, Chukwu MN (2021) Production, Microbiological and Organoleptic Properties of Stored Cocoyam-based Products. International Journal of Nutrition and Food Sciences 10(6): 134-143.
-
David-Chukwu NP, Amadi AG, Onuabuchi IC, Chukwu MN, (2022) Influence of storage life and variety on the micro-nutrient compositions of stored cocoyam-based products. Food Ther Health Care 4(2): 1-12.
-
Chukwu MN, Kabuo NO, Nwokocha NJ (2018) Effects of fermentation time on the functional properties of ogiri- ahuekere (_Arachis_ _hypogaea_ Linn) seed condiment. International Journal of Biotechnology and Food Sciencem 6(5): 77-85.
-
Peter-Ikechukwu AI, Ogazi CG, Uzoukwu AE, Kabuo NO, Chukwu MN (2020) Proximate and Functional Properties of Composite Flour Produced With Date Fruit Pulp, Toasted Watermelon Seed and Wheat. J Food Chem Nanotechnol 6(3): 159-166.
-
Mbanali UG, Chukwu MN, Iwuagwu MO (2018) Variation in the functional properties of blends of heat-treated local thickening seeds and cocoyam flour_._ Research Journal of Food Science and Nutrition 3(5): 74-83.
-
Onwuka GI (2005) Food analysis and instrumentation: theory and practice. Naphtali Prints, Lagos, Nigeria, pp: 133-137.
-
Peter-Ikechukwu A, Ibeabuchi JC, Eluchie CN, Agunwa IM, Aneke EJ, et al. (2019) Functional Properties of Sausage Rolls Made from Cocoyam and Wheat Flour Enriched with Soybean Flour. Food Science and Nutrition Studies 3(2): 39-53.
-
Landau S, Everitt BS (2004) A Handbook of Statistical Analyses using SPSS. Chapman & Hall/CRC Press LLC, New York, USA, pp: 140-200.
-
Njintang NY, Mbofung CMF, Kesteloot R (2007) Multivariate analysis of the effect of drying method and particle size of flour on the Instrumental texture characteristics of paste made from two varieties of taro flour. Journal of food Engineering 81(1): 250-256.
-
Kaur M, Kaushal P, Sandhu KS (2013) Studies on Physicochemical and pasting properties of Taro (_Colocasia_ _esculenta_ L.) flour in comparison with a cereal, tuber and legume flour. J Food Sci Technol 50(1): 94-100.
-
Ezeocha VC, Omodamiro RM, Oti E, Chukwu GO (2011) Development of trifoliate yam: Cocoyam composite flour for fufu production. Journal of Stored Products and Postharvest Research 2(9): 184-188.
-
Adepeju AB, Gbadamosi SO, Adeniran AH, Omobuwajo TO (2011) Functional and pasting characteristics of breadfruit (Artocarpus altilis) flours. African Journal of Food Science 5(9): 529-535.
-
Hayata M, Alpaslan M, Bayer AD (2006) Effect of drying on functional properties of Tarhana. International Journal of Food Science and Technology 29: 457-462.
-
Falade K, Okafor CA (2015) Physical, functional, and pasting properties of flours from corms of two Cocoyam (_Colocasia esculenta_ and _Xanthosoma sagittifolium_) cultivars. J Food Sci Technol 52(6): 3440-3448.
-
Owuamanam CI, Ihediohanma NC, Nwanekezi EC (2010) Sorption Isotherm, Particle size, Chemical and Physical properties of Cocoyam corm Flours, Researcher 2(8): 1-9.
-
Udensi EA, Oselebe HO, Iweala OO (2008) The investigation of chemical composition and functional properties of water yam (_Dioscorea alata_): Effect of varietal differences. Pak Journal of Nutr 7(2): 342-344.
-
Onimawo IA, Akubor PI (2012) Food Chemistry (integrated Approach with Biochemical background). 2nd (Edn.), Joytal Printing Press, Agbowo, Ibadan, Nigeria.
-
Malomo O, Ogunmoyela OAB, Adekoyeni OO, Jimoh O, Oluwajoba SO, et al. (2012) Rheological and functional properties of soy-poundo yam flour. International Journal of Food Science and Nutrition Engineering 2(6): 101-107.
-
Agunbiade SO, Sanni MO (2003) The effect of ambient temperature of cassava tubers on starch quality. In: Root crops. The small processor and development of Local food Industries for market economy. Proceedings of the Eight Triennials symposium of the International society for Tropical Root Crops. African Branch, IITA, Ibadan, Nigeria, pp: 180-194.
-
Akomas ECA, Mbanaso ECA, Akoma OEU (1987) Food forms of cocoyam for home and commercial use. Proceedings of the 1st National Workshop on Cocoyam NRCRI, Umudike, Nigeria, pp: 187-195.
-
Abiodun OA, Akinoso R (2014) Physical and Functional Properties of Trifoliate Yam Flours as Affected by Harvesting Periods and Pre-treatment Methods. J Food Process Technol 5: 302.
-
Niba LL, Bokanga M, Jackson FI, Sclimme DS, Li BW (2001) Physiochemical properties and starch granular characteristics of flour from various _Manihot esculenta_ (cassava) genotypes. Journal educational Sciences 67(5): 1701-1705.
-
Houson, P, Ayenor GS (2002) Appropriate Processing and food functional properties of maize flour. African Journal of Science and Technology 3(1): 121-126.
-
David-Chukwu NP, Aji RU, Ndukwe KO, Odom TC, Chukwu MN (2021) Production, Proximate Compositions and Dry Matters of Stored _achicha_ and _mpoto -_ Cocoyam Based Products. International Journal of Nutrition and Food Sciences 10(6): 144-152.
-
Mbanali UG, Chukwu MN, Iwuagwu MO (2019) Effect of Heat Treatments on Pasting Properties of Local Thickening Seeds and Blending Ratios of Cocoyam Flour. Direct Research Journal of Agriculture and Food Science 7(3): 45-53.
-
Ali Z, Malik RN, Abdul, Q (2013) Heavy metals distribution and risk assessment in soils affected by tannery effluents Chem. Ecol 29(8): 676-692.
-
Obiegbuna JE, Ishiwu CN, Akubor PI, Igwe EC (2014) Effect of Processing and storage Relative Humidity on Selected Functional Properties of Cocoyam (_Colocasia_ _Esculenta_) Corm Flour. Food Science and Quality Management 28: 1-11.
-
Kinsella JE, Desmondara S, German BB (1985) Physical, Chemical and functional Properties of Oil Seed proteins with Emphasis on soy Proteins. Academic Press Inc, New York, pp: 107-179.
-
Osundahusi OF, Fagbemi TN, Kesselman E, Shimoni E (2003) Comparison of the Physioco-chemical properties and pasting characteristics of flour and starch from red and white sweet potato cultivars. Journal of Agriculture and food Chemistry 51(8): 2232-2236.
-
Iwe MO (2003) The Science and Technology of Soyabean. Rojoint communication Limited, Enugu, Nigeria, pp: 115-138.
-
Eltayeb ARSM, Ali AO, Abou-Arab AA, Abu-Salem FM (2011) Chemical composition and functional properties of flour and protein isolate extracted from Bambara ground nut (_Vigna subterranean_). African J Food Sci 5(2): 82-90.
-
Jitngarmkusol S, Hongsuwankul J, Tananuwong K (2008) Chemical Compositions, Functional Properties and microstructure of defatted macademice flours. Food Chem 110(1): 23-30.
-
Aremu MO, Olaofe O, Akintayo ET (2007) Functional Properties of some Nigerian varieties of legume seed flour concentration effect on foaming and gelation properties. J Food Technol 5(2): 109-115.
-
Abbey BW, Ayuk EJ (1991) Functional properties of African yam bean flour (_Sphenasylis sternocarpa_). Nig J Nutri Sci 12: 44-46.
-
Sai-Ut S, Ketnawa S, Chaiwut P, Rawadkuen S (2009) Biochemical and functional properties of proteins from red kidney, navy and adzuki beans. Asian J Food Agro- Ind 2(4): 493-504.
-
Amandikwa C (2012) Proximate and functional Properties of open Air, Solar and Oven dried cocoyam flour. Int’l Journal of Agric. and Rural Dev 15(2): 988- 994.
-
Zhou T, Zhang T, Liu W, Zhao G (2011) Physioco-chemical characteristics and functional properties of grape (_Vitis_ _vinifera_ L.) seeds protein. International Journal of Food Science and Technology 46: 635-641.
-
Akubor PI (2003) Functional Properties and Performance of Cowpea/ plantain/ Wheat flour blends in biscuits. Plant foods for Human Nutrition 58(3): 1-8.
-
Ibebuchi CE, Uzoegbu JO (2002) Potentials of Wheat- cocoyam Flour blends in biscuit making. Proc 26th Annual NIFST Conference, Owerri, pp: 37-38.
-
Amon AS, Soro RY, Koffi PKB, Dué AE, Kouamé LP (2011) Biochemical characteristics of lour from Ivorian taro (_Colocasia esculenta, cv yatn_) corm as affected by boiling time. Adv J Food Sci Tech 3(6): 424-435.
-
Davies EM, Labuschagne MT, Koen E, Benesi MRI, Saka JDK (2008) Some properties of starches from Cocoyam (colocacia esculenta) and Cassava (manihot esculenta crants) grown in Malawi. African Journal of Food Science 2: 102-111.
-
Alam F, Hasnain A (2009) Studies on Swelling and Solubility of Modified Starch fromTaro (Colocasia esculenta): Effect of pH and Temperature. Agriculturae Conspectus Scientificus 74(1): 45-50.
-
Chinnajarn S, Reungrat Lirnroong K, Sangnar A, Puttakal WY (2006) Development of Health chip from Jackfruit seed flour. Research Report, Faculty of Science, Burapha University of Chronbir.
-
Njintang YN, Mbofung CMF (2003) Development of taro _Colocasia esculenta_ L. Schott) flour as ingredient in food processing: Effect of gelatinization and drying temperature on the dehydration kinetics and colour of flour. Journal of food Engineering 58(3): 259:265.
-
Njintang YN, Mbofung CMF, Moates KG, Parker L, Fauld CB, et al. (2007) Functional properties of five varieties of taro flour and relationship to creep recovery and sensory characteristics of _achu_ (taro based paste). J Food Eng 82(2): 114-120.
-
Sanni LO, Akingbala JO, Oguntunde AO, Bainbridge ZA, Graffthan AJ, et al. (2006) Processing of _Fufu_ from cassava in Nigeria: Problems and Prospects for Development.
- The Role of Podocyte Apoptosis and the Involvement of SIRT1 in Diabetic Nephropathy
- Dealcoholization of Beer by Osmotic Distillation for the Beverage Industry
- Biopolymer-Based Edible Packaging- Biomaterials, Methods, and Applications in Food Industry: An Updated Review
- Influence of Bioprocessing Methods on 'China Rice' (Gawal R1), and Soyabean Supplementation on the Quality of Complementary Food
- Cassava (Manihot esculenta) Varietal Growth, Yield and Cyanide Content Performance in Three Sites in the South- Eastern Semi Arid Regions of Kenya
- Food Waste Treatment, Recycling, Management and Production of Value-Products-An Update on Methodologies and Current Trends