Antioxidant and Anti-Inflammatory Activities of Biofield Energy Treated Proprietary Test Formulation in Intestinal Tissues on Combination of Cecal Slurry, LPS and E. coli Induced Systemic Inflammatory Response Syndrome (SIRS) in Sprague Dawley Rats
The study was aimed to evaluate the antioxidant and anti-inflammatory activity of the Biofield Energy Treated Proprietary Test Formulation and Biofield Energy Treatment per se to the animals on Cecal Slurry, LPS and E. coli-induced systemic inflammatory response syndrome (SIRS) model in Sprague Dawley rats. In this experiment, different antioxidants biomarkers such as myeloperoxidase (MPO), superoxide dismutase (SOD), lipid peroxidase (LPO) and proinflammatory cytokines such as tumor necrosis factor-α (TNF-α), interleukin-6 (IL-6), macrophage inflammatory protein-2 (MIP-2) were analysed using ELISA assay in intestines. A test formulation was formulated including minerals (magnesium, zinc, calcium, selenium, and iron), vitamins (ascorbic acid, pyridoxine HCl, vitamin E, cyanocobalamin, and cholecalciferol), Panax ginseng extract, β-carotene, and cannabidiol isolate. The constituents of the test formulation were divided into two parts; one section was defined as the untreated test formulation, while the other portion of the test formulation and three groups of animals received Biofield Energy Healing Treatment remotely for about 3 minutes by a renowned Biofield Energy Healer, Mr. Mahendra Kumar Trivedi. The level of MPO was reduced by 21.16%, 15.9%, and 11.95% in the G5 (Cecal Slurry, LPS and E. coli along with the Biofield Energy Treated test formulation); G7 (Cecal Slurry, LPS and E. coli along with the Biofield Energy Treated test formulation from day -15); and G8 (Cecal Slurry, LPS and E. coli along with Biofield Energy Treatment per se plus the Biofield Energy Treated test formulation from day -15) groups, respectively as compared to the disease control (G2) group. Moreover, the level of SOD was increased by 30.34% (p≤0.001), 10.30%, and 13.62% in the G5, G6, and G8 group as compared to the untreated test formulation (G4) group. The level of lipid peroxidation (LPO) end product in terms of malondialdehyde (MDA) was significantly reduced by 23.58% (p≤0.001), 17.99% (p≤0.01), and 15.62% (p≤0.001) in the G5, G6, and G7 groups, respectively as compared to the G2 group. The level of TNF-α was decreased by 7.81% in the G5 group as compared to the G2 group. Moreover, the level of IL-6 was decreased by 38%, 40.4%, and 15.35% in the G7, G8, and G9 groups, respectively as compared to the G4 group. Additionally, the level of MIP-2 was reduced by 40.35%, 60.29%, 49.33%, and 42.43% in the G5, G7, G8, and G9 groups, respectively as compared to the G2 group. Overall, the data suggested the antioxidant and anti-inflammatory potentials of the Biofield Energy Treated test formulation and Biofield Energy Treatment per se along with preventive measure on the animal with respect to various inflammatory conditions that might be beneficial various types of systemic inflammatory disorders specially sepsis, trauma, septic shock or any types of injuries. Therefore, the results showed the significant slowdown the inflammation-related disease progression and its complications/symptoms in the preventive Biofield Energy Treatment group per se and/or Biofield Energy Treated Test formulation groups (viz. G6, G7, G8, and G9) comparatively with the disease control group.
Introduction
Systemic inflammatory response syndrome (SIRS) is a complex pathophysiologic defense response of the body to a noxious stressor such as infection, trauma, burns, pancreatitis, surgery, acute inflammation, ischemia or reperfusion, or malignancy or any others injuries [1, 2]. Sepsis is an infection which can consider a systemic inflammatory response. Clinically, the Systemic Inflammatory Response Syndrome (SIRS) is identified by two or more symptoms including fever or hypothermia, tachycardia, tachypnoea and change in blood leucocyte count [3]. Sepsis is a systemic inflammatory response to a confirmed or suspected infection. The development from sepsis to septic shock represents a continuum with increasing mortality. Research in the last two decades explored that the inflammatory process is play a major role in the mechanism of different vital systems pathologies [4]. Several cytokines (TNF-α, TGF-β) and interleukins (IL-1, IL- 4, IL-6, IL-8, and IL-18) are responsible for the development of various inflammatory pathologies of various vital systems such as cardiac, renal, lymphatic, etc [5]. MIP-2 is produced by a variety of cell types, such as macrophages, epithelial cells, monocytes, and hepatocytes, in response to infection or injury. It is regulated by multiple factors like by signalling through Toll-like receptor (TLR) 2, TLR3, and TLR4 in response to diverse pathogens [6], and in response to infections or injury by the activation of p38 mitogen-activated-protein-kinase- dependent signalling pathway [7]. Superoxide dismutase (SODs) is a very important antioxidant enzyme and also acts as a good therapeutic agent against reactive oxygen species-mediated diseases [8]. Proinflammatory cytokines affect nearly all tissues and organ systems. A considerable research has been focused on the role of proinflammatory cytokines, interleukins, and tumor necrosis factor (TNF), in the pathogenesis of sepsis and septic shock associated with congestive heart failure [9]. The cytokine hypothesis has been proposed by scientists based on the idea that the activation of the inflammatory immune system, which specifically involved proinflammatory cytokines release, further stimulates various neurochemical and neuroendocrine changes [10]. Overall, cytokines role has been reported in various types of infections and the growth of malignant tumors, as the immune- stimulants and mediating the inflammatory response in a variety of human diseases [11, 12].
Thus, in order to study the change in intestinal cytokines in presence of Cecal Slurry, LPS and E. coli-induced systemic inflammatory response syndrome model in Sprague Dawley rats, a novel test formulation was designed with the combination of vital minerals (selenium, zinc, iron, calcium, and magnesium), essential vitamins (cyanocobalamin, ascorbic acid, pyridoxine HCl, vitamin E, and cholecalciferol), and nutraceuticals (β-carotene, Ginseng, cannabidiol isolate (CBD)). All the minerals and vitamins used in the test formulation have significant functional role to provide vital physiological roles [13, 14]. Besides, cannabidiol itself has wide range of pharmacological profile and has been reported to role in different disorders [15, 16], while ginseng extract is regarded as the one of the best immune booster for overall immunity [17]. The present study was aimed to evaluate the antioxidant and anti-inflammatory potential of the Biofield Energy Treated Proprietary Test Formulation and Biofield Energy Treatment per se to the animals on Cecal Slurry, LPS and E. coli-induced systemic inflammatory response syndrome model in Sprague Dawley rats.
Biofield Energy Healing Treatment has been reported with significant effects against various disorders, and defined as one of the best Complementary and Alternative Medicine (CAM) treatment approach [18, 19, 20]. National Center for Complementary/Alternative Medicine (NCCAM) recommended CAM with several clinical benefits as compared with the conventional treatment approach [21]. National Centre of Complementary and Integrative Health (NCCIH) accepted Biofield Energy Healing as a CAM health care approach in addition to other therapies such as deep breathing, natural products, Tai Chi, yoga, therapeutic touch, Johrei, Reiki, pranic healing, chiropractic/ osteopathic manipulation, guided imagery, meditation, massage, homeopathy, hypnotherapy, special diets, relaxation techniques, movement therapy, mindfulness, Ayurvedic medicine, traditional Chinese herbs and medicines in biological systems [22, 23]. The Trivedi Effect®- Consciousness Energy Healing was scientifically reported on various disciplines such as nutraceuticals [24], agriculture science [25], cardiac health [26], materials science [27, 28], anti-aging [29], Gut health [30], pharmaceuticals [31], overall human health and wellness. In this study, the authors want to evaluate the effect of the Biofield Energy Treatment (the Trivedi Effect®) on the given novel test formulation and Biofield Energy Treatment per se to the animals on intestinal biomarkers in presence of Cecal Slurry, LPS and E. coli- induced systemic inflammatory response syndrome model in in Sprague Dawley rats using standard ELISA assay.
Material and Methods
Chemicals and Regents
Pyridoxine hydrochloride (vitamin B6), zinc chloride, magnesium (II) gluconate, and β-carotene (retinol, provit A) were purchased from TCI, Japan. Cyanocobalamin (vitamin B12), calcium chloride, vitamin E (Alpha- Tocopherol), cholecalciferol (vitamin D3), iron (II) sulfate, and Carboxymethyl Cellulose Sodium were procured from Sigma-Aldrich, USA. Ascorbic acid (vitamin C) and sodium selenate were obtained from Alfa Aesar, India. Panax ginseng extract and Cannabidiol Isolate were obtained from Panacea Phytoextracts, India and Standard Hemp Company, USA, respectively. Dexamethasone was obtained from Clear synth, India. For the estimation of intestinal antioxidant and inflammatory biomarker panel, such as myeloperoxidase (MPO), superoxide dismutase (SOD), lipid peroxidation (LPO), tumour necrosis factor alpha (TNF-α), interleukin-6 (IL-6), macrophage inflammatory protein-2 (MIP-2) were procured from CUSABIO, USA using specific ELISA kits.
Maintenance of Animal
Randomly breed male Sprague Dawley (SD) rats with body weight ranges from 200 to 300 gm were used in this study. The animals were purchased from M/s. Vivo Bio Tech, Hyderabad, India. Animals were randomly divided into nine groups based on their body weights consist of 10- 12 animals of each group. They were kept individually in sterilized polypropylene cages with stainless steel top grill having provision for holding pellet feed and drinking water bottle fitted with stainless steel sipper tube. The animals were maintained as per standard protocol throughout the experiment.
Consciousness Energy Healing Strategies
Each ingredient of the novel test formulation was divided into two parts. One part of the test compound did not receive any sort of treatment and were defined as the untreated or control sample. The second part of the test formulation was treated with the Trivedi Effect®-Energy of Consciousness Healing Treatment (Biofield Energy Treatment) by a renowned Biofield Energy Healer, Mr. Mahendra Kumar Trivedi under laboratory conditions for ~3 minutes. Besides, three group of animals also received Biofield Energy Healing Treatment (known as the Trivedi Effect®) by Mr. Mahendra Kumar Trivedi under similar laboratory conditions for ~3 minutes. The Biofield Energy Healer was located in the USA; however the test formulation were located in the research laboratory of Dabur Research Foundation, New Delhi, India. The energy transmission/ Blessing (prayer) was given remotely for about 3 minutes via online web-conferencing platform to the test items/animals. After that, the Biofield Energy Treated samples was kept in the similar sealed condition and used as per the study plan. In the same manner, the control test formulation group was subjected to “sham” healer for ~3 minutes treatment, under the same laboratory conditions. The “sham” healer did not have any knowledge about the Biofield Energy Treatment. The Biofield Energy Treated animals were also taken back to experimental room for further proceedings.
Experimental Procedure
Seven days after acclimatization, animals were randomized and grouped based on the body weight. The test formulation was prepared freshly prior to dosing and administered to the animals using an oral intubation needle attached to an appropriately graduated disposable syringe. The dose volume was 10 mL/kg in morning and evening based on body weight. The experimental groups were divided as G1 as normal control (vehicle, 0.5% w/v CMC-Na); G2 as disease control (Cecal Slurry, LPS and E. coli + 0.5% CMC-Na); G3 as reference item (Cecal Slurry, LPS and E. coli + Dexamethasone); G4 includes Cecal Slurry, LPS and E. coli along with untreated test formulation; G5 as Cecal Slurry, LPS and E. coli along with the Biofield Energy Treated test formulation; G6 group includes Cecal Slurry, LPS and E. coli along with Biofield Energy Treatment per se to animals from day -15; G7 as Cecal Slurry, LPS and E. coli along with the Biofield Energy Treated test formulation from day -15; G8 group includes Cecal Slurry, LPS and E. coli along with Biofield Energy Treatment per se plus the Biofield Energy Treated test formulation from day -15, and G9 group denoted Cecal Slurry, LPS and E. coli along with Biofield Energy Treatment per se animals plus the untreated test formulation. Dosing for groups G7 and G8 were started on Day -15 and continued till end of the experiment. However, Group G1 to G5 and G9 animals were dosed with respective formulations from Day 1 and continued till the end of the experiment. Group G6 animals received Biofield Energy Treatment on Day-15 and were not dosed throughout the experimental period. At the end of the experimental period (8 weeks treatment), the animals were sacrifice and intestine were collected, homogenised, and the supernatant subjected for estimation of antioxidants (MPO, SOD, and LPO) and cytokines (TNF alpha, IL-6, MIP-2).
Induction of Systemic Inflammatory Response Syndrome (SIRS) Model
A combination model of sepsis was developed in SD rats by administering Cecal slurry (from donor animals, intraperitoneally, at the dose of 400 mg/kg) in combination with LPS (at the dose of 100 µg/animal) and E. coli [Escherichia coli; 0.2 mL (2M CFU)/animal]). The animals were monitored for various parameters for up to 56 days after disease (SIRS) induction. Ten Donor (~20 weeks old) rats were anesthetized. A midline laparotomy was performed on them and the cecum was extruded. A 0.5 cm incision was made on the anti-mesenteric surface of the cecum, and the cecum was squeezed to expel the feces. The feces from different donor animals was collected and weighed. Immediately after collection, the feces were pooled, diluted 1:3 with 5% dextrose solution and filtered to get a homogeneous suspension. Bacterial viability in the cecal slurry was analyzed. Cecal slurry prepared from donor rats was injected intraperitoneally into experimental rats (G2 to G9) at the dose of 400 mg/kg within 2 hours of preparation. After 3 hours, lipopolysaccharide (LPS) at the dose of 100 µg/animal, and gram-negative viable bacteria such as E. coli [0.2 mL (2M CFU)/animal] were injected, intraperitoneally (G2 to G9).
Preparation of Sample for the Estimation of Antioxidant and Cytokines
With the continued treatment to the respective groups of 8th week of the experimental period, all the animals were sacrificed, intestine were collected, homogenized and subjected for the estimation of antioxidants and cytokines. The tissue from all the groups was stored at -20°C for further estimation. Alternatively, aliquot all the samples and store samples at -20°C or -80°C. Avoid repeated freeze-thaw cycles, which may alter the level of cytokines during final calculations.
Estimation of Antioxidants and Cytokine Levels
The intestine from all the groups was subjected for the estimation of level of antioxidants such as MPO (CSB- E08722r), SOD (706002), and LPO (700870) and cytokines such as TNF-α (CSB-E11987r), IL-6 (CSB-E04640r), and MIP- 2 (CSB-E07419r). All the biomarker panel was estimation using ELISA method as per manufacturer’s recommended standard procedure. This was a quantitative method and the principle was based on the binding of antigen and antibody in sandwich manner assay.
Statistical Analysis
The data were represented as mean ± standard error of mean (SEM) and subjected to statistical analysis using Sigma-Plot statistical software (Version 11.0). For multiple comparison One-way analysis of variance (ANOVA) followed by post-hoc analysis by Dunnett’s test and for between two groups comparison Student’s t-test was performed. The p≤0.05 was considered as statistically significant.
Results and Discussion
Assessment of Antioxidants in Intestinal Homogenate
Estimation of Myeloperoxidase (MPO): Myeloperoxidase (MPO) was estimated in the presence of the test formulation and the data are graphically presented in Figure 1. The data suggested that the disease control (Cecal Slurry, LPS and E. coli + 0.5% CMC-Na) + 0.5% CMC) group (G2) showed value of MPO as 21.41 ± 4.27 ng/mL, which was increased by 14.28% as compared with the normal control (G1, 18.74 ± 4.93 ng/ mL). However, positive control (Dexamethasone) treatment (G3) showed the level of MPO in intestine i.e. 16.72 ± 3.38 ng/mL, which was decreased by 21.92% as compared to the G2 group. The level of MPO in intestine was decreased by 8.05%, 21.16%, 15.9%, and 11.95% in the G4 (Cecal Slurry, LPS and E. coli along with untreated test formulation); G5 (Cecal Slurry, LPS and E. coli along with the Biofield Energy Treated test formulation); G7 (Cecal Slurry, LPS and E. coli along with the Biofield Energy Treated test formulation from day -15); and G8 (Cecal Slurry, LPS and E. coli along with Biofield Energy Treatment per se plus the Biofield Energy Treated test formulation from day -15) groups, respectively as compared to the disease control (G2) group. On the other hand, the level of MPO was reduced by 14.27%, 8.55%, and 4.26% in the G5, G7, and G8 groups, respectively as compared to the untreated test formulation (G4) group. Myeloperoxidase (MPO) is an important enzyme with powerful pro-oxidative and proinflammatory properties and considered as a marker between inflammation processes and oxidative stress [32, 33]. Overall, in this experiment the Biofield Energy Treated test formulation reduced the level of MPO in the intestinal tissues, which could be helpful for the management of oxidative stress and inflammatory conditions.
![Figure 1: The data suggested that the disease control (Cecal Slurry, LPS and _E._ _coli_ + 0.5% CMC-Na) + 0.5% CMC) group (G2) showed value of MPO as 21.41 ± 4.27 ng/mL, which was increased by 14.28% as compared with the normal control (G1, 18.74 ± 4.93 ng/ mL). However, positive control (Dexamethasone) treatment (G3) showed the level of MPO in intestine _i.e._ 16.72 ± 3.38 ng/mL, which was decreased by 21.92% as compared to the G2 group. The level of MPO in intestine was decreased by 8.05%, 21.16%, 15.9%, and 11.95% in the G4 (Cecal Slurry, LPS and _E. coli_ along with untreated test formulation); G5 (Cecal Slurry, LPS and _E. coli_ along with the Biofield Energy Treated test formulation); G7 (Cecal Slurry, LPS and _E. coli_ along with the Biofield Energy Treated test formulation from day -15); and G8 (Cecal Slurry, LPS and _E. coli_ along with Biofield Energy Treatment _per se_ plus the Biofield Energy Treated test formulation from day -15) groups, respectively as compared to the disease control (G2) group. On the other hand, the level of MPO was reduced by 14.27%, 8.55%, and 4.26% in the G5, G7, and G8 groups, respectively as compared to the untreated test formulation (G4) group. Myeloperoxidase (MPO) is an important enzyme with powerful pro-oxidative and proinflammatory properties and considered as a marker between inflammation processes and oxidative stress [32,33]. Overall, in this experiment the Biofield Energy Treated test formulation reduced the level of MPO in the intestinal tissues, which could be helpful for the management of oxidative stress and inflammatory conditions.](/fulltextimages/7517/fig_1.png)
Figure 1: The effect of the test formulation on the level of intestine myeloperoxidase (MPO) in Sprague Dawley rats. G1 as normal control (vehicle, 0.5% w/v CMC-Na); G2 as disease control (Cecal Slurry, LPS and E. coli + 0.5% CMC-Na); G3 as reference item (Cecal Slurry, LPS and E. coli + Dexamethasone); G4 includes Cecal Slurry, LPS and E. coli along with untreated test formulation; G5 as Cecal Slurry, LPS and E. coli along with the Biofield Energy Treated test formulation; G6 group includes Cecal Slurry, LPS and E. coli along with Biofield Energy Treatment per se to animals from day -15; G7 as Cecal Slurry, LPS and E. coli + Biofield Energy Treated test formulation from day -15; G8 group includes Cecal Slurry, LPS and E. coli + Biofield Energy Treatment per se plus the Biofield Energy Treated test formulation from day -15, and G9 group denoted Cecal Slurry, LPS and E. coli along with Biofield Energy Treatment per se animals plus the untreated test formulation. Values are presented as mean ± SEM (n=6-9).
Estimation of Superoxide Dismutase (SOD): The level of intestine superoxide dismutase (SOD) in Sprague Dawley rats after administration of Biofield Treated test formulation and Biofield Energy Healing per se, and the results are graphically presented in the Figure 2.
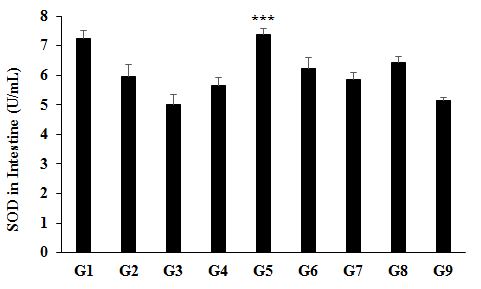
Figure 2: The level of intestine superoxide dismutase (SOD) in Sprague Dawley rats after administration of Biofield Treated test formulation and Biofield Energy Healing per se. G1 as normal control (vehicle, 0.5% w/v CMC-Na); G2 as disease control (Cecal Slurry, LPS and E. coli + 0.5% CMC-Na); G3 as reference item (Cecal Slurry, LPS and E. coli + Dexamethasone); G4 includes Cecal Slurry, LPS and E. coli along with untreated test formulation; G5 as Cecal Slurry, LPS and E. coli along with the Biofield Energy Treated test formulation; G6 group includes Cecal Slurry, LPS and E. coli along with Biofield Energy Treatment per se to animals from day -15; G7 as Cecal Slurry, LPS and E. coli + Biofield Energy Treated test formulation from day -15; G8 group includes Cecal Slurry, LPS and E. coli + Biofield Energy Treatment per se + Biofield Energy Treated test formulation from day -15, and G9 group denoted Cecal Slurry, LPS and E. coli along with Biofield Energy Treatment per se animals plus the untreated test formulation. Values are presented as mean ± SEM (n=6-9). ***p≤0.001 vs. G4.
The disease control (Cecal Slurry, LPS and E. coli + 0.5% CMC-Na) + 0.5% CMC) group (G2) showed value of SOD as 5.97 ± 0.38 U/mL, which was decreased by 17.65% as compared to the normal control group i.e., 7.24 ± 0.26 U/ mL. However, positive control (Dexamethasone) treatment (G3) showed the level of MPO in intestine i.e. 5 ± 0.37 U/ mL. The level of SOD was increased by 23.35%, 4.39%, and 7.53% in the G5 (Cecal Slurry, LPS and E. coli along with the Biofield Energy Treated test formulation); G6 (Cecal Slurry, LPS and E. coli along with Biofield Energy Treatment per se to animals from day -15), and G8 (Cecal Slurry, LPS and E. coli along with Biofield Energy Treatment per se plus the Biofield Energy Treated test formulation from day -15), respectively, as compared to the disease control group (G2). Besides, the level of SOD was reduced by 30.34% (p≤0.001), 10.30%, 3.51%, and 13.62% in the G5, G6, G7, and G8 groups, respectively as compared to the untreated test formulation (G4) group. Several studies have been performed that reveal that the enzyme can serve as an anti-inflammatory agent [34], anti-aging and skin wrinkling [35], and very effective in several animal models such as myocardial ischemia- reperfusion injury, inflammation, and cerebral ischemia- reperfusion injury, etc. [36]. Therefore, in this experiment the Biofield Energy Treated test formulation significantly increased the level of SOD in the intestinal tissues, which could be beneficial in the inflammatory disease conditions. Estimation of Lipid Peroxidation (LPO): The level of lipid peroxidation (LPO) end product in terms of malondialdehyde (MDA) was detected in all the experimental groups and the data are presented in Figure 3. The disease control (Cecal Slurry, LPS and E. coli + 0.5% CMC-Na) group (G2) showed value of MDA as 14.98 ± 0.50 µM. While, the positive control (Dexamethasone) treatment (G3) decreased the level of MDA by 6.96% i.e. 13.94 ± 0.70 µM as compared to the G2 group. The level of MDA was significantly decreased by 14.09% (p≤0.05), 23.58% (p≤0.001), 17.99% (p≤0.01), and 15.62% (p≤0.001) in the G4 (Cecal Slurry, LPS and E. coli along with untreated test formulation); G5 (Cecal Slurry, LPS and E. coli along with the Biofield Energy Treated test formulation); G6 (Cecal Slurry, LPS and E. coli along with Biofield Energy Treatment per se to animals from day -15); and G7 (Cecal Slurry, LPS and E. coli along with the Biofield Energy Treated test formulation from day -15) groups, respectively as compared to the disease control (G2) group. Moreover, the level of MDA was significantly reduced by 11.05%, 4.54%, and 1.78% in the G5, G6, and G7 groups, respectively as compared to the untreated test formulation (G4). Chronic inflammation can induce oxidative/nitrosative stress and lipid peroxidation (LPO), and its produce more reactive oxygen species (ROS), reactive nitrogen species (RNS), and DNA-reactive aldehydes and damaged the DNA in the cells [37]. DNA damage by lipid peroxidation products can leads to cancer [38]. Increased levels of LPO and a decreased level of GSH leads to oxidative stress plays a significant role in pathophysiology of various types of inflammatory bowel diseases (IBD) such as ulcerative colitis (UC) and Crohn’s disease [39]. Overall, here the Biofield Energy Treated test formulation and Biofield Energy Treatment per se significantly reduced the level of lipid peroxidation (LPO) end product in terms of malondialdehyde (MDA), which could be beneficial in the inflammatory symptoms.
![Figure 3: The disease control (Cecal Slurry, LPS and _E. coli_ + 0.5% CMC-Na) group (G2) showed value of MDA as 14.98 ± 0.50 µM. While, the positive control (Dexamethasone) treatment (G3) decreased the level of MDA by 6.96% _i.e._ 13.94 ± 0.70 µM as compared to the G2 group. The level of MDA was significantly decreased by 14.09% (_p_≤0.05), 23.58% (_p_≤0.001), 17.99% (_p_≤0.01), and 15.62% (_p_≤0.001) in the G4 (Cecal Slurry, LPS and _E. coli_ along with untreated test formulation); G5 (Cecal Slurry, LPS and _E. coli_ along with the Biofield Energy Treated test formulation); G6 (Cecal Slurry, LPS and _E. coli_ along with Biofield Energy Treatment _per se_ to animals from day -15); and G7 (Cecal Slurry, LPS and _E. coli_ along with the Biofield Energy Treated test formulation from day -15) groups, respectively as compared to the disease control (G2) group. Moreover, the level of MDA was significantly reduced by 11.05%, 4.54%, and 1.78% in the G5, G6, and G7 groups, respectively as compared to the untreated test formulation (G4). Chronic inflammation can induce oxidative/nitrosative stress and lipid peroxidation (LPO), and its produce more reactive oxygen species (ROS), reactive nitrogen species (RNS), and DNA-reactive aldehydes and damaged the DNA in the cells [37]. DNA damage by lipid peroxidation products can leads to cancer [38]. Increased levels of LPO and a decreased level of GSH leads to oxidative stress plays a significant role in pathophysiology of various types of inflammatory bowel diseases (IBD) such as ulcerative colitis (UC) and Crohn’s disease [39]. Overall, here the Biofield Energy Treated test formulation and Biofield Energy Treatment _per se_ significantly reduced the level of lipid peroxidation (LPO) end product in terms of malondialdehyde (MDA), which could be beneficial in the inflammatory symptoms.](/fulltextimages/7517/fig_3.png)
Figure 3: The level of intestine lipid peroxidation (LPO) in Sprague Dawley rats after administration of Biofield Treated test formulation and Biofield Energy Healing per se. G1 as normal control (vehicle, 0.5% w/v CMC-Na); G2 as disease control (Cecal Slurry, LPS and E. coli + 0.5% CMC-Na); G3 as reference item (Cecal Slurry, LPS and E. coli + Dexamethasone); G4 includes Cecal Slurry, LPS and E. coli along with untreated test formulation; G5 as Cecal Slurry, LPS and E. coli along with the Biofield Energy Treated test formulation; G6 group includes Cecal Slurry, LPS and E. coli along with Biofield Energy Treatment per se to animals from day -15; G7 as Cecal Slurry, LPS and E. coli + Biofield Energy Treated test formulation from day -15; G8 group includes Cecal Slurry, LPS and E. coli + Biofield Energy Treatment per se plus the Biofield Energy Treated test formulation from day -15, and G9 group denoted Cecal Slurry, LPS and E. coli along with Biofield Energy Treatment per se animals plus the untreated test formulation. Values are presented as mean ± SEM (n=6-9). *p≤0.05, p≤0.01, and *p≤0.001 vs. G2.
Assessment of Cytokines in Intestine Homogenate
Estimation of Tumour Necrosis Factor Alpha (TNF-α): Expression of the level of intestine tumour necrosis factor alpha (TNF-α) after administration of Biofield Treated test formulation and Biofield Energy Healing per se to Sprague Dawley rats, and the results are shown in Figure 4. The disease control (Cecal Slurry, LPS and E. coli + 0.5% CMC- Na) group (G2) showed value of TNF-α as 40.39 ± 18.02 pg/ mL, which was increased by 89.94% as compared with the normal control (G1, 21.27 ± 6.90 pg/mL). Further, the positive control (Dexamethasone) treatment (G3) showed decreased TNF-α level by 25.58% i.e., 30.06 ± 4.06 pg/mL as compared to the G2 group. The level of TNF-α was decreased by 7.81% and 2.9% in the G5 (Cecal Slurry, LPS and E. coli along with the Biofield Energy Treated test formulation) and G9 (Cecal Slurry, LPS and E. coli along with Biofield Energy Treatment per se animals plus the untreated test formulation) groups, respectively, as compared to the untreated test formulation group (G2).
TNF-α is a pro-inflammatory cytokines, it mediates and regulates the immune responses and inflammations [40]. TNF-α may also triggering and perpetuation of atherosclerosis. Treatment with biologic agents that inhibits TNF-alpha expression has various clinical benefits in inflammatory diseases such as rheumatoid arthritis (RA) and may be able to reduce cardiovascular risk [41]. Therefore, in this experiment the Biofield Energy Treated test formulation and Biofield Energy Treatment per se reduced the level of TNF-α, which could be beneficial in the inflammatory disease conditions.
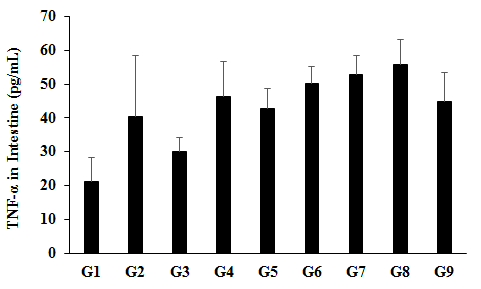
Figure 4: Expression of the level of intestine tumour necrosis factor alpha (TNF-α) after administration of Biofield Treated test formulation and Biofield Energy Healing per se to Sprague Dawley rats. G1 as normal control (vehicle, 0.5% w/v CMC- Na); G2 as disease control (Cecal Slurry, LPS and E. coli + 0.5% CMC-Na); G3 as reference item (Cecal Slurry, LPS and E. coli + Dexamethasone); G4 includes Cecal Slurry, LPS and E. coli along with untreated test formulation; G5 as Cecal Slurry, LPS and E. coli along with the Biofield Energy Treated test formulation; G6 group includes Cecal Slurry, LPS and E. coli along with Biofield Energy Treatment per se to animals from day -15; G7 as Cecal Slurry, LPS and E. coli + Biofield Energy Treated test formulation from day -15; G8 group includes Cecal Slurry, LPS and E. coli + Biofield Energy Treatment per se + Biofield Energy Treated test formulation from day -15, and G9 group denoted Cecal Slurry, LPS and E. coli + Biofield Energy Treatment per se animals plus the untreated test formulation. Values are presented as mean ± SEM (n=6-9).
Estimation of Interleukin-6 (IL-6): Expression the level of intestine interleukin-6 (IL-6) after administration of Biofield Treated test formulation and Biofield Energy Healing to Sprague Dawley rats, and the results are graphically shown in Figure 5. The disease control (Cecal Slurry, LPS and E. coli + 0.5% CMC-Na) group (G2) showed value of IL-6 as 1.96 ± 1.32 pg/mL, which was increased by 62.28% as compared with the normal control (G1, 1.21 ± 0.63 pg/mL). Further, the positive control (Dexamethasone) treatment (G3) showed the level of IL-6 i.e., 3.74 ± 1.29 pg/mL. The level of IL-6 was significantly decreased by 38%, 40.4%, and 15.35% in the G7 (Cecal Slurry, LPS and E. coli along with the Biofield Energy Treated test formulation from day -15); G8 (Cecal Slurry, LPS and E. coli along with Biofield Energy Treatment per se plus the Biofield Energy Treated test formulation from day -15); and G9 (Cecal Slurry, LPS and E. coli along with Biofield Energy Treatment per se animals plus the untreated test formulation groups, respectively, with reference to untreated test formulation group (G4). IL-6 has a dual effect; at some levels it acts as a defence mechanism but in chronic inflammation it is rather proinflammatory. Literature stated that IL-6 can be utilised as a treatment approach effectively for rheumatoid arthritis and other chronic inflammatory diseases [42]. Overall, in this experiment the Biofield Energy Treated test formulation and Biofield Energy Treatment per se significantly reduced the level of IL-6, which could be suppressed inflammatory conditions and simultaneously reduce the risks of inflammatory diseases.
![Figure 5: The disease control (Cecal Slurry, LPS and _E. coli_ + 0.5% CMC-Na) group (G2) showed value of IL-6 as 1.96 ± 1.32 pg/mL, which was increased by 62.28% as compared with the normal control (G1, 1.21 ± 0.63 pg/mL). Further, the positive control (Dexamethasone) treatment (G3) showed the level of IL-6 _i.e.,_ 3.74 ± 1.29 pg/mL. The level of IL-6 was significantly decreased by 38%, 40.4%, and 15.35% in the G7 (Cecal Slurry, LPS and _E. coli_ along with the Biofield Energy Treated test formulation from day -15); G8 (Cecal Slurry, LPS and _E. coli_ along with Biofield Energy Treatment _per se_ plus the Biofield Energy Treated test formulation from day -15); and G9 (Cecal Slurry, LPS and _E. coli_ along with Biofield Energy Treatment _per se_ animals plus the untreated test formulation groups, respectively, with reference to untreated test formulation group (G4). IL-6 has a dual effect; at some levels it acts as a defence mechanism but in chronic inflammation it is rather proinflammatory. Literature stated that IL-6 can be utilised as a treatment approach effectively for rheumatoid arthritis and other chronic inflammatory diseases [42]. Overall, in this experiment the Biofield Energy Treated test formulation and Biofield Energy Treatment _per se_ significantly reduced the level of IL-6, which could be suppressed inflammatory conditions and simultaneously reduce the risks of inflammatory diseases.](/fulltextimages/7517/fig_5.png)
Figure 5: Expression the level of intestine interleukin-6 (IL-6) after administration of Biofield Treated test formulation and Biofield Energy Healing to Sprague Dawley rats. G1 as normal control (vehicle, 0.5% w/v CMC-Na); G2 as disease control (Cecal Slurry, LPS and E. coli + 0.5% CMC-Na); G3 as reference item (Cecal Slurry, LPS and E. coli + Dexamethasone); G4 includes Cecal Slurry, LPS and E. coli along with untreated test formulation; G5 as Cecal Slurry, LPS and E. coli along with the Biofield Energy Treated test formulation; G6 group includes Cecal Slurry, LPS and E. coli along with Biofield Energy Treatment per se to animals from day -15; G7 as Cecal Slurry, LPS and E. coli + Biofield Energy Treated test formulation from day -15; G8 group includes Cecal Slurry, LPS and E. coli + Biofield Energy Treatment per se + Biofield Energy Treated test formulation from day -15, and G9 group denoted Cecal Slurry, LPS and E. coli along with Biofield Energy Treatment per se animals plus the untreated test formulation. Values are presented as mean ± SEM (n=6-9).
Estimation of Macrophage Inflammatory Protein-2 (MIP- 2): The level of intestine macrophage inflammatory protein-2 (MIP-2) was detected in all the experimental groups and the data are presented in Figure 6.
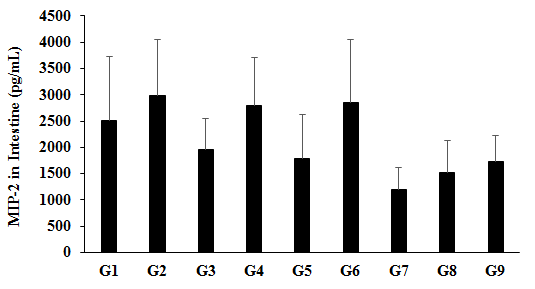
Figure 6: Expression the level of intestine macrophage inflammatory protein-2 (MIP-2) in Sprague Dawley rats after administration of Biofield Treated test formulation and Biofield Energy Healing to the animals per se. G1 as normal control (vehicle, 0.5% w/v CMC-Na); G2 as disease control (Cecal Slurry, LPS and E. coli + 0.5% CMC-Na); G3 as reference item (Cecal Slurry, LPS and E. coli + Dexamethasone); G4 includes Cecal Slurry, LPS and E. coli along with untreated test formulation; G5 as Cecal Slurry, LPS and E. coli along with the Biofield Energy Treated test formulation; G6 group includes Cecal Slurry, LPS and E. coli along with Biofield Energy Treatment per se to animals from day -15; G7 as Cecal Slurry, LPS and E. coli + Biofield Energy Treated test formulation from day -15; G8 group includes Cecal Slurry, LPS and E. coli + Biofield Energy Treatment per se + Biofield Energy Treated test formulation from day -15, and G9 group denoted Cecal Slurry, LPS and E. coli along with Biofield Energy Treatment per se animals plus the untreated test formulation. Values are presented as mean ± SEM (n=6-9).
The disease control (Cecal Slurry, LPS and E. coli + 0.5% CMC-Na) group (G2) showed value of MIP-2 as 2995.08 ± 1051.95 pg/mL, which was increased by 19.71% as compared with the normal control (G1, 2502.03 ± 1233.29 pg/mL). Further, the positive control (Dexamethasone) treatment (G3) showed decreased intestinal MIP-2 level by 34.4% i.e., 1964.87 ± 576.1 pg/mL as compared to the G2 group. The level of MIP-2 was decreased by 6.69%, 40.35%, 4.89%, 60.29%, 49.33%, and 42.43% in the G4 (Cecal Slurry, LPS and E. coli along with untreated test formulation); G5 (Cecal Slurry, LPS and E. coli along with the Biofield Energy Treated test formulation); G6 (Cecal Slurry, LPS and E. coli along with Biofield Energy Treatment per se to animals from day -15); G7 (Cecal Slurry, LPS and E. coli along with the Biofield Energy Treated test formulation from day -15); G8 (Cecal Slurry, LPS and E. coli along with Biofield Energy Treatment per se plus the Biofield Energy Treated test formulation from day -15), and G9 (Cecal Slurry, LPS and E. coli along with Biofield Energy Treatment per se animals plus the untreated test formulation) groups, respectively, as compared to the disease control group (G2). Similarly, MIP-2 level was decreased by 36.07%, 57.44%, 45.70%, and 38.30% in the G5, G7, G8, and G9 groups, correspondingly with reference to untreated test formulation (G4) group. MIP-2 is a chemokine that attract neutrophils released from intestinal epithelial cells in response to inflammatory stimuli such as interleukin 1β [43]. Overall, here the Biofield Energy Treated test formulation and Biofield Energy Treatment per se reduced the level of MIP-2, which could be beneficial for the management of inflammation-related disorders especially in the intestine.
Experiment includes four preventive maintenance groups (G6, G7, G8 and G9). The findings showed the significant slowdown of inflammation-related symptoms and also reduced the chances of disease susceptibility. All- inclusive, it indicate that the Trivedi Effect® was found to be most effective and benefited to protect different kinds of diseases and also improve the overall health and quality of life.
Conclusion
The level of MPO was decreased by 21.16%, 15.9%, and 11.95% in the G5 (Cecal Slurry, LPS and E. coli along with the Biofield Energy Treated test formulation); G7 (Cecal Slurry, LPS and E. coli along with the Biofield Energy Treated test formulation from day -15); and G8 (Cecal Slurry, LPS and E. coli + Biofield Energy Treatment per se + Biofield Energy Treated test formulation from day -15), groups, respectively as compared to the disease control (G2) group. The level of SOD was significantly increased by 30.34% (p≤0.001), 10.30%, and 13.62% in the G5, G6, and G8 groups, respectively as compared to the untreated test formulation (G4) group. The level of MDA was significantly decreased by 23.58% (p≤0.001), 17.99% (p≤0.01), and 15.62% (p≤0.001) in the G5, G6, and G7 groups, respectively with reference to disease control (G2) group. Moreover, the level of TNF-α was reduced by 7.81% in the G5 group as compared to the disease control group (G2). Additionally, IL-6 was significantly decreased by 38%, 40.4%, and 15.35% in the G7, G8, and G9 groups, respectively with reference to G4 group. Further, MIP-2 was decreased by 40.35%, 60.29%, 49.33%, and 42.43% in the G5, G7, G8, and G9 groups, respectively with reference to G2 group. All-inclusive, the Biofield Energy Treated test formulation and Biofield Energy Healing Treatment (the Trivedi Effect®) per se showed significant results with respect to different inflammatory biomarkers (cytokines) in the preventive maintenance group, G6 as well as other preventive maintenance groups (G7, G8, and G9) in Cecal Slurry, LPS and E. coli-induced systemic inflammatory response syndrome model rat model study. It also helped to slowdown the inflammatory disease progression and disease-related complications. The study data showed that Biofield Energy Treated Test formulation and Biofield Energy Treatment per se would be one of the best treatment strategies to prevent the manifestation of diseases. Thus, the Biofield Energy Treatment might act as a preventive maintenance therapy to maintain and improve the overall health and quality of life and simultaneously reduce the severity of acute/chronic diseases. The test formulation can also be used against rheumatoid arthritis (RA), fibromyalgia, aplastic anaemia, Addison disease (AD), multiple sclerosis, myasthenia gravis, psoriasis, Crohn’s disease, ulcerative colitis, dermatitis, hepatitis, Parkinson’s, stroke, etc_._
Acknowledgement
The authors are grateful to Dabur Research Foundation, Trivedi Science, Trivedi Global, Inc., and Trivedi Master Wellness for the assistance and support during the work.
References
-
Chakraborty RK, Burns B (202) Systemic Inflammatory Response Syndrome. In: StatPearls [Internet]. Treasure Island (FL): StatPearls Publishing.
-
Balk RA (2014) Systemic inflammatory response syndrome (SIRS): where did it come from and is it still relevant today? Virulence 5(1): 20-26.
-
Comstedt P, Storgaard M, Lassen AT (2009) The Systemic Inflammatory Response Syndrome (SIRS) in acutely hospitalised medical patients: a cohort study. Scand J Trauma Resusc Emerg Med 17: 67.
-
Szekely Y, Arbel Y (2018) A Review of Interleukin-1 in Heart Disease: Where Do We Stand Today? Cardiol Ther 7(1): 25-44.
-
Mehra VC, Ramgolam VS, Bender JR (2005) Cytokines and cardiovascular disease. J Leukoc Biol 78(4): 805- 818.
-
Rittner HL, Labuz D, Richter JF, Brack A, Schäfer M, et al. (2007) CXCR1/2 ligands induce p38 MAPK-dependent translocation and release of opioid peptides from primary granules _in vitro_ and _in vivo_. Brain Behav Immun 21(8): 1021-1032.
-
De Filippo K, Henderson RB, Laschinger M, Hogg N (2008) Neutrophil chemokines KC and macrophage- inflammatory protein-2 are newly synthesized by tissue macrophages using distinct TLR signalling pathways. J Immunol 180(6): 4308-4315.
-
Younus H (2018) Therapeutic potentials of superoxide dismutase. Int J Health Sci (Qassim) 12(3): 88-93.
-
Dinarello CA, Pomerantz BJ (2001) Proinflammatory cytokines in heart disease. Blood Purif 19(3): 314-321.
-
Raisons CL, Capuron L, Miller AH (2006) Cytokines sing the blues: inflammation and the pathogenesis of depression. Trends Immunol 27(1): 24-31.
-
Zhao X, Fan W, Xu Z, Chen H, He Y, et al. (2016) Inhibiting tumor necrosis factor-alpha diminishes desmoplasia and inflammation to overcome chemoresistance in pancreatic ductal adenocarcinoma. Oncotarget 7(49): 81110-81122.
-
Li Q, Zheng X (2017) Tumor necrosis factor alpha is a promising circulating biomarker for the development of obstructive sleep apnea syndrome: A meta-analysis. Oncotarget 8(16): 27616-27626.
-
Rayman MP (2000) The importance of selenium to human health. Lancet 356(9225): 233-241.
-
Beard JL, Connor JR (2003) Iron status and neural functioning. Ann Rev Nutr 23: 41-58.
-
Peres FF, Lima AC, Hallak JEC, Crippa JA, Silva RH, et al. (2018) Cannabidiol as a Promising Strategy to Treat and Prevent Movement Disorders? Front Pharmacol 9: 482.
-
Nagarkatti P, Pandey R, Rieder SA, Hegde VL, Nagarkatti M (2009) Cannabinoids as novel anti-inflammatory drugs. Future Med Chem 1(7): 1333-1349.
-
Kang S, Min H (2012) Ginseng, the ‘Immunity Boost’: The Effects of _Panax ginseng_ on Immune System. J Ginseng Res 36(4): 354-368.
-
Maizes V, Rakel D, Niemiec C (2009) Integrative medicine and patient-centered care. Explore (NY) 5(5): 277-289.
-
Bischof M, Del Giudice ED (2013) Communication and the emergence of collective behavior in living organisms: A quantum approach. Mol Biol Int 2013: 987549.
-
Cassidy CM (2004) What does it mean to practice an energy medicine? J Altern Complement Med 10(1): 79- 81.
-
Barnes PM, Bloom B, Nahin RL (2008) Complementary and alternative medicine use among adults and children: United States, 2007. Natl Health Stat Report 12: 1-23.
-
Fan K wai (2005) National Center for complementary and alternative medicine website. J Med Libr Assoc 93(3): 410-412.
-
Wisneski L, Anderson L (2009) The Scientific Basis of Integrative Medicine. 2nd (Edn), Boca Raton, FL: CRC Press, pp: 205.
-
Trivedi MK, Branton A, Trivedi D, Jana S (2021) Isotopic abundance ratio analysis of consciousness energy healing treated folic acid. Food Nutr Current Res 4(2): 290-295.
-
Trivedi MK, Branton A, Trivedi D, Nayak G, Mondal SC, et al. (2015) Morphological characterization, quality, yield and DNA fingerprinting of biofield energy treated alphonso mango (_Mangifera indica_ L.). Journal of Food and Nutrition Sciences 3: 245-250.
-
Trivedi MK, Jana S (2019) _In vitro_ assessment of the biofield treated test item on cardiac function using rat cardiomyocytes cell line (H9c2) _via_ multiparametric analysis. Journal of Hypertension and Cardiology 2(4): 1-12.
-
Trivedi MK, Branton A, Trivedi D, Jana S (2021) Effect of consciousness energy healing treatment on the metal profile and properties of tellurium. Eng Technol Open Acc 3(5): 555623.
-
Trivedi MK, Branton A, Trivedi D, Jana S (2021) Consciousness energy healing treatment impacted the isotopic abundance ratio of 6-Mercaptopurine (6-MP). Nov Appro Drug Des Dev 5(5): 555673.
-
Trivedi MK, Jana S (2021) Anti-aging activity of biofield energy treated novel proprietary test formulation by assessment of vital biomarkers in cerebrospinal fluid (CSF) in Sprague Dawley rats. On J Neur & Br Disord 5(2): 1-210.
-
Trivedi MK, Jana S (2021) Evaluation of biofield energy healing treatment based proprietary test formulation on gut health potential in colon cancer cell line (HT-29). J Pharmacol Clin Res 8(4): 555743.
-
Trivedi MK, Branton A, Trivedi D, Jana S (2021) The consciousness energy healing treatment and its impact on the isotopic abundance ratio analysis of flutamide. Drug Des Int Prop Int J 3(5): 1-175.
-
Pokorska J, Poskart K, Kułaj D, Ochrem A, Dusza M, et al. (2017) Effect of g.9476869G>A myeloperoxidase (MPO) gene polymorphism on the antioxidant activity of milk from Polish Holstein-Friesian cows of the Black-and- White variety (HO). J Dairy Res 84(2): 159-164.
-
Loria V, Dato I, Graziani F, Biasucci LM (2008) Myeloperoxidase: A new biomarker of inflammation in ischemic heart disease and acute coronary syndromes. Mediators Inflamm 2008: 135625.
-
Yasui K, Baba A (2006) Therapeutic potential of superoxide dismutase (SOD) for resolution of inflammation. Inflamm Res 55(9): 359-363.
-
Corvo ML, Jorge JCS, van’t Hof R, Cruz MEM, Crommelin DJA, et al. (2002) Superoxide dismutase entrapped in long-circulating liposomes: formulation design and therapeutic activity in rat adjuvant arthritis. Biochim Biophys Acta 1564(1): 227-236.
-
Salvemini D, Riley DP (2000) Nonpeptidyl mimetics of superoxide dismutase in clinical therapies for diseases. Cell Mol Life Sci 57(11): 1489-1492.
-
Bartsch H, Nair J (2006) Chronic inflammation and oxidative stress in the genesis and perpetuation of cacer: role of lipid peroxidation, DNA damage, and repair. Langenbecks Arch Surg 391(5): 499-510.
-
Gentile F, Arcaro A, Pizzimenti S, Daga M, Cetrangolo GP, et al. (2017) DNA damage by lipid peroxidation products: implications in cancer, inflammation and autoimmunity. AIMS Genet 4(2): 103-137.
-
Rana SV, Sharma S, Prasad KK, Sinha SK, Singh K (2014) Role of oxidative stress and antioxidant defence in ulcerative colitis patients from north India. Indian J Med Res 139(4): 568-571.
-
Sarzi-Puttini P, Atzeni F, Doria A, Iaccarino L, Turiel M (2005) Tumor necrosis factor-alpha, biologic agents and cardiovascular risk. Lupus 14(9): 780-784.
-
Schumacher SM, Prasad NSV (2018) Tumor Necrosis Factor-α in heart failure: An updated review. Curr Cardiol Rep 20(11): 117.
-
Gabay C (2006) Interleukin-6 and chronic inflammation. Arthritis Res Ther Suppl 2(2): S3.
-
Ohtsuka Y, Lee J, Stamm DS, Sanderson IR (2001) MIP- 2 secreted by epithelial cells increases neutrophil and lymphocyte recruitment in the mouse intestine. Gut 49(4): 526-533.
- Management of Gallbladder Perforations: A Review
- From The Mouth to the Gut: The Oral Microbiome's Role in Promoting Gastrointestinal Disease
- Case Report: Intraductal Papillary Mucinous Neoplasm (IPMN) Complicated by Portal Vein Plaquing and Biliary Obstruction Mimicking Pancreatic Metastatic Malignancy
- Management of Non-Cirrhotic Portal Hypertension during Pregnancy: A Review
- Effectiveness of Omeprazole versus Pantoprazole for Symptomatic Relief of Gastro-Esophageal Reflux Disease (GERD)/ Acid Peptic Disease (APD): A Real-World Evidence (RWE) Study
- Case of Splenic Infarction; A Rare Presentation of Complicated Enteric Fever in a Pediatric Patient