Altered Cell Survival Signaling in the Cerebral Cortex as a Long Term Effect of Neonatal Hypoglycemia
<p>Neonatal hypoglycemia can cause drastic alterations in brain function by damaging areas like cortex, hypothalamus and cerebellum. We evaluated the extend of cell damage caused by severe neonatal hypoglycemia by TOPRO- 3 imaging which revealed that cerebral cortical cells are significantly affected by neonatal hypoglycemic shock. The evaluation of signaling molecules Creb, BDNF, Akt-1 and NFkB gene expression by Real Time PCR analysis revealed a possible explanation for this cellular damage. The expression studies showed that Creb, BDNF, Akt-1 and NFkB was decreased in hypoglycemic group suggesting that the cell survival signaling cascade in the cerebral cortex region of hypoglycemic group is highly compromised. The reduced expression of cell survival factors coupled with the significant loss of cell in the cortical region indicates that an early life stress can significantly affect the normal cell signaling cascade, thereby resulting in serious consequences.</p>
Introduction
Glucose is the major source of energy for organ function. Although all organs can use glucose, the human brain uses it almost exclusively as a substrate for energy metabolism. Because cerebral glycogen stores are limited, maintenance of adequate glucose delivery to the brain is an essential physiologic function. The high brain-to bodyweight ratio in the newborn results in a proportionately higher demand for glucose compared with the capacity for glucose production than that encountered in the adult, with cerebral glucose use accounting for as much as 90% of total glucose consumption. Although alternate fuels, such as lactate and ketone bodies, can be used as a substrate for energy production, the newborn’s immature counter regulatory response limits the availability of these molecules. Thus, newborns are extremely susceptible to any condition that impairs the establishment of normal glucose homeostasis during the transition from intrauterine to independent extrauterine life. Recurrent episodes of hypoglycemia were strongly correlated with persistent neurodevelopment and physical growth deficits until 5 years of age. Recurrent hypoglycemia was a factor for long-term effects. Hence it is important to understand the long term consequences of neonatal hypoglycaemia.
Severe hypoglycemia causes selective neuronal damage to certain brain regions—such as the outer layers of the cortex, the striatum, the medial CA1 region, and the crest of the dentate gyrus [1]. The differential activation of an internal death process in vulnerable neurons has been proposed as a mechanism to explain the selective death of neurons. However, it is equally likely that specific neuronal populations contain an intrinsic survival mechanism [2]. Hypoglycemic neuronal death is not a direct result of energy failure, but is instead a process consisting of multiple events. The transcription factor, cyclic adenosine monophosphate response element binding protein (CREB), is a regulator of a general survival program in neurons [3]. Transcription of BDNF (brain- derived neurotrophic factor) mRNA is shown to be activated by phosphorylation of CREB or a closely related protein in a Ca2+-dependent manner [4]. The pathway leading to the activation of phosphoinositide 3-kinase (PI 3-kinase) and its downstream effector the serine/threonine kinase Akt by growth factor receptors has emerged as the major mechanism by which growth factors promote cell survival [5]. Upon activation, PI 3- kinase phosphorylates membrane phosphoinositides which act as second messengers that mediate the diverse cellular functions of PI 3-kinase [6]. One function of these second messengers is the activation of Akt. Akt is an important mediator of biological functions of insulin [7]. Also, Akt is critical for cell survival triggered by growth factors, extracellular matrix, and other stimuli. Akt appears to positively regulate the prosurvival transcription factors NF-κB, which is involved in the regulation of cell proliferation, apoptosis, and survival by a wide range of cytokines and growth factors [8]. NF-κB mediated activation of antiapoptotic _Bcl_2 was reported in hypoglycemia group [9]. Considering the importance of these transcription factors in cell survival and glycemic control, it is important to understand its role in determining the long term effects of neonatal hypoglycemic condition. The present study focused on establishing the molecular mechanism behind the suspectibility of cerebral cortex towards neonatal hypoglycemic insult by studying the expression of survival factors – creb, BDNF, Akt and NF- κB. The histological analysis using TOPRO- 3 nuclear staining was done to establish the severity of cerebral cortical damage.
Materials and Methods
Animals
Wistar neonatal (postnatal, P7, n=4-6) rats weighing 10.0–12.0 g were used for all experiments. All groups of neonatal rats were maintained with their dams under optimal conditions—12 h light and 12 h dark periods and were fed standard food and water ad libitum. All animal care procedures were in accordance with Institutional, Committee for the Purpose of Control and Supervision of Experiments on Animals (CPCSEA) and National Institute of Health guidelines.
Biochemicals
Biochemicals used in the present study were purchased from Sigma Chemical Co., St. Louis, USA. All other reagents of analytical grade were purchased locally. Tri-reagent kit was purchased from MRC, USA. Real Time PCR Taqman probe assays on demand were from Applied Biosystems, Foster City, CA, USA.
Induction of Hypoglycemia in Neonatal Rats
Wistar neonatal rats used for the experiments were grouped into two as follows: (i) control (C) - Control rats were injected with saline, subcutaneously for ten days starting from P7; (ii) Hypoglycemic (H) - Hypoglycemic rats received human regular insulin (Actrapid) at a dosage of 10 IU/kg body weight/day subcutaneously and fasted for 240 min in the presence of foster mother (Thomas, et al. 2013). The animals were injected once daily for 10 days from postnatal day 7 to 17 (Table 1). The target blood glucose was <40 mg/dL, a value conventionally used to define hypoglycemia in newborn infants. After confirmation of euglycemia (blood glucose >50 mg/dL) and normal activity, neonatal rats were reunited with their dams. All the experimental rats were maintained at optimum conditions for one month to study the effect of neonatal hypoglycemia on one month old rats. Control and experimental neonatal rats were sacrificed by cervical dislocation. The cerebral cortex was dissected out quickly over ice according to the procedure of Glowinski and Iversen, 1996 and was stored at -80°C for various experiments [10].
Estimation of Blood Glucose Concentration
Blood glucose was estimated on P7, P9, P11, P13, P15 and P17 rats in control (after saline injection) and hypoglycemic rats (after hypoglycemic injection). Blood glucose was estimated using a blood glucose meter (Accu-Chek® Compact, Roche Diagnostics, Indianapolis, IN) by photometric end-point detection with a measuring range of 0.6 mmol/L – 33.3 mmol/L and the results were expressed in mg/dl of blood.
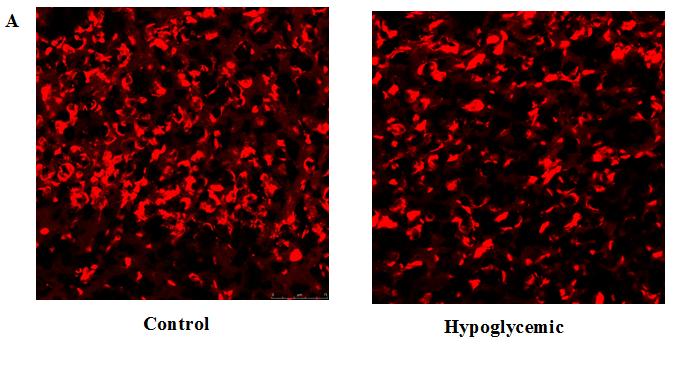
Histochemical Analysis Using TOPRO- 3
One month old rats exposed to neonatal hypoglycemia and control rats were anesthetized with urethane (0.75 mg / Kg body weight intraperitoneal) and transcardially perfused with Phosphate Buffer Saline (PBS) (pH- 7.4) followed by 4% paraformaldehyde in PBS. After perfusion the brain was dissected out and fixed in 4% paraformaldehyde for 1 hr and then equilibrated with 30% sucrose solution in PBS (0.1 M). 10 µm sagittal sections of cerebral cortex were taken using Cryostat (Leica, CM1510 S). Nuclear stain TOPRO- 3 (diluted 1: 1000 in PBS) was added and kept for 10 minutes at room temperature. The sections were observed and photographed using confocal imaging system (Leica TCS SP 5).
Gene Expression Studies of Signaling Molecules Creb, BDNF, NFkB and Akt-1
RNA was isolated from brainstem using Tri reagent. Total cDNA synthesis was performed using ABI PRISM cDNA Archive kit. Real–Time PCR assays were performed in 96-well plates in an ABI 7300 Real–Time PCR instrument (Applied Biosystems, Foster City, CA, USA). PCR analyses were conducted with gene-specific primers and fluorescently labeled Taq probe for Creb, NFkB, IGF and TNF-α designed by Applied Biosystems. Endogenous control (β-actin) labeled with a reporter dye was used as internal control. All reagents were purchased from Applied Biosystems. The real-time data were analyzed with Sequence Detection Systems software version 1.7. All reactions were performed in duplicate. The ΔΔCT method of relative quantification was used to determine the fold change in expression. This was done by first normalizing the resulting threshold cycle (CT) values of the target mRNAs to the CT values of the internal control β- actin in the same samples (ΔCT = CTTarget – CT β- actin). It was further normalized with the control (ΔΔCT = ΔCT – CTControl). The fold change in expression was then obtained (log of relative).
Statistical Analysis
Student's t test was performed for pair wise comparison of control and hypoglycemic group. In in vitro experiments, the equality of the groups was tested by the analysis of variance (ANOVA) technique for different values of p. Further the pair wise comparisons
of all the experimental groups were studied using Students-Newman-Keuls test at different significance levels. The testing was performed using GraphPad Instat (Ver. 2.04a, San Diego, USA) computer program.
Results
Determination of body weight and blood glucose concentration
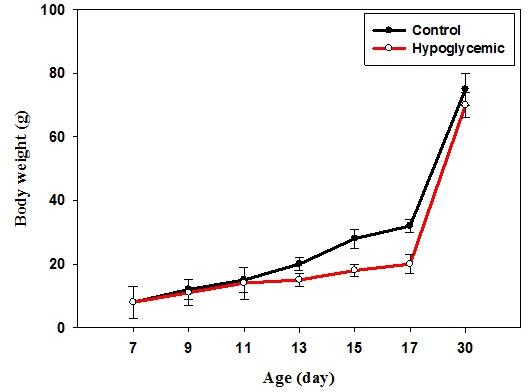
The body weight of control rats showed a significant increase (p<0.001) from P7 to P17, which indicates the normal growth pattern. In hypoglycemic group, a significant decrease (p<0.05) in body weight was observed in P13 to P17 (Figure 1).
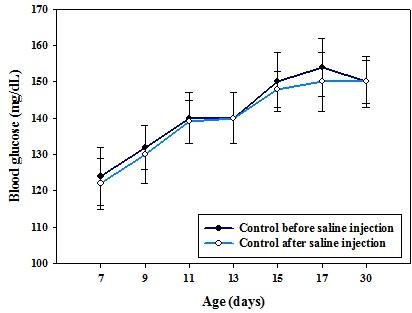
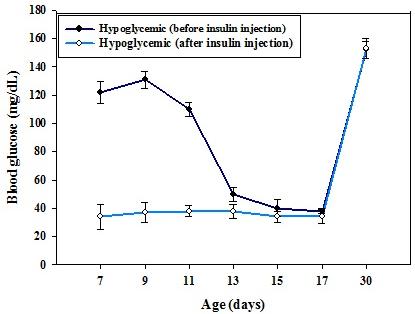
Figure 1: Body weight (g) of control and hypoglycemic groups. Values are mean ± S.E.M. of 4–6 separate experiments. Each group consists of 4–6 rats. In control rats, the blood glucose level from P7 to P17 varies significantly which is in accordance with the usual glucose level variation observed during the initial post natal period. In hypoglycemic group, the glucose concentration remained <40 mg/dL from P7 to P17 after insulin injection even though hypoglycemia was reached by P13 (Figure 2).
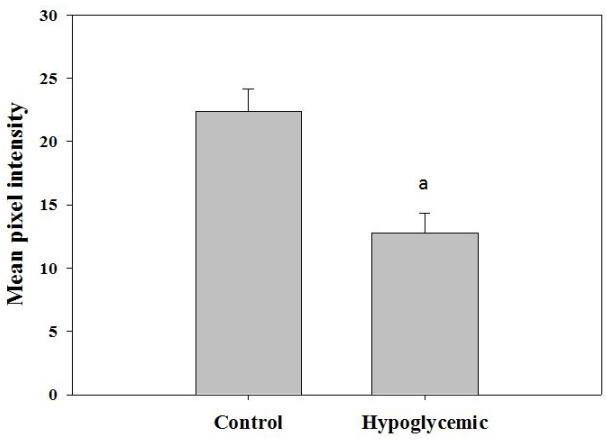
TOPRO-3 staining showed significant decrease in the nuclear staining in the hypoglycemic rats. This indicates the neuronal loss in the cerebral cortex (Figure 3).
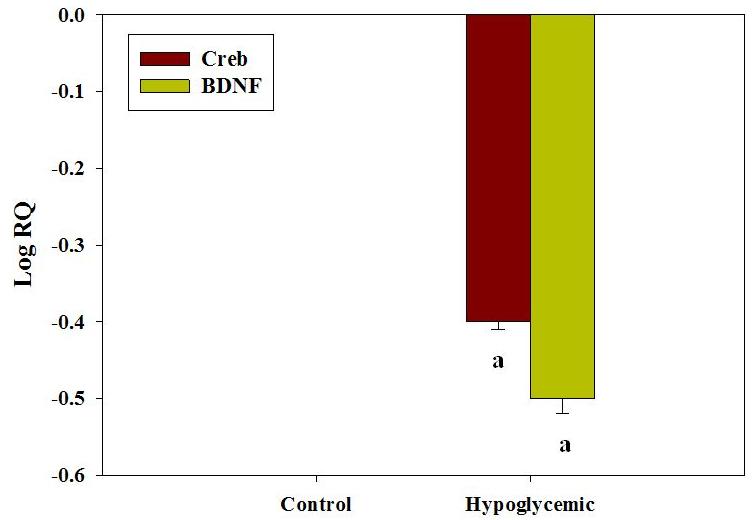
Real Time PCR Analysis of Gene Expression of Creb and BDNF
The gene expression of Creb showed a significant down regulation (p<0.01) in the cerebral cortex of one month old rats exposed to neonatal hypoglycemia compared to control (Figure 4). BDNF expression was also significantly down regulated (p<0.01) in the cerebral cortex of one month old rats exposed to neonatal hypoglycemia (Figure 4). Transcription of BDNF mRNA is required for the activation of CREB. The reduction in the expression of both the transcription factors can significantly affect the neuronal survival pathways in the cerebral cortex.
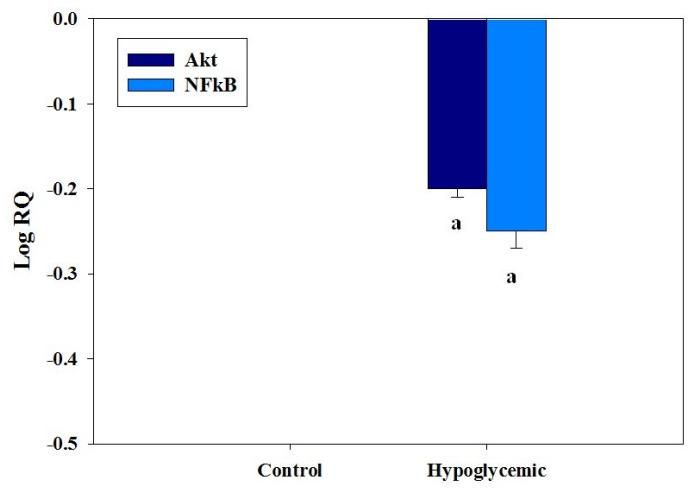
Real Time PCR analysis of gene expression of Akt-1 and NF-κB
The gene expression of Akt-1 showed a significant down regulation (p<0.001) in hypoglycemic group compared to control (Figure 5). The downstream target molecule of Akt expression - NF-κB - was significantly down regulated (p<0.001) in the hypoglycemic condition compared to control (Figure 5). The alteration of cell survival pathways might have contributed to the vulnerability of cerebral cortex region to neonatal hypoglycemic insult and its long term complications.
Discussion
One of the major concerns regarding neonatal hypoglycaemia is the severity of brain damage elicited by the stress even after restoring the glycemic condition. Since glucose is the primary energy source for brain cells, its deprivation has drastic effects, especially during critical developmental stages. We observed a significant decrease in the body weight in hypoglycemic rats from postnatal day 13 onwards when compared to control, which might have contributed by a an overall inbalance in the metabolism. In the present study, the control rats sowed the normal pattern of blood glucose level during development from postnatal day 7 to one month old [11]. In hypoglycemic rats, the blood glucose level reached hypoglycemic range on postnatal day 13 and after which the rats showed severe hypoglycemic condition. Acute hypoglycemia is associated with neuronal injury in the mature human and rodent brains [12]. Extensive neuronal injury in the cerebral cortex, hippocampus and striatum is seen in adult rats after profound hypoglycaemia Neuronal injury has also been demonstrated in the cerebral cortex of adult rats subjected to 75 min of hypoglycemia of moderate severity [12, 13]. Degenerating neurons have been demonstrated in the cerebral cortex of developing rats subjected to acute hypoglycemia on postnatal day 25 [14]. Apoptotic cell injury in the hippocampus and striatum has been demonstrated in developing mice subjected to acute hypoglycemia of 4 hr duration [15]. In the present study, the histological analysis of cerebral cortical sections revealed the extend of cellular damage due to this stressful condition. Along with the activation of cell death pathways and oxidative damage; there might be a possible role for the cell survival factors too for this extensive damage [11]. Our study revealed a decreased gene expression of Creb and BDNF in the cerebral cortex. Creb is a regulator of a general survival program in neurons and its phosphorylation at Ser133 is critical for transcription activation [3]. Since the transcription of BDNF mRNA can be activated by phosphorylation of CREB, the down regulation of BDNF mRNA along with creb gene expression in the present study suggested that the creb mediated survival pathways are affected by neonatal hypoglycemic insult [4]. We also observed that under hypoglycemic condition, the gene expression of AKT-1 in the cerebral cortex was down regulated along with a decreased mRNA expression of its down steam target molecule NF-κB. The possible explanation for this observation is the response of cortical region against the hypoglycemic condition. Various reports suggested the impaired activation of Akt resulting in insulin-resistance in diabetic condition where as another line of evidence suggests defects down-stream from Akt, despite normal Akt activation [16, 17]. NF-κB is a major regulator of cellular apoptosis through its ability to control the expression of multiple antiapoptotic genes. Blockade of NF-κB sensitizes the cells to TNF-α dependent apoptotic death. Thus the down regulation of Akt- NF-κB expression might have decline the cell survival signaling in cerebral cortex region. The present study was focused on understanding the molecular mechanism behind the vulnerability of cerebral cortex sections towards neonatal hypoglycemic insult. BDNF binds to various receptors in the cell surface and triggers the activation of many signalling pathways via Akt, NFƙB etc, which ultimately lead to the phosphorylation and activation of the transcription factor CREB that mediates transcription of genes essential for the survival and differentiation of neurons. The findings from the present study points that this cell signalling cascade in the cerebral cortex is altered which ultimately resulted in severe cell loss in the cerebral cortex (Figure 6).
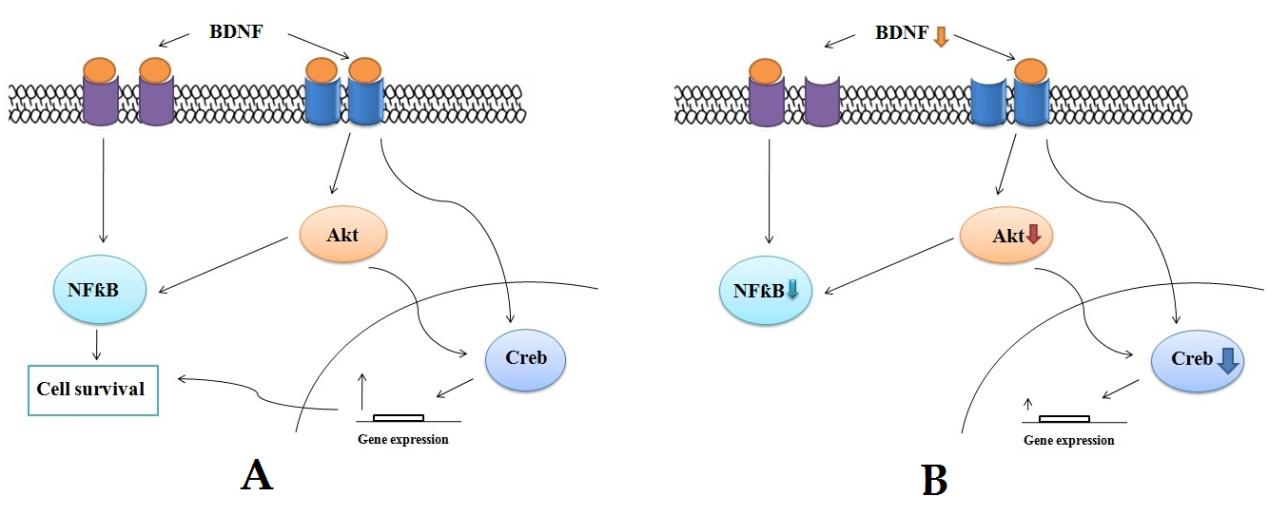
Taken together, the current findings suggested that after neonatal hypoglycemia, the neuroprotective signaling factors like Creb, BDNF, Akt-1, NF-κB showed a significant reduction in its expression, which in turn can lead to a marked cellular damage and associated long term effects of neonatal hypoglycemia.
Acknowledgement
Prof. K. P. Joy thanks INSA for INSA Senior Scientist position and the authors thank Cochin University of Science and Technology, Cochin for all infrastructural facilities for the research work. Dr. Anju T R acknowledges DBT, Govt. of India for financial support (DBT- RA) and Athreya Research Foundation for supporting the manuscript preparation with necessary infrastructural facilities.
References
-
Auer RN, Siesjö BK (1993) Hypoglycemia: brain neurochemistry and neuropathology. Baillieres Clin Endocrinol Metab 7(3): 611-625.
-
Walton MR, Dragunow I (2000) Is CREB a key to neuronal survival? Trends Neurosci 23(2): 48-53.
-
Hu BR, Fux CM, Martone ME, Zivin JA, Ellisman MH (1999) Persistent phosphorylation of cyclic AMP responsive element-binding protein and activating transcription factor-2 transcription factors following transient cerebral ischemia in rat brain. Neuroscience 89(2): 437-452.
-
Tao X, Finkbeiner S, Arnold DB, Shaywitz AJ, Greenberg ME. (1998) Ca2+ influx regulates _BDNF_ transcription by a CREB family transcription factor-dependent mechanism. Neuron 20(4): 709-726.
-
Marte BM, Downward J (1997) PKB/Akt: connecting phosphoinositide 3-kinase to cell survival and beyond. Trends Biochem Sci 22(9): 355-358.
-
Fruman DA, Meyers RE, Cantley LC (1998) Phosphoinositide kinases. Annu Rev Biochem 67: 481–507.
-
Calera MR, Martinez C, Liu H, Jack AK, Birnbaum MJ, et al. (1998) Insulin increases the association of Akt-2 with Glut4-containing vesicles. J Biol Chem 273(13): 7201-7204.
-
Orlowski RZ, Baldwin AS Jr (2002) NF-κB as a therapeutic target in cancer. Trends Mol Med 8(8): 385-389.
-
Tamatani M, Che YH, Matsuzaki H, Ogawa S, Okado H, et al. (1999) Tumor necrosis factor induces Bcl-2 and Bcl-x expression through NFkappaB activation in primary hippocampal neurons. J Biol Chem 274(13): 8531-8538.
-
Glowinski J, Iversen LL (1966) Regional studies of catecholamines in the rat brain: The disposition of [3H] Norepinephrine, [3H] DOPA in various regions of the brain. J Neurochem 13(8): 655-669.
-
Anju TR, Akhilraj PR, Paulose CS (2016) Oxidative stress and cell death in the cerebral cortex as a long term consequence of neonatal hypoglycemia. Can J Physiol Pharmacol 94(9): 1015-1022.
-
Tkacs NC, Pan Y, Raghupathi R, Dunn-Meynell AA, Levin BE (2005) Cortical Fluoro-Jade staining and blunted adrenomedullary response to hypoglycemia after noncoma hypoglycemia in rats. J Cereb Blood Flow Metab 25(12): 1645-1655.
-
Suh SW, Gum ET, Hamby AM, Chan PH, Swanson RA (2007) Hypoglycemic neuronal death is triggered by glucose reperfusion and activation of neuronal NADPH oxidase. J Clin Invest 117(4): 910-918.
-
Yamada KA, Rensing N, Thio LL (2005) Ketogenic diet reduces hypoglycemia-induced neuronal death in young rats. Neurosci Lett 385(3): 210-214.
-
Kim M, Yu ZX, Fredholm BB, Rivkees SA (2005) Susceptibility of the developing brain to acute hypoglycemia involving A1 adenosine receptor activation. Am J Physiol Endocrinol Metab 289(4): E562-E569.
-
Rondinone CM, Carvalho E, Wesslau C, Smith UP (1999) Impaired glucose transport and protein kinase B activation by insulin, but not okadaic acid, in adipocytes from subjects with Type II diabetes mellitus. Diabetologia 42(7): 819-825.
-
Ogihara T, Asano T, Ando K, Sakoda H, Anai M, et al. (2002) High-salt diet enhances insulin signaling and induces insulin resistance in Dahl salt-sensitive rats. Hypertension. 40(1): 83-89.
- Superposition of Cryo-EM and AlphaFold Predictions of Dengue Antigen-Antibody Complexes
- Jugular-Applied Coherent Low-Level Laser Therapy Enhances Systemic Mitochondrial Metabolic Function and Antioxidant Response
- Role of OMC32 Polypeptide in Acrosin-Mediated Exocytosis during the Bovine Sperm Acrosome Reaction
- Association of Galectin-3 but not Laminin in Tamoxifen-Induced Growth Suppression in Breast Cancer MCF-7 Cells
- Effect of Different Wavelengths of Light on the Rate of Photosynthesis
- Nutritional, Therapeutic, and Environmental Effect of Oyster Mushrooms: An Editorial