Studies on Diagnostic Indicators of Overweight and Obesity in Teenager School Children
Introduction: The high prevalence of overweight and obesity among the children and adolescents and negative consequences due to this factor dictate the necessity of introduction of mass index evaluation to detect deviations early and develop measures of prevention it. Objective of the Study: The main aim of the study was to study the diagnostic indicators of overweight and obesity in schoolchildren of the Novosibirsk region of different age and sex groups using methods of body mass index (BMI) and body component composition by bioimpedance analysis (BIM). Materials and Methods: Materials of this study were the results of experimental research conducted on the basis of Novosibirsk Research Institute of Hygiene in accordance with the program of monitoring of nutrition and health of schoolchildren, carried out according to the national project "Demography". The hygienic, clinical-diagnostic, analytical and statistical methods of research were used. BMI and bioimpedance results were used to assess and indicate excess of body weight and obesity. The data were presented as M±m, where M is the sample mean, m is the standard error of the average. The level of statistical significance p was assumed to be 0.05. Results of the Study: Comparative analysis of the prevalence of obesity by BMI revealed significantly (p≤0,05) higher rates in the whole observation cohort compared to the assessment by bioimpedance measurement. It have been revealed gender differences: young males showed higher indices of obesity according to the WHO standards (6,6 times higher in the 12-14 age group and 2,5 times higher in the 15-16 age group). Girls, in contrast, showed higher indices estimated by bioimpedance spectrometry (in the 12-14 age group – by 71,7%, in the 15-16 age group - by 17,2%). Bioimpedancemetry revealed statistically significantly higher values of water content, intracellular and extracellular fluid, fat mass and percentage of fat in children with obesity compared with peers with normal body weight. Higher values of BIM indicators were found in boys for almost all studied parameters, except for fat mass, which was statistically significantly higher in girls. Conclusions: The found significant and multidirectional differences in assessing the prevalence of obesity in children 12-16 years old using two methods indicated the low information significance of the body mass index parameter in comparison with bioimpedance analysis. The last one is also showed the excess of water content and percentage of fat in the body composition in children with obesity compared to peers with normal body weight. These findings are necessary to consider when developing targeted interventions to prevent obesity bioimpedancemetry.
Introduction
Currently, the high prevalence of overweight and obesity among the population is global in nature and is one of the important problems in modern medicine [1, 2, 3, 4, 5, 6]. Serious negative health consequences expressed in the development of complications associated with obesity-related diseases are characteristic of both adult and pediatric populations [7, 8, 9, 10]. This necessitates a serious approach to the diagnosis of excess body weight for the early detection of obesity. In pediatric practice, the method of body mass index (BMI) estimation recommended by WHO is widely used for this purpose [11].
Our earlier studies on the comparative evaluation of methods for the indication of excess body weight in schoolchildren aged 12-17 years have shown [12] that with the greater informativeness of bioimpedance analysis compared with the assessment of body mass index (BMI) according to the method recommended by WHO, this method in population studies is quite informative and is widely used by many researchers [3, 13, 14]. However, in recent years, studies have shown the low diagnostic value of this indication method in the evaluation of obesity [15, 16, 17, 18]. The method of bioimpedance analysis, which provides an opportunity to study the structural components of the body, is more widely used for these purposes. The method provides a comprehensive assessment of the content of water, minerals, intracellular and extracellular fluid, protein in muscles, fat- free and fat mass, and skeletal muscle [15, 16, 19, 20]. The relevance of such studies is due to the high prevalence of obesity in the adult and pediatric population of the country. Recent studies have revealed that between 1993 and 2017, the prevalence of obesity in the adult population increased 2.6-fold (from 10.8% to 27.9%) among men and 1.2-fold (from 26.4 to 31.8%) among women, who have higher prevalence rates than men. However, there are regional peculiarities: for example, while the prevalence of obesity in the Novosibirsk region is minimal compared to the all-Russian indicators, its maximum level was found in women (47.0%), while in the Ivanovo and Voronezh regions the maximum level of obesity was observed among men (30.0%) [21, 22]. High rates with the presence of regional peculiarities are registered among the child and adolescent population [23, 24, 25, 26]. This was the basis for the present study.
Objective of the Study
The main aim of the study was to study the diagnostic indicators of overweight and obesity in schoolchildren of the Novosibirsk region of different age and sex groups using methods of BMI and body component composition by bioimpedance analysis.
Materials and Methods
The materials of the study were the results of the experimental research conducted on the basis of Novosibirsk Research Institute of Hygiene in accordance with the program of monitoring of nutrition and health of schoolchildren, carried out within the framework of the national project “Demography “1. Hygienic, clinical-diagnostic, analytical and statistical methods of research were used in the course of the work. Body mass index (BMI)2 and the results of bioimpedancemetry were used to assess and indicate overweight and obesity. Using verified equipment (medical scales and a stadiometer) in medical rooms of general education organizations, body weight and length of children were measured. The assessment of body component composition (indicators of fat and muscle tissues, visceral deposits, water and bone mass) was carried out using certified clinical diagnostic equipment of the Novosibirsk Research Institute of Hygiene - the Inbody 770 device. The study involved 813 Novosibirsk schoolchildren 12-16 years old (411 boys and 402 girls), including 603 students of 12-14 years old (300 boys and 303 girls) and 210 students of 15-16 years old (111 boys and 99 girls). Informed parental consent for the research was obtained for all children in advance.
According to current federal clinical guidelines (as well as WHO recommendations), obesity in children and adolescents from 0 to 19 years of age was defined as a BMI equal to or greater than +2.0 SDS BMI, and overweight, in turn, from +1.0 to +2.0 SDS BMI. Normal body weight is within 1.0 SDS BMI [2, 11]. Parametric methods were used in statistical analysis, since the obtained data had normal distribution. Data are presented as M±m, where M is the sample mean, m is the standard error of the mean. The level of statistical significance p was taken as 0.05.The results of the study were reviewed and approved by the local ethical committee of the Novosibirsk Research Institute of Hygiene (protocol # 19 of 13.05.2022).
Results
Analysis of the prevalence of overweight obtained by bioimpedanceometry and BMI revealed no statistically significant differences in any of the compared groups, taking into account gender and age (p≥0.05). At the same time, a comparative analysis of the prevalence of obesity by BMI revealed statistically significantly (p≤0.05) higher rates in the entire cohort, as well as in the 12-14 and 15-16 age groups compared with the bioimpedance assessment (Table 1).
| Age groups, years | BMI* (M±m) | BIM(M±m)** | p |
|---|---|---|---|
| 12-14 | 1,50±0,10 | 1,00±0,07 | ≤0,05 |
| 15-16 | 5,18±0,36 | 4,45±0,31 | ≤0,05 |
| Total | 3,34±0,17 | 2,73±0,14 | ≤0,05 |
Table 1: Comparative characteristics of the prevalence of obesity in children per 100 examined (according to the results of asses
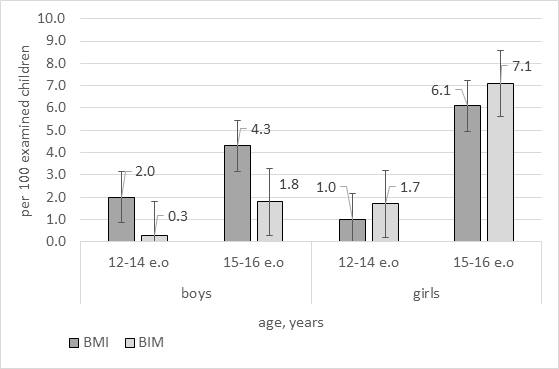
Statistically significant differences were also found when analyzing by sex for all age groups except for girls aged 15-16 (Figure 1). However, these differences were multidirectional. Among young men, higher prevalence of obesity was found when assessing BMI according to the WHO methodology, which was 6.6 times higher in the group of 12-14 years old and 2.5 times higher in the group of 15-16 years old. In girls, on the contrary, higher rates were registered when assessed by bioimpedancemetry, including 71.7% higher in the group of 12-14 years old and 17.2% higher in the group of 15-16 years old.
Based on bioimpedance analysis, a comparative assessment of body composition in children with normal body weight and obese children in the age groups of 12- 14 and 15-16 years was carried out. In both age groups, statistically significant differences (p≤0.05) were found in the following indicators of body composition components: water content, intracellular and extracellular fluid, fat mass and fat percentage (Table 2).
The indices characterizing the content of protein in muscles, mineral substances, fat-free body weight and skeletal muscle weight in obese children slightly exceeded the similar indices in 12-14 years old children with normal body weight, but there were no statistically significant differences (≥0.05) (Table 2). In the age group of 15-16 years old, on the contrary, these indices were higher in children with normal body weight, but the differences were also not statistically significant (Table 3).
| Children with normal body weight (M±m) | Obese children (M±m) | p | |
|---|---|---|---|
| Water (L) | 29,4±6,1 | 44,6±6,4 | ≤0,05 |
| Intracellular fluid (L) | 18,8±3,8 | 31,1±4,0 | ≤0,05 |
| Extracellular fluid (L) | 11,6±2,3 | 23,6±2,4 | ≤0,05 |
| Protein in muscles (kg) | 8,1±1,7 | 9,1±1,8 | ≥0,05 |
| Minerals (kg) | 3,0±0,6 | 3,4±0,7 | ≥0,05 |
| Fat mass (kg) | 8,1±3,3 | 31,1±1,7 | ≤0,05 |
| Lean mass (kg) | 41,6±8,3 | 47,1±8,8 | ≥0,05 |
| The mass of the skeleton musculature (kg) | 22,5±5,0 | 25,6±5,3 | ≥0,05 |
| % fat content | 16,1±5,2 | 39,5±3,5 | ≤0,05 |
Table 2: Comparative assessment of body composition indicators in children aged 12-14 with normal and obese children.
| Children with normal body weight (M±m) | Obese children (M±m) | p | |
|---|---|---|---|
| Water (L) | 30,8±6,9 | 46,9±0,9 | ≤0,05 |
| Intracellular fluid (L) | 21,5±4,4 | 32,9±0,7 | ≤0,05 |
| Extracellular fluid (L) | 12,5±2,8 | 24±0,3 | ≤0,05 |
| Protein in muscles (kg) | 10,2±1,9 | 9,9±0,3 | ≥0,05 |
| Minerals (kg) | 3,6±0,6 | 3,4±0,2 | ≥0,05 |
| Fat mass (kg) | 9,5±3,4 | 44,0±0,4 | ≤0,05 |
| Lean mass (kg) | 51,6±9,4 | 50,3±1,4 | ≥0,05 |
| The mass of the skeleton musculature (kg) | 28,6±5,7 | 27,9±0,8 | ≥0,05 |
| % fat content | 15,8±5,7 | 46,9±2,7 | ≤0,05 |
Table 3: Comparative assessment of indicators of body composition in children aged 15-16 with normal and obese children.
Comparable indicators of body component composition in obese children compared to the group of children with normal body weight in terms of water content were 51.7% higher in the 12-14-years-old group and 52.3% higher in the 15-16-years-old group. In terms of intracellular fluid content, the indicators among obese children in the 12-14 age group were 65.4% higher than in the cohort of children with normal body weight, and in the 15-16 group - by 53.0%. In the 12-14-years-old group of children with obesity the extracellular fluid content was 2 times higher compared to children with normal body weight, and in the age group of 15-16-years-old this indicator was higher by 92.0%.
In terms of fat content, the indicators among obese children of 12-14 years-old were 3.8 times higher than those of peers with normal body weight, and in the 15-16 age group- 4.6 times higher. The percentage of fat content in obese children in the age group “12-14 years” was 2.4 times higher than in the cohort of children with normal body weight; and in the group 15-16 years –3.0 times higher. Statistically significant differences in water content, intracellular and extracellular fluid content, fat mass content and percentage of fat were also revealed in the comparative assessment of body composition in children with normal and overweight in the age group of 12-14 years (p≤0.05). In the group of overweight children, these indicators were significantly higher in water content (by 38.4%), intracellular fluid (by 64.9%), extracellular fluid (by 95.7%), adipose tissue (by 2.4 times), and percentage of fat (by 96.9%). No significant differences in other studied body composition indicators were found in children with normal and overweight of this age group (p≥0.05) – (Table 4).
| Children with normal body weight (M±m) | Overweight (M±m) | p | |
|---|---|---|---|
| Water (L) | 29,4±6,1 | 40,7±5,9 | ≤0,05 |
| Intracellular fluid (L) | 18,8±3,8 | 31±3,8 | ≤0,05 |
| Extracellular fluid (L) | 11,6±2,3 | 22,7±2,2, | ≤0,05 |
| Protein in muscles (kg) | 8,1±1,7 | 8,2±1,6 | ≥0,05 |
| Minerals (kg) | 3,0±0,6 | 3±0,6 | ≥0,05 |
| Fat mass (kg) | 8,1±3,3 | 19,6±5,6 | ≤0,05 |
| Lean mass (kg) | 41,6±8,3 | 42±8,1 | ≥0,05 |
| The mass of the skeleton musculature (kg) | 22,5±5,0 | 22,8±4,9 | ≥0,05 |
| % fat content | 16,1±5,2 | 31,7±6,5 | ≤0,05 |
Table 4: Comparative assessment of body composition indicators in children aged 12-14 with normal and overweight.
A comparative assessment of body composition of children with normal body weight and overweight children in the age group 15-16 years revealed significant differences (p≤0.05) in water content, intracellular and extracellular fluid, and fat mass (Table 5). These indicators were significantly higher in the group “children with excess body weight” compared to the group “children with normal body weight”, including water content - by 55.2%, intracellular fluid - by 55.8%, extracellular fluid - by 94.2%, adipose tissue - by 2.1 times. For the rest of the studied body composition indicators, no statistically significant differences were found in this age group with normal body and excess body weight (p≥0.05).
| Children with normal body weight (M±m) | Overweight (M±m) | p | |
|---|---|---|---|
| Water (L) | 30,8±6,9 | 47,8±8,3 | ≤0,05 |
| Intracellular fluid (L) | 21,5±4,4 | 33,5±5,3 | ≤0,05 |
| Extracellular fluid (L) | 12,5±2,8 | 24,3±3,1 | ≤0,05 |
| Protein in muscles (kg) | 10,2±1,9 | 10,1±2,3 | ≥0,05 |
| Minerals (kg) | 3,6±0,6 | 3,7±0,8 | ≥0,05 |
| Fat mass (kg) | 9,5±3,4 | 20±5,7 | ≤0,05 |
| Lean mass (kg) | 51,6±9,4 | 51,7±11,4 | ≥0,05 |
| The mass of the skeleton musculature (kg) | 28,6±5,7 | 28,7±6,9 | ≥0,05 |
| % fat content | 15,8±5,7 | 28,3±8,0 | ≤0,05 |
Table 5: Comparative assessment of body composition indicators in children aged 15-16 with normal and overweight.
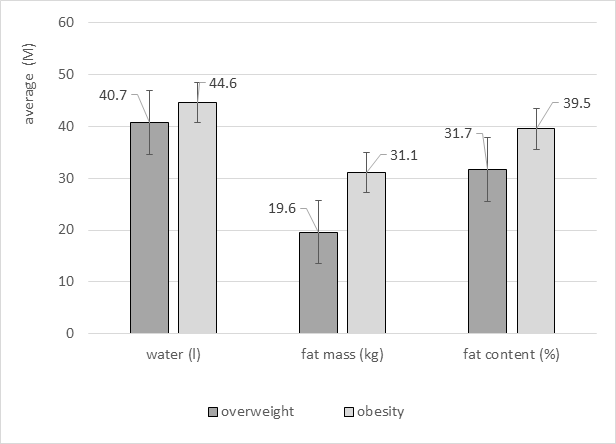
A comparative analysis of the indicators of body component composition in overweight and obese children revealed statistically significant differences in the age group
12-14 years only fat mass content, which was 58.6% higher in obese children (Figure 2).
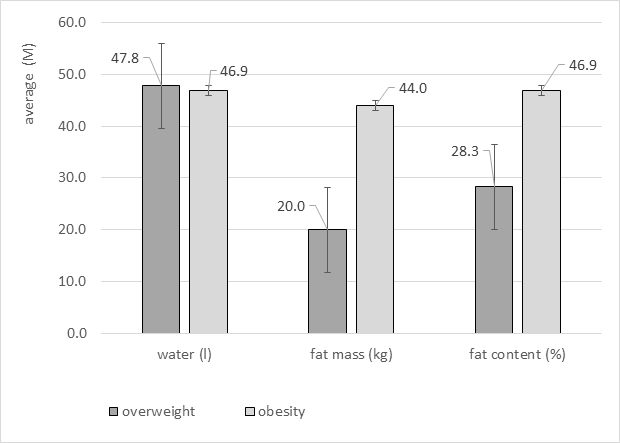
In the group of obese children 15-16 years old, there were statistically significant differences in fat mass, which were 2.2 times higher than in overweight children, and percentage fat content, which were 65.5% higher than in overweight children (Figure 3).
Gender differences were found for a number of parameters in the group of overweight children, including obesity. Higher values in boys were found for almost all studied parameters, except for fat mass, which was statistically significantly higher in girls (by 12.3%). A statistically significant excess in boys compared to girls was noted for water content (by 22.3%), protein in muscle (by 27.2%) and percentage of fat (by 27.1%).The revealed absence of statistically significant differences in the prevalence of overweight obtained when assessed by BMI and significant differences in these indicators when assessing the prevalence of obesity in children 12- 16 years old by bioimpedancemetry indicates the low informational significance of the BMI method of assessment. It is consistent with numerous studies stating that this method does not provide an objective characterization when assessing physical state [15, 17]. Recently, in scientific studies to identify overweight and obesity, bioimpedancemetry is widely used as the most informative method to characterize the component composition of the body, which can be used to assess the state of metabolic processes and at earlier stages to identify signs of the initial development of pathological processes caused by metabolic disorders [15, 18, 27]. The comparative assessment of body composition using bioimpedancemetry in this study revealed a number of differences in children with normal body weight, overweight and obesity. The higher values of water content, extracellular fluid, fat mass and fat percentage in obese children compared to normal weight children are confirmed by the available literature [28]. Higher levels of the body fat component were also found in obese children compared to overweight children, which agree with the data available in the literature on the increase in the fat component with age and with the progression of obesity [29]. In children with overweight and obesity, gender characteristics of body composition were identified, characterized by higher levels of fat mass in girls and higher levels of skeletal muscle mass and protein in boys, which is consistent with existing research [30].
Conclusion
The results of the comparative evaluation of the methods of obesity indication using BMI and bioimpedancemetry have shown that while there are no significant differences when using these methods in children with normal and overweight body mass, there are significant differences when estimating BMI in obese children. The absence of statistically significant differences between overweight and normal weight children obtained by BMI method and significant differences in these indicators received by bioimpedancemetry indicate the higher informational significance of the BIM method for assessment the disorders of body mass. This advantage of BIM as well the possibility to use it for measuring the component body composition prove the benefit of using bioimpedancemetry method for assessing the body weight of overweight schoolchildren and to take into account the obtained data in the development of preventive measures.
Information about the Contribution of the Authors
Concept and Design of the Study: Novikova I.I.; Shevkun I.G., data collection, statistical analysis: Novikova I.I., Sorokina A.V.; Analysis and Interpretation of Results: Novikova I.I., Shevkun I.G., Aizman R.I.; literature review: Shevkun I.G., Sorokina A.V., Aizman R.I.; Preparation and Editing of the manuscript: Novikova I.I., Shevkun I.G., Sorokina A.V., Aizman R.I. All authors reviewed the results of the work and approved the final version of the manuscript. Compliance with Ethical Standards: the study material was approved by the ethics committee at the Novosibirsk Research Institute of Hygiene of Rospotrebnadzor (No. 13 of November 25, 2021). Funding: The study was not sponsored Conflict of Interest: The authors declare no apparent or potential conflicts of interest in connection with the publication of this article.
References
-
Dzhumagaziev AA, Bezrukova DA, Bogdanyants MV, Orlov FV, Raisky DV, et al. (2016) Obesity in Children in the Modern World: Realities and Possible Solutions. Issues of modern pediatrics 15(3): 250-256.
-
World Health Organization (2022) Obesity and overweight.
-
Verbovoy AF, Sharonova LA (2019) Obesity: epidemiological and socio-economic aspects, prevention. Endocrinology: News, Opinions, Training 8(3): 87-97.
-
Lobstein T, Jackson-Leach R, Moodie ML, Hall KD, Gortmaker SL, et al. (2015) Child and adolescent obesity: part of a bigger picture. Lancet (9986): 2510-2520.
-
Kumar S, Kelly AS (2017) Review of childhood obesity: from epidemiology, etiology and comorbidities to clinical evaluation and management. Mayo Clinic Proc 92(2): 251-265.
-
Xu S, Xue Y (2016) Pediatric obesity: causes, symptoms, prevention and treatment. Exp Ther Med 11(1): 15-20.
-
Balanova YA, Shalnova SA, Deev AD, Imaeva AE, Kontsevaya AV, et al. (2018) Obesity in the Russian population – prevalence and associations with risk factors for chronic non communicable diseases. Russian Journal of Cardiology 6: 123-130.
-
Vecherkina ZhV, Chirkova NV, Morozov AN (2018) Evaluation of dental status in overweight adolescent children. Vestnik novykh meditsinskikh tekhnologiy 12(4): 52-56.
-
Levchenko OV, Gerasimov AN, Kuchma VR (2018) Influence of socio-economic factors on the incidence of socially significant and main classes of diseases in children and adolescents. Zdorovʹye naseleniya i sreda obitaniya 8: 21-25.
-
Dabas A, Rastogi V, Khadgawat R, Marwaha RK (2022) Predictive Performance of Different Diagnostic Criteria for Overweight and Obesity Between 2008-2015 in Adolescents. Indian Pediatr 59: 110-113.
-
Peterkova VA, Nagaeva EV, Shiryaeva TY (2017) Assessment of the physical development of children and adolescents: Methodological recommendations. Moscow: Russian Association of Endocrinologists.
-
Novikova II, Gavrish SM, Romanenko SP, Sorokina AV, Serenko VV, et al. (2021) Comparative assessment of the information content of methods for indicating overweight. Sanitary Doctor 4: 67-78.
-
Vasyukova OV (2019) Obesity in children and adolescents: criteria for diagnosis. Obesity and metabolism 16(1): 70- 73.
-
Kovtun OP, Anufrieva EV, Neupokoeva LY. Features of the component composition of the body in children and adolescents with overweight and obesity. Uralʹskiy meditsinskiy zhurnal.
-
Filatova OV, Kutseva EV, Burtseva YS (2018) Comparative analysis of various methods for diagnosing obesity: anthropometry and bioimpedance analysis. Human ecology 9: 48-51.
-
Soboleva NP, Rudnev SG, Nikolaev DV, Eryukova TA, Kolesnikov VA, et al. (2014) Bioimpedance screening of the Russian population in Health Centers: the prevalence of surplus body mass and obesity. Russian Medical Journal 4: 4-13.
-
Spencer EA, Appleby PN, Davey GK, Key TJ (2002) Validity of self-reported height and weight in 4808 EPIC- Oxford participants. Public Health Nutr 5(4): 561-565.
-
Miklishanskaya SV, Zolozova EA, Safiullina AA, Mazur NA (2020) Visceral obesity in patients with different body mass indexes. Attending Doctor 8: 66-70.
-
Rudnev SG, Soboleva NP, Sterlikov SA, Nikolaev DV, Starunova OA, et al. (2014) Bioimpedance study of the composition of the body of the population of Russia. Central Research Institute for Organization and Informatization of Health Care 493.
-
Noradilah MJ, Ang YN, Kamaruddin NA, Deurenberg P, Ismail MN, et al. (2016) Assessing Body Fat of Children by Skinfold Thickness, Bioelectrical Impedance Analysis, and Dual-Energy X-Ray Absorptiometry: A Validation Study Among Malay Children Aged 7 to 11 Years. Asia Pac J Public Health. 28(5): 74S-84S.
-
Alferova VI, Mustafina SV (2022) The prevalence of obesity in the adult population of the Russian Federation (literature review). Obesity and metabolism 19(1): 96- 105.
-
Menshikova LV, Babanskaya EB (2018) Sex and age epidemiology of obesity. Obesity and metabolism. 15(2): 17-22.
-
Namazova-Baranova LS, Yelets KA, Kaitukova EV, Makarova SG (2018) Assessment of the physical development of children of middle and senior school age: analysis of the results of a one-time study. Pediatric pharmacology 15(4): 333-342.
-
Kuprienko NB, Smirnova NN (2018) The prevalence of overweight and obesity in school-age children in St. Petersburg. Preventive and Clinical Medicine 2: 23-30.
-
Anufrieva EV, Neupokoeva L Yu, Kovtun OP (2020) Trends in the prevalence of obesity in children and adolescents in the Sverdlovsk region. Russian Pediatric Journal 1(2): 5-9.
-
Larionova MA, Kovalenko TV (2019) Epidemiological features of obesity in children and adolescents in the Udmurt Republic. Ozhireniye i metabolism 16(1): 47-54.
-
Girsh YV, Gerasimchik OA (2018) The role and place of bioimpedance analysis in assessing the body composition of children and adolescents with different body weights. Byulletenʹ sibirskoy meditsiny. 7(2): 121-132.
-
Kedrinskaya AG, Obraztsova GI, Leonova IA (2018) Body composition in overweight and obese children. Russian Pediatric Journal 2: 73-77.
-
Oorzhak US, Taranushenko TE, Ilyenkova NA, Khomenko EM, Panfilova VN, et al. (2007) Features of the component composition of the body in children with the progression of obesity. Problem of Endocrinology 53(3): 13-16.
-
Peshkov MV, Sharaikina EP (2014) Gender characteristics of bioimpedancemetry indicators depending on the body mass index of students. Siberian medical education 6: 52-57.
- Superposition of Cryo-EM and AlphaFold Predictions of Dengue Antigen-Antibody Complexes
- Jugular-Applied Coherent Low-Level Laser Therapy Enhances Systemic Mitochondrial Metabolic Function and Antioxidant Response
- Role of OMC32 Polypeptide in Acrosin-Mediated Exocytosis during the Bovine Sperm Acrosome Reaction
- Association of Galectin-3 but not Laminin in Tamoxifen-Induced Growth Suppression in Breast Cancer MCF-7 Cells
- Effect of Different Wavelengths of Light on the Rate of Photosynthesis
- Nutritional, Therapeutic, and Environmental Effect of Oyster Mushrooms: An Editorial