A Regression-Based Approach for Accurate Source Tracking Using Microbial Communities
Microbiome data has emerged as a valuable resource in source tracking studies, owing to its applications in the examination of trace evidence and human identification. In response to the growing importance of microbial information in forensic and environmental investigations, we have developed a novel statistical method called REST (REgression-based Source Tracking). REST offers a robust framework to harness microbiome data for the purpose of linking sample or sink data to a diverse pool of potential sources, identifying missing contributors, and accurately estimating the proportions of each source. Our research findings clearly demonstrate the superiority of the REST method over existing techniques in source tracking. Notably, REST exhibits a remarkable ability to detect and estimate the proportions with a minimal error rate. This advancement holds the potential to significantly enhance the accuracy of identifying individuals in forensic cases and tracking the origins of microbial compositions in environmental samples. By minimizing errors and providing precise estimates, REST opens up new possibilities for improving criminal investigations, mitigating environmental contamination, and addressing public health concerns with greater confidence and precision. The versatility of the REST method extends its applications beyond the scenarios discussed here, making it a valuable tool in various source tracking endeavors.
Introduction
In the past decade, significant advancements have been made in the field of microbial source tracking (MST), enabling the identification of the origins of microbial contamination. MST techniques have found diverse applications, ranging from assessing water contamination to determining source contributions in legal arena [1]. These techniques are also valuable for quantifying the distribution of source contribution, and they have been widely employed in areas such as microbial forensics, microbiome-based healthcare, and environmental monitoring. By analyzing multiple microbial samples and decomposing the microbial community, it becomes possible to establish links between the sources/individuals and the evidence/sink, while also estimating the respective proportions of the contributors. Throughout the text, we will use the terms of source and evidence.
Microbial communities exhibit substantial variation from sample to sample. It is often feasible to track the source of a sample via its unique microbial composition. However, in practical scenarios, the evidence samples typically comprise a mixture of multiple sources, and their composition can fluctuate under varying environmental conditions. This poses challenges in efficiently tracing the sources. A recent study by Gloor, et al. [2] highlighted the discordance among three mouse metagenomics studies, as they reported distinct lists of statistically significant taxa with minimal overlap [2].
A few methods have been developed for microbial source tracking. SourceTracker, a tool for microbial community analysis, estimates microbial proportions using Bayesian models, providing valuable insights into complex ecosystems [3]. This method allows uncertainty in the source and is able to track unknown sources. However, its accuracy relies on well-characterized source environments in the reference database, and it assumes well-mixed communities, limiting applicability in heterogeneous environments.
Additionally, the computational time of SourceTracker can be a consideration, especially for large datasets. FEAST (Fast Expectation-Maximization for microbial source tracking), is a method adept at estimating the contribution of numerous potential sources in microbial communities, especially when dealing with unknown or poorly understood sources within the target microbial community [4]. While it excels in source identification and quantification, it is important to note some potential disadvantages. FEAST may face challenges in scenarios where the underlying assumption of convex combinations is violated, such as in cases with significant variability between certain source environments. Additionally, the method’s applicability could be influenced by technical confounders in specific datasets.
The RAD method based on Aitchison distance emerges as a new tool in microbial source tracking, particularly in forensic contexts [5]. Its notable advantages include accurate detection of sources with non- zero mixture components, with infrequent selection of non-significant sources in replications. Integrating RAD into parameter estimation significantly enhances the precision of predicted source proportions for Bayesian SourceTracker, leading to reduced absolute and relative error rates. Additionally, its unique feature of not assigning proportions to an unknown source, while advantageous in certain scenarios, may limit its ability to account for certain complexities in microbial communities. Nonetheless, in the realm of forensic investigations, RAD proves invaluable for its ability to filter sources and estimate microbial proportions, enhancing trace evidence analysis and aiding in crime scene investigation.
In this paper, we introduce a novel regression-based method called REST (REgression-based Source Tracking) that has wide-ranging applications in forensic studies and environmental monitoring. The primary goal of our method is to accurately identify sources from a pool of sources using microbial materials collected at a crime scene. Additionally, we apply REST to trace the compositional pattern of water samples in a real data analysis. However, it is important to note that our method is not limited to these specific applications and can be extended to various scenarios, including general source tracking such as detecting fecal contamination in environmental samples.
By employing the REST method, we aim to enhance the accuracy and reliability of source tracking in forensic and environmental studies. The ability to identify individuals and trace the origins of microbial compositions in various samples opens up possibilities for improving criminal investigations, understanding environmental contamination, and addressing public health concerns.
Methods
REST operates by estimating the probability of sources’ presence in a collected sample or determining the percentage contributions of different sources in a given evidence sample. The method begins by selecting important contributors as a preliminary step. It then identifies which sources are responsible for the microbial composition observed in the evidence sample. In cases where there are potential “unknown” sources, REST constructs a profile for these sources and subsequently conducts an agreement check to evaluate their plausibility. Finally, REST estimates the proportions of each source contributing to the evidence sample.
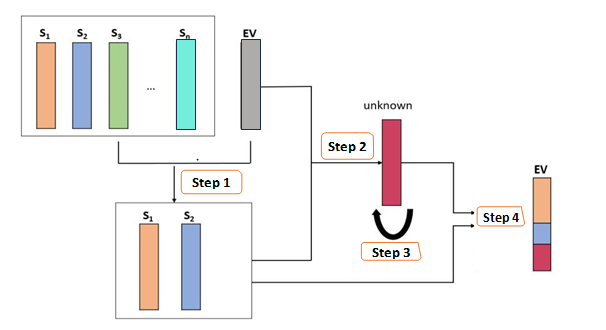
The REST framework consists of four steps (Figure 1). In step 1, Relative Aitchison Difference source selection (RAD) [5] is employed to identify sources that contribute to the microbial evidence. The identified important contributors from step 1 are utilized in step 2 to construct linear regression models, and the residuals from the models are transformed to create a profile for potential “unknown” source. In step 3, an agreement analysis is conducted to examine the status of the “unknown” source, i.e., whether there exists unknown source or not. Finally, the proportions of the selected sources which are included in the regression model, and the potential unknown source if it exists based on step 3 are estimated. The details of the method can be seen in the Appendix. We compare the proposed method REST with the existing methods, FEAST, SourceTracker, and RAD using both synthetic data and real data analyses.
Synthetic Data Analysis
Data Generation
To generate simulated data for our study, we utilized the dataset from the original study conducted by Lax, et al. [6]. In their research, microbial communities from seven families and their homes were examined over a span of six weeks. The findings of the study demonstrated significant variations in microbial communities among different households. For our project, we randomly selected ten samples/individuals from six families at the initial time point. Among these ten samples, labeled as A to J, some belong to the same family, indicating that the microbiomes of these samples may exhibit more similarities compared to samples from different families. The datasets comprise relative abundance count for species.
To simulate the sink or evidence sample in our study, we generated microbial sample as a mixture of multinomial distributions. Each evidence is composed of three sources with the proportion of 0.5, 0.3, and 0.2, respectively. In our study, we assume that only one source is missing, which usually is a minor contributor, while the most significant sources (i.e., with large proportions) are always present. By simulating these data, we aim to investigate and assess the performance of our method in identifying the missing source and estimating the proportions of different sources contributing to the sink sample. These simulations provide us with a controlled setting to evaluate the effectiveness and accuracy of our approach in source tracking and identification.
To demonstrate the effectiveness of the REST method, we chose four combinations, namely Experiment ACJ (i.e., the evidence is composed of sources A, C, and J), Experiment ADE, Experiment AHI, and Experiment BFH. Each of these combinations consists of three sources with compositions of 50%, 30%, and 20%, respectively. The simulation settings, are as presented in Table 1, provide a summary of the parameters used, where sources H and I are from the same family, and D and E from another family.
| Scenario | Experiment | True composition of Evidence | Available Sources |
|---|---|---|---|
| Non-missing source | 1: AHI | 0.5*A + 0.3*H + 0.2*I | A~J |
| Non-missing source | 2: ADE | 0.5*A + 0.3*D + 0.2*E | A~J |
| Non-missing source | 3: BFH | 0.5*B + 0.3*F + 0.2*H | A~J |
| Non-missing source | 4: ACJ | 0.5*A + 0.3*C + 0.2*J | A~J |
| Missing source | 5: A(H)I | 0.5*A + 0.2*H + 0.3*I | A~J, but H missing |
| Missing source | 6: AH(I) | 0.5*A + 0.3*H + 0.2*I | A~J, but I missing |
| Missing source | 7: A(D)E | 0.5*A + 0.2*D + 0.3*E | A~J, but D missing |
| Missing source | 8: AD(E) | 0.5*A + 0.3*D + 0.2*E | A~J, but E missing |
| Missing source | 9: B(F)H | 0.5*B + 0.2*F + 0.3*H | A~J, but F missing |
| Missing source | 10: BF(H) | 0.5*B + 0.3*F + 0.2*H | A~J, but H missing |
| Missing source | 11: A(C)J | 0.5*A + 0.2*C + 0.3*J | A~J, but C missing |
| Missing source | 12: AC(J) | 0.5*A + 0.3*C + 0.2*J | A~J, but J missing |
Table 1: ICC Values for Two Scenarios of 12 Experiments.
*() indicates the name of missing source. Table 1: Simulation Settings.
Agreement Analysis Result
To determine the presence of the “unknown” source, we need to have two or more replicated samples of the microbial evidence to calculate the Intraclass Correlation Coefficient (ICC) ratio in step 3 [7]. The ICC results are summarized from the above simulated data in Table 2. It is obvious that the ICC value is very small and approaches zero for the no-missing source scenarios. Typically, a negative intraclass correlation implies zero reliability [8]. The small value of ICC suggests that the “unknown” profile constructed in step 2 has low reliability, which indicates there is no missing source. However, all the ICC results for the experiments of missing source are greater than 0.2. By comparing the ICC value between the scenario without missing sources and the ones with missing source, we are able to conclude the existence of a missing source.
| Scenario | Experiment | ICC value |
|---|---|---|
| Non-missing source | 1: AHI | -0.013 |
| 2: ADE | 0.0516 | |
| 3: BFH | -0.0132 | |
| 4: ACJ | -0.006 | |
| Missing source | 5: A(H)I | 0.3725 |
| 6: AH(I) | 0.4356 | |
| 7: A(D)E | 0.6185 | |
| 8: AD(E) | 0.5588 | |
| 9: B(F)H | 0.917 | |
| 10: BF(H) | 0.2827 | |
| 11: A(C)J | 0.507 | |
| 12: AC(J) | 0.9056 |
Table 2: ICC Values for Two Scenarios of 12 Experiments.
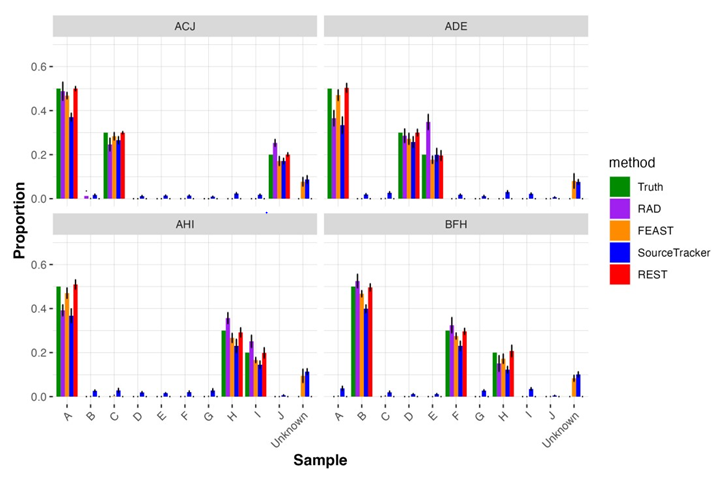
Now, we use the constrained least-squares linear regression to estimate the linear coefficients, which can be interpreted as the proportion of microbial materials of each source that remained at the crime scene. We compare our findings with the existing method: SourceTracker [3] and FEAST [4]. Additionally, we compare with naïve RAD [5] in terms of the estimated proportions of contributors of a given evidence. Comparison Result Figure 2 shows the results for scenarios where no source was missing. In these cases, our proposed method accurately provides proportions for the three true contributors, closely aligning with the actual settings. In contrast, SourceTracker assigns proportions to all sources, introducing inconsistency with the true settings. Furthermore, SourceTracker and FEAST erroneously detect an unknown source with certain proportions, despite the fact that no source is missing in these scenarios.
In addition to comparing proportion estimations, we comprehensively evaluate accuracy using nine measurements to assess the match between estimated proportions and true settings. These measurements include Average Absolute Error (AVG), Average Relative Error (AVGER), Total Variation Distance (DTV), Median Absolute Deviation (MAD), Mean Absolute Percentage Error (MAPE), Maximum Relative Error (MAXRE), Mean Squared Error (MSE), Relative Root Mean Squared Error (RRMSE), and Symmetric Mean Absolute Percentage Error (SMAPE). Detailed definitions can be found in Appendix A.
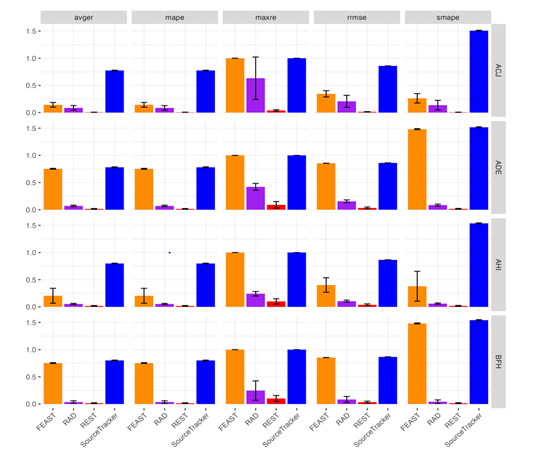
For the non-missing scenario, performance measurements are presented in Figure 3 (five measures) and Appendix B (Figure S1) (the remaining four measures), with separate figures due to their size. Through these comparisons, it is evident that the proposed REST method consistently outperforms RAD, SourceTracker, and FEAST across all nine measurements in all four experiments.
Each row represents an experiment setting and each experiment was replicated 10 times. The x-axis is the method, and the y-axis is the averaged value of performance from 10 replications. The error bars show the standard deviation from the replications. The smaller the measurement value, the better the performance.
The results of experiments with missing sources are presented in Appendix Figure S2. The RAD method fails to estimate the ‘unknown’ source in all eight experiments. SourceTracker, FEAST, and REST can identify an unknown source but tend to underestimate its true proportion. Similar to the outcomes in scenarios with non-missing sources, FEAST and SourceTracker assign small proportions to sources that are not present. In the context of the missing source scenario, the measurements plots (Figures S3 & S4) indicate that REST exhibits comparable or smaller error rates across all eight scenarios, utilizing nine different measurements.
We also assess the robustness of REST, RAD, SourceTracker and FEAST under conditions of high disambiguation between sources. To evaluate their performance as the similarity between contributor sources increases, we select ten source combinations and calculate the Jensen-Shannon divergence. Each combination is replicated ten times for consistency in the analysis. REST demonstrated favorable comparisons in both the error rate plots (Figures 4a-c; the lower, the better) and the correlation plot (Figure 4d), the higher the better). This suggests that it exhibits higher accuracy than RAD, SourceTracker, and FEAST across all levels of divergence.
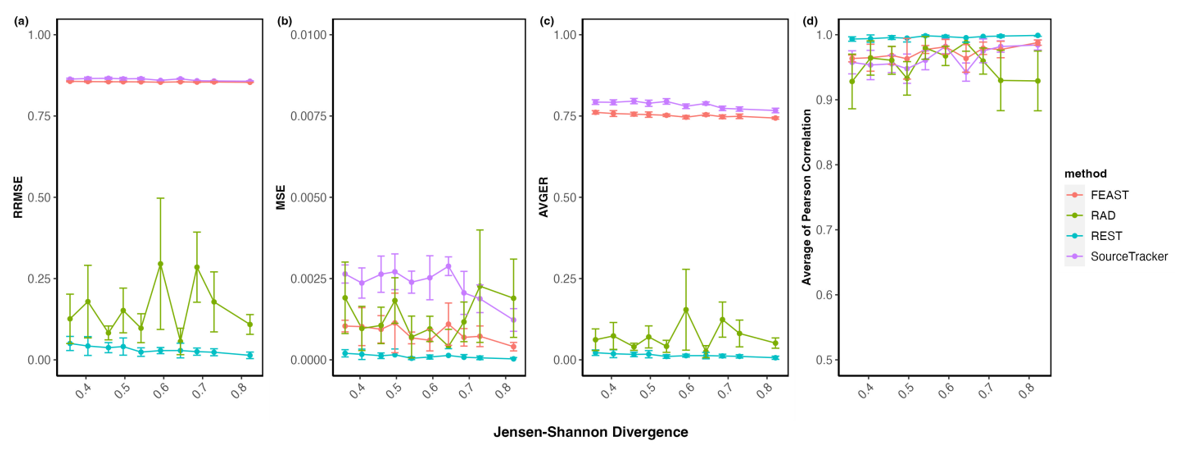
Figure 4: Comparison of Measurements for FEAST, REST, RAD, and Sourcetracker for Evidence Samples with Varying Mixture Sources Measured by Jensen-Shannon Divergence. (A) Relative Root Mean Square Error, (B) Mean Squared Error, (C) Average of Relative Error, (D) Average of Pearson Correlations between the True and Estimated Proportions Across all Source Environments; Error Bars Show the Standard Error of the Mean from Ten Replications.
Real Data Application
To assess the performance of REST in real-world data analysis, we apply REST to a fecal source tracking study [9]. In this study, the sink/evidence is represented by untreated secondary wastewater obtained by spiking lake water with effluent. We examine four scenarios (Figure 5): (a) only known sources—lake water, effluent, cow fecal, and horse fecal; (b) all available sources—geese fecal, effluent, deer fecal, gulls fecal, cow fecal, lake water, and horse fecal; (c) missing source—effluent, with only cow and lake water available for source input; (d) missing source—effluent, with only horse and lake water available for source input.
Source tracking is conducted using SourceTracker, FEAST, REST, and RAD with genus-level microbial abundance data. Both known sources and all available sources are provided as input. REST and RAD successfully identify the true contributors, while SourceTracker and FEAST assign proportions to additional sources. To assess the impact of missing known sources, cow and horse are introduced as additional sources. Despite the absence of known sources, the REST method consistently identifies the true contributors. However, SourceTracker and FEAST incorrectly predict cow and horse as contributors. RAD can predict true contributors but is unable to estimate any unknown or missing source.
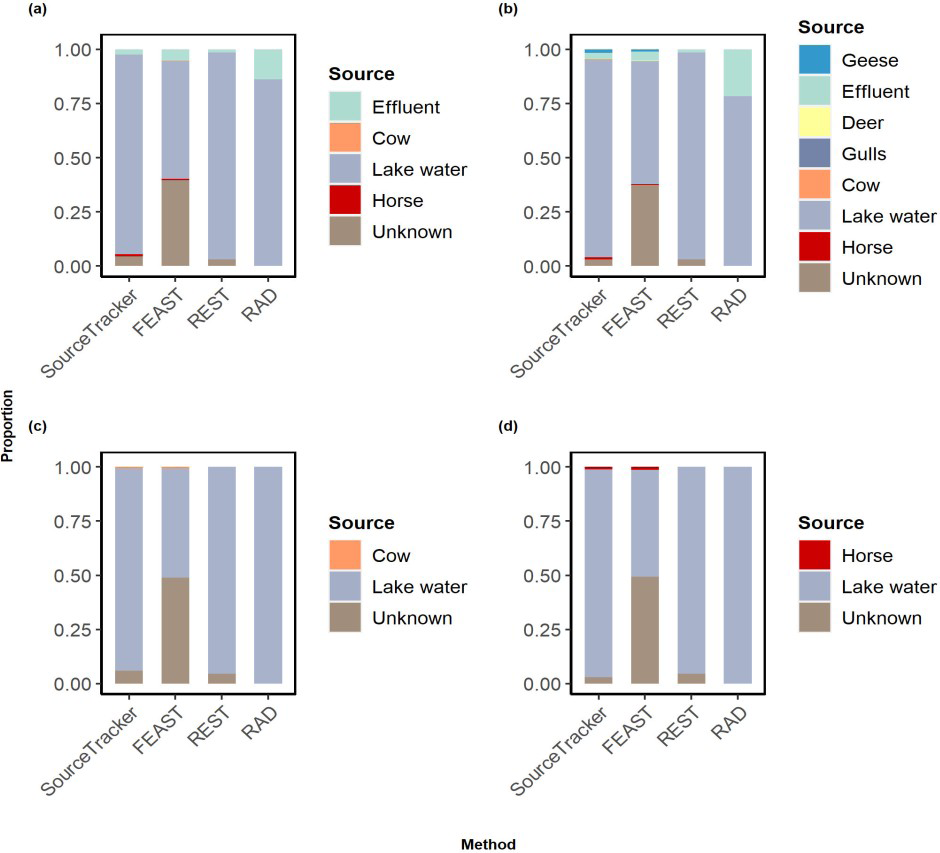
Figure 5: Stacked Bar Plot Comparing the Proportions Estimated from Sourcetracker, RAD, FEAST, and REST for the Untreated Secondary Wastewater: (A) Using Only the Known Sources: Lake Water, Effluent, Cow Fecal, and Horse Fecal; (B) Using all Available Sources: Geese Fecal, Effluent, Deer Fecal, Gulls Fecal, Cow Fecal, Lake Water and Horse Fecal; (C) When Cow and Lake Water only were Present; (D) When Horse and Lake Water Only were Present.
Discussion and Conclusion
The use of human and environmental microbiome data in source tracking has seen significant development. However, challenges remain, including storage constraints, contamination risks, and the lack of robust datasets. Urgently needed are accurate statistical methods with strong power for forensic, healthcare, and environmental applications. To achieve widespread use, we must establish appropriate sample storage, reliable datasets, and resilient statistical approaches.
In this paper, we propose the REST method for accurately identifying and estimating sample probabilities within a pool of sources using microbial materials from a specific location. Our approach involves contributor selection, unknown source profiling, an agreement check, and proportion estimation. The contributor selection step narrows down the range, while the agreement check confirms the presence of a missing source. Our method adeptly identifies contributors, excluding unrelated sources and reducing noise. Recognizing the possibility of missing information, we construct a profile for potential missing data, using the ICC for the agreement check. A small ICC value indicates no “unknown” source, streamlining proportion estimates by reducing noise.
REST has demonstrated superior performance compared to existing microbial source methods in both simulation studies and real data analysis. Its applications span various fields, including forensic studies, contamination detection, and human identification. One limitation of the proposed method is the requirement for two or more replications of sequencing evidence for an agreement check. In practical terms, collecting two replicates is reasonable and affordable. In cases where evidence collection occurs only once, especially when the touch is imprecise, technical repeats can mitigate noise. If no replicates are available, we recommend always including the “unknown” source for proportion estimation, ensuring minimal noise in scenarios with missing evidence. In addition to accuracy, computational time is a crucial consideration. REST falls between FEAST and SourceTracker in terms of computational efficiency.
To enhance the accuracy of the REST method, we should consider the characteristics of the data. Microbiome data are typically high-dimensional and sparse, and in this case, they are compositional data constrained to sum to a constant. Analyzing compositional data is best approached through a log-ratio transformation [10, 11, 12]. We experimented with log-transformation on the original data, incorporating a small pseudo-count for zero counts, and an isometric log- ratio transformation. The latter, an orthonormal isometry, addresses challenges associated with centered log-ratio transformation in constructing a potential “unknown” source. Data contamination poses another consideration. The presence of DNA contamination is common and can impact accuracy during analysis. For future work, integrating microbiome and metabolomics data holds promise for improving accuracy in linking objects or locations with sink/ evidence samples. Conflicts of Interest: None declared.
Acknowledgements: We heartedly thank Dr. Sadowsky’s lab for the fecal data. CODE AVAILABLE: https://github.com/anlingUA/REST Funding: This work has been partially supported by the United States Department of Agriculture (ARZT- 1361620- H22-149) to L.A.
References
-
Harwood VJ, Staley C, Badgley BD, Borges K, Korajkic A (2014) Microbial source tracking markers for detection of fecal contamination in environmental waters: relationships between pathogens and human health outcomes. FEMS Microbiology Reviews 38(1): 1-40.
-
Gloor GB, Macklaim JM, Pawlowsky-Glahn V, Egozcue JJ (2017) Microbiome datasets are compositional: and this is not optional. Frontiers in Microbiology 8: 2224.
-
Knights D, Kuczynski J, Charlson ES, Zaneveld J, Mozer MC, et al. (2011) Bayesian community-wide culture- independent microbial source tracking. Nat Methods 8(9): 761-763.
-
Shenhav L, Thompson M, Joseph TA, Briscoe L, Furman O, et al. (2019) FEAST: fast expectation-maximization for microbial source tracking. Nat Methods 16(7): 627-632.
-
Carter KM, Lu M, Luo Q, Jiang H, An L (2020) Microbial community dissimilarity for source tracking with application in forensic studies. PLoS One 15(7): e0236082.
-
Lax S, Smith DP, Hampton-Marcell J, Owens SM, Handley KM, et al. (2014) Longitudinal analysis of microbial interaction between humans and the indoor environment. Science 345(6200): 1048-1052.
-
Fisher RA (1992) Statistical methods for research workers. Breakthroughs in statistics pp: 66-70.
-
Bartko JJ (1966) The intraclass correlation coefficient as a measure of reliability. Psychological Reports 19(1): 3-11.
-
Brown CM, Mathai PP, Loesekann T, Staley C, Sadowsky MJ (2019) Influence of Library Composition on SourceTracker Predictions for Community-Based Microbial Source Tracking. Environ Sci Technol 53(1): 60-68.
-
Tsilimigras MCB, Fodor AA (2016) Compositional data analysis of the microbiome: fundamentals, tools, and challenges. Ann Epidemiol 26(5): 330-335.
-
Beale EML (1955) Cycling in the dual simplex algorithm. Naval Research Logistics Quarterly 2(4): 269-275.
-
Goldfarb D, Idnani A (1982) Dual and primal-dual methods for solving strictly convex quadratic programs. Numerical analysis pp: 226-239.
- Narcotics and Digital Forensics: Bridging Crimes in the Digital Age
- Ethics in Forensic Psychiatry: Principles, Dilemmas, and Human Rights
- Impact of Acute Stress on Attentional Orienting to Social Cues
- Head Injury and Intracranial Hemorrhage in Western Region of Libya
- A Forensic Study on Handedness: Examination of Handwriting Features in Right and Left Handed Writers
- Techniques for Latent Fingerprint Development Using Natural and Synthetic Powders: A Review