Relative Efficacy of Planar Bone Scan and SPECT/CT in Localizing the Site for Corticosteroid Injection in Plantar Fasciitis
<p>Purpose: Several studies have described the role of bone scintigraphy in the management of plantar fasciitis. This study was conducted to compare the relative efficacy of planar [99mTc] MDP bone scan and single photon emission computed tomography / computed tomography (SPECT/CT) in localizing the best site for corticosteroid injection in patients with plantar fasciitis.</p> <p>Methods: Thirty heels of 30 patients with clinical diagnosis of plantar fasciitis were randomly assigned to two groups, i.e. planar scintigraphy-guided (Group A) and SPECT/CT guided (Group B) for steroid injection. Patients were evaluated for pain intensity before the injections and at follow-up after 6 weeks, with a 100 mm visual analog scale (VAS).</p> <p>Results: There was significant improvement in VAS score in both the groups. VAS values before and after treatment were 7.4 ± 1.3 and 3.3 ± 2.4 in group A, and 7.4 ± 1.2 and 1.6 ±1.5 in group B respectively, which was statistically significant (P < 0.05). There was no difference between the pre-injection VAS values between the groups (P 0.98, MWU -0.021) but statistically significant difference post-injection (P 0.048, MWU 1.97).</p> <p>Conclusion: [99mTc] MDP bone scintigraphy was useful in identifying the inflammatory focus in plantar fasciitis. SPECT/CT guided steroid injection demonstrated a significantly better treatment outcome compared to planar scintigraphy. While the study is limited by the small number of patients, the findings indicate that SPECT/CT-guided steroid injection may provide better pain relief in this condition.</p>
Introduction
Plantar fasciitis (PF) is a type of inflammation caused by excessive stretching of the plantar fascia and is one of the most common causes of heel pain affecting up to 10% of running athletes [1, 2, 3]. Typical symptoms include pain during the first few steps after rest or on rising in the morning, both of which are aggravated by activity like jogging, dancing and playing tennis and basketball. A pathognomonic feature is tenderness at the site of insertion of the plantar fascia on the medial tubercle of the calcaneus [2, 4]. The diagnosis can usually be made on clinical examination. However, some patients may not have typical features or may be refractory to initial conservative treatment; hence, confirmation of the diagnosis is warranted. Treatment is primarily non- operative with most patients responding well [5, 6, 7, 8]. If other conservative measures fail, corticosteroid injection into the heel to control painful symptoms is frequently used [6, 7, 8, 9]. However, palpation guided injection (PGI) is not always successful in PF because of the inaccuracy of injection [10, 11]. Major complications after repeated corticosteroid injection include heel pad atrophy and fascial rupture [12]. Bone scintigraphy (BS) is useful in the identification and evaluation of PF [13, 14, 15]. Since three-phase BS also provides information about soft tissue inflammation, it can be used in the differential diagnosis of heel pain originating from the bone or fascia [14]. Focally increased activity in the delayed images restricted to the site of plantar fascial insertion in the calcaneus and associated with increased blood flow and blood pool in the early images is typical of PF [16]. Dasgupta, et al. have claimed that scintigraphy-guided corticosteroid injection was highly effective in PF [10]. They found that 12 out of 15 patients (80%), 13 of whom had received previous steroid injection, demonstrated discrete uptake of [99mTc] methylene diphisphonate in the subcalcaneal region. They achieved 100% success in abolishing local tenderness and in pain reduction. Frater et al presented scintigraphic criteria to identify potential responders, thereby avoiding unnecessary injection in a significant proportion of patients [17]. The added value of integrated single photon emission computed tomography / computed tomography (SPECT/CT) relative to triple-phase BS was evaluated by Horger, et al [18]. SPECT/CT avoided false positive findings and reduced the number of equivocal findings. In a study by Dolan et al., SPECT scans resulted in a 95% response rate to targeted steroid injection therapy in low back pain [19].
There has been limited experience in the use of SPECT/CT in evaluation of patients with PF, especially in comparison to planar scintigraphy. This study was conducted to evaluate the efficacy of scintigraphy-guided steroid injection for PF and compare these two imaging modalities.
Materials and Methods
Patient Population
This prospective study was conducted in our institute over a period of 16 months, after approval by the Institute Ethics Committee. Thirty adult patients with a clinical diagnosis of plantar fasciitis were included in the study after taking written informed consent. The patients were randomly divided into 2 groups of 15 each; group A (comprising 10 male and 5 female) who received planar scintigraphy-guided corticosteroid injection and group B (8 male and 7 female), where corticosteroid injection was guided by SPECT/CT.
Scintigraphic Examination
For the study, the patient lay supine under a dual headed gamma camera (Infinia Hawkeye 4, GE, USA) fitted with a low energy high-resolution (LEHR) collimator. Three-phase bone scintigraphy of both feet was performed after intravenous injection of 20 mCi (750 MBq) of [99mTc] Methylene Diphosphonate (MDP). Immediately after injection, dynamic images of the feet were acquired in a 64x64 matrix at the rate of 4 sec/frame for a period of 60 seconds in medial and lateral projections. This was followed by blood pool images starting 60 seconds after tracer injection. Delayed images were acquired 3 hours later and included four views in the dorsal, plantar, medial and lateral projections, obtaining at least 500K counts per view. In group B, the initial dynamic phase was followed immediately by blood pool SPECT/CT of the feet at 60 seconds. SPECT images were acquired in a 64x64 matrix in step-and-shoot mode, covering 360 degrees in 60 views at 30 seconds per view. CT images of the feet were then acquired in helical mode with a tube current of 2.5 mA. A second set of delayed SPECT/CT images of the feet were acquired using the same protocol, 3 hours after injection.
Scan Reporting and Injection Outcome
Images were transferred to a XelerisTM (GE, USA) workstation. Perfusion phase images were evaluated by examining the individual images and in cine mode. Any increase in tracer flow compared to the corresponding International Journal of Nuclear Medicine & Radioactive Substances
site in the opposite (asymptomatic) foot along the plantar fascia was considered abnormal. Blood pool images were examined for bilateral asymmetry in tracer pooling along the plantar fascia. Any increase in soft tissue tracer uptake (more than background) was considered abnormal. Delayed phase images were examined for any focal increase in tracer uptake in the inferior aspect of the heel along the attachment of the plantar fascia. To evaluate abnormal tracer uptake in the blood-pool phase, we characterized them as (a,b) focal calcaneal hyperemia, (c,d) extension of hyperemia into the proximal third of the plantar fascia, (e,f) diffuse involvement of the plantar fascia. Representative scans of the three types of blood pool tracer uptake in planar and SPECT/CT images are shown in Figure 1.
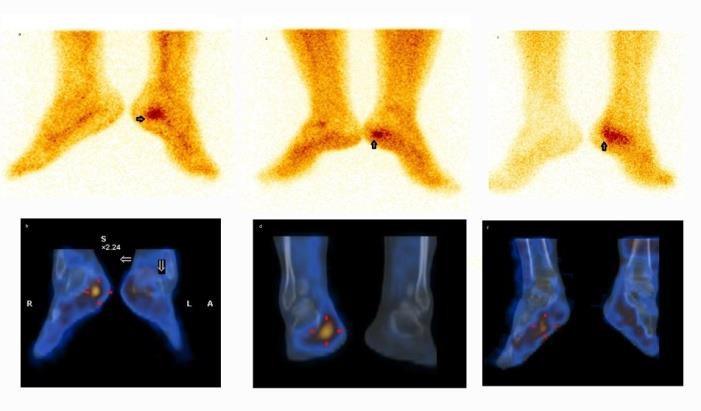
Figure 1: Focal (a,b), proximal 1/3rd (c,d) and diffuse (e,f) tracer uptake patterns on planar and SPECT/CT bone scintigraphy in the blood pool phase. Patients received a mixture of 1 ml of methylpredinosolone (20-40 mg) in combination with 1 ml of lignocaine-hydrochloride (0.1%) injected at the inflammatory site localized by scintigraphy. Treatment outcome was examined in terms of lessening of heel pain measured with a 100-point visual analogue scale (VAS) pain score, before and at 6 weeks after treatment. The treatment outcome was assessed as excellent or poor. Patients with improvement of VAS score equal or higher than 50% were graded excellent (treatment success) and those with scores of 0% - 50% poor (treatment failure). Improvement of 100% was considered “complete response” and 0% as “no response”.
Statistical Analysis
Statistical analysis was performed with medical statistical software (Demo mode). All values were represented as mean ± standard deviation. Comparison of means was used to compare mean values of VAS within the groups and the Mann–Whitney U test for comparison of mean VAS values between the groups. The chi-square test was used for comparison of demographic data between the two groups. P value of <0.05 was considered statistically significant.
Results
Average duration of heel pain in group A was 8.1
months (1-19 months) and in group B 7.2 months (3-17
months). Of the 15 feet in each group, 10 (67%) right and
5 (33%) left were affected in group A and 9 (60%) right
and 6 (40%) left in group B. The mean values of weight,
height and BMI were 67.5 ± 7.0 kg, 163.7 ± 6.1 cm and
25.2 ± 2.0, and 68.6 ± 6.0 kg, 166.0 ± 6.0 cm and 25.0 ± 2.8
in patients of group A and B respectively; the values were
not statistically different. The patients were in the
overweight category with respect to BMI. A calcaneal spur
was detected on the CT image of the SPECT/CT study in
the affected foot in 6 patients, 2 in group A and 4 in group
B.
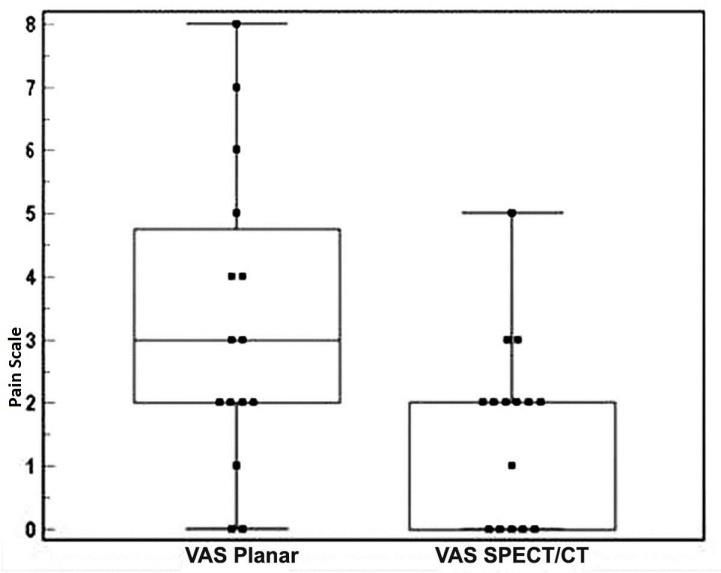
VAS values in group A (planar BS) were 7.4 ± 1.3 before
$$ t r e a t m e n t a n d 3. 3 \pm 2. 4 a f t e r t r e a t m e n t. T h e $$
corresponding values in group B (SPECT/CT BS) were 7.4
± 1.2 and 1.6 ±1.5. There was a statistically significant (P <
0.05) difference between the pre-injection and follow-up
values for VAS in both groups (Figure 2).
International Journal of Nuclear Medicine & Radioactive Substances
In both groups (A and B), no statistically significant difference in VAS scores was found between patients with focal calcaneal hyperemia (a) and diffuse blood-pool abnormalities (c) (P=0.37) or between the group with extension of hyperemia into the proximal fascia (b) and diffuse changes (c) (P = 0.5). However, significant difference was found between patients with focal hyperemia and diffuse blood-pool abnormalities. In both groups (A and B) there was no significant difference between patients with focal hyperemia and proximal 1/3 hyperemia. The results suggest that focal and proximal third involvement of the plantar fascia predicts good response to therapy, while patients with diffuse involvement respond poorly to therapy. Changes in pain scores in relation to the tracer uptake pattern in each group are detailed in Table 1.
| Group A | Group B | |||||||||||||||||||||||||
|---|---|---|---|---|---|---|---|---|---|---|---|---|---|---|---|---|---|---|---|---|---|---|---|---|---|---|
| Blood pool | Mean VAS | Mean VAS | ||||||||||||||||||||||||
| p | No. of | s | Improvement | No. of | Improvement | |||||||||||||||||||||
| pattern | I | Post- | Post- | |||||||||||||||||||||||
| atient | Baseline | (%) | patients | Baseline | (%) | |||||||||||||||||||||
| njection | Injection | |||||||||||||||||||||||||
| Focal calcaneal | 9 | 7.5 | 2.7 | 64% ± 34.7% | 7 | 7.1 | 0.9 | 89% ± 10.3% | ||||||||||||||||||
| Proximal 1/3rd plantar | 4 | 7 | 3.2 | 50% ± 20.1% | 5 | 8.6 | 2.4 | 69% ± 22.5% | ||||||||||||||||||
| Diffuse plantar | 2 | 9 | 5.5 | 40% ± 8.1% | 3 | 7.6 | 6 | 20% ± 14.4% |
Table 1: Changes in pain scores in relation to the tracer uptake pattern in each group. VAS = Visual Analogue Score.
Comparison of Values Between the Groups
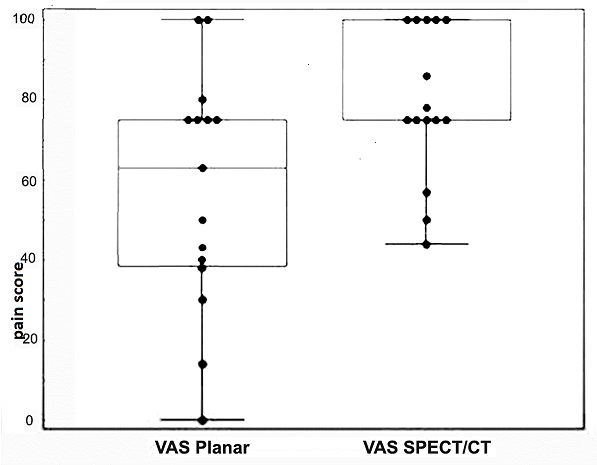
There was no statistically significant difference in the pre-injection VAS values between the two groups (P=0.98, MWU=-0.021). However, the follow-up VAS values showed a statistically significant difference between the groups (P=0.048, MWU=1.97) (Figure 3).
Discussion
PF accounts for symptoms of plantar heel pain in 80% of patients [3]. The peak age of incidence in the general population has been reported to be between 40 and 60 years [9]. The mean age of the patients in our study was 42 years in group A and 40 years in group B, which correlates with previous studies. There was no statistically significant difference between age groups found using P value (0.72 overall). Sixty percent of the patients in our study were aged between 40 and 60 years and showed an increased incidence of PF with increasing age. There is conflicting data in the literature in relation to gender distribution of plantar fasciitis with reports of female to male predominance of 3:1. However, several authors have reported the reverse, with males more commonly affected than females [20]. In our study, 10 of the 15 patients (67%) in group A were men and 5 (33%) were women; in group B, 8/15 (60%) were men and 7 (40%) were women with overall male to female preponderance of 3:2. PF is probably the result of multiple etiological factors. Body mass index (BMI) > 30 kg/m2 (the cutoff for grade-II obesity) had an odds ratio of 5.6 for PF compared to those with a BMI ≤ 25 kg/m2 [21]. In our study population, the average BMI in both the groups was slightly more than 25 kg/m2, corresponding to the overweight category in BMI classification.
International Journal of Nuclear Medicine & Radioactive Substances
Approximately one-half of patients diagnosed with PF have heel spurs, although it is unclear how much influence heel spurs actually have on the condition. One study reviewing the radiographs of 1,000 patients found 13.2 % had heel spurs; of these, only 39 patients (5.2% of the total sample) reported any history of sub-calcaneal pain [6]. In our study, 7 patients (23%) had calcaneal spurs on radiography with no correlation either with duration of pain or severity of symptoms. In a study by Dasgupta, et al. [10] 12 out of 15 patients (80%) of patients showed discrete uptake of [99mTc] MDP in the sub-calcaneal region. As in our study, all the patients (100%) with clinical suspicion of plantar fasciitis showed the specific appearance of delayed tracer uptake at the common calcaneal insertion of the plantar aponeurosis on bone scintigraphy. The palpation guided injection method has often been found inaccurate, necessitating multiple injections. Consequently, it has been claimed that this method is not always successful. In our study also, 8 out of 30 patients (27%) had previously undergone palpation guided steroid injection without any relief from pain. Clinical experience at the orthopedic clinic of our institute indicates that the beneficial effect of methylprednisolone injection in plantar fasciitis does not usually extend beyond 3 months. We therefore evaluated therapeutic response at 6 weeks after injection. The extent of blood-pool abnormalities may have an inverse relationship with the success rate of corticosteroid/local anesthetic injection in abolishing symptoms. Clayton, et al. [17] showed that critical evaluation of plantar blood- pool images provides prognostic information on the response to localized injection into the enthesis. Reporting such studies is simple and reproducible. In group A, 7/8 feet responding to injection showed focal hyperemia on blood pool images while one showed extension into the proximal third of the plantar fascia. All the patients in group A with diffuse hyperemia showed poor treatment response. In Group B, of the 12 feet responding to injection, 7 showed focal hyperemia on the blood pool images, 5 showed extension into the proximal third of the plantar fascia. 3 patients with diffuse hyperemia showed no significant treatment response. Focal calcaneal hyperemia is clearly associated with a high success rate for injection, with100% success rate for injection, extension of hyperemia into the proximal soft tissues being associated with a response in only 50% and diffuse hyperemia with no response.
In all reported studies till date, regardless of the method used, the VAS values show improvement after steroid injection. A study by Tsai et al showed an improvement from 6.0 to 1.8 for palpation-guided injection (PGI) and 6.1 to 2.1 for ultrasound-guided injection (UGI) [22]. Yucel, et al. showed improvement from 5.6 to 1.3 for UGI, 6.4 to 2.2 for PGI, and 4.9 to 0.8 for scintigraphy-guided injection (SGI) [23]. The present study showed a similar trend, demonstrating statistically significant differences between the pre-injection and follow-up VAS values in both groups using SGI (P < 0.05). While there was no statistically significant difference between pre-injection VAS values of the two groups, the corresponding post-injection values showed a significant difference. SPECT/CT guided steroid injection demonstrated a significantly better treatment outcome as compared to planar scintigraphy guided injection. Regardless of the intensity of uptake, the pattern of tracer uptake in the delayed phase did not predict response to or failure of therapy; this has been the finding in previous studies as well. We therefore did not use the delayed phase images to classify the responders in either of the groups.
Study Limitations
Obvious limitations of this study are the small number of patients compared in the two groups and the short period of follow-up. Also, no direct comparison was made between scintigraphy-guided and conventional palpation- guided steroid injection. However, localizing the site of steroid injection by [99mTc] MDP scintigraphy did provide definite patient benefit. A larger study comparing palpation guided and SPECT/CT guided steroid injection would be required to provide data with greater statistical significance.
Conclusion
The results of this study indicate that in patients with PF, determining the optimal site for steroid injection by [99mTc] MDP scintigraphy improves treatment outcome by localizing the inflammatory focus with greater precision. SPECT-CT appears to localize the optimal site for steroid injection more accurately than planar scintigraphy.
References
-
Baxter DE (1994) The heel in sport. Clin Sports Med 13: 683-693.
-
DeMaio M, Paine R, Mangine RE, Drez D Jr (1993) Plantar fasciitis. Orthopedics 16: 1153-1163. International Journal of Nuclear Medicine & Radioactive Substances
-
Schepsis AA, Leach RE, Gorzyca J (1991) Plantar fasciitis: etiology, treatment, surgical results, and review of the literature. Clin Orthop Relat Res 266: 185-196.
-
Cornwall MW, McPoil TG, Plantar (1999) fasciitis: etiology and treatment. J Orthop Sports Phys Ther 29(12): 756-760.
-
Wolgin M, Cook C, Graham C, Mauldin D (1994) Conservative treatment of plantar heel pain: long- term follow-up. Foot Ankle 15(3): 97-102.
-
Gibbon W, Long G (1997) Plantar fasciitis: US evaluation. Radiology 203: 290.
-
Baxter DE, Thigpen CM (1984) Heel pain: operative results. Foot Ankle 5(1): 16-25.
-
Bordelon RL (1983) Subcalcaneal pain: a method of evaluation and plan for treatment. Clin Orthop Relat Res 177: 49-53.
-
Gill LH (1997) Plantar fasciitis: diagnosis and conservative management. J Am Acad Orthop Surg 5(2): 109-117.
-
Dasgupta B, Bowles J (1995) Scintigraphic localization of steroid injection site in plantar fasciitis. Lancet 346: 1400-1401.
-
Sellman JR (1994) Plantar fascia rupture associated with corticosteroid injection. Foot Ankle Int 15(7): 376-381.
-
Ahstrom JP Jr (1998) Spontaneous rupture of the plantar fascia. Am J Sports Med 16: 306-307.
-
Intenzo CM, Wapner KL, Park CH, Kim SM (1991) Evaluation of plantar fasciitis by three-phase bone scintigraphy. Clin Nucl Med 16(5): 325-328.
-
Ozdemir H, Ozdemir A, Söyücü Y, Urgüden M (2002) the role of bone scintigraphy in determining the etiology of heel pain. Ann Nucl Med 16(6): 395-401.
-
O'Duffy EK, Clunie GP, Gacinovic S, Edwards JC, Bomanji JB, et al. (1998) Foot pain: specific indications for scintigraphy. Br J Rheumatology 37(4): 442-447.
-
Tudor GR, Finlay D, Allen MJ, Belton I (1997) The role of bone scintigraphy and plain radiography in intractable plantar fasciitis. Nucl Med Commun 18(9): 853-856.
-
Frater C, Vu D, Van der Wall H, Chandima Perera, Paul Halasz, et al. (2006) Bone scintigraphy predicts the outcome of steroid injection for plantar fasciitis. J Nucl Med 47: 1577-1580.
-
Horger M, Bares R (2006) the role of SPECT/CT In benign and malignant bone disease. Semin Nucl Med 36(4): 286-294.
-
Dolan AL, Ryan PJ, Arden NK , Stratton R, Wedley JR, et al. (1996) The value of SPECT scans in identifying back pain likely to benefit from facet joint injection. Br J Rheumatol 35(12): 1269-1273.
-
(2003) Al Fischer Associates, Inc. 2002 Podiatric practice survey. Statistical results. J Am Podiatr Med Assoc 93: 67-86.
-
Rano JA, Fallat LM, Savoy-Moore RT (2001) Correlation of heel pain with body mass index and other characteristics of heel pain. J Foot Ankle Surg 40(6): 351-356.
-
Tsai WC, Hsu CC, Chen CP, Chen MJ, Yu TY, et al. (2006) Plantar fasciitis treated with local steroid injection: comparison between sonographic and palpation guidance. J Clin Ultrasound 34(1): 12-16.
-
Yucel I, Yazici B, Degirmenci E, Erdogmus B, Dogan S (2009) Comparison of ultrasound-, palpation-, and scintigraphy guided steroid injection in the treatment of plantar fasciitis. Arch Orthop Trauma Surg 129(5): 695-701.
- Contribution of 18FDG PET in Atypical HORTON Disease
- Living Conditions, Healthy Practice and State of Households of a Town Rural in Colombia
- Background to the Health and Safety Regulation at Work in Colombia
- Risk Factors Psychology Workers Sena (Center for the Petrochemical Industry) Regional Bolívar, Colombia
- Diffuse Intense Pleural FDG Uptake with Smooth Thickening: A MARKER of Tuberculosis in Isolated Pleural Effusion
- Hypermetabolic Splenomegaly with Infarct in FDG PET/CT: A Clue to Scrub Typhus in PUO