Effect of Stocking Density on Survival and Growth of Endangered Elong, Bengala Elonga (Hamilton) in Nursery Ponds
Effect of stocking densities on the growth, survival and production of elong, Bengala elonga fry and finger lings were tested in a single-stage nursery rearing system. Physico-chemical parameters and plankton populations were at the optimum level for culture period. The experiment was conducted for a rearing period of 42 days in nine earthen nursery ponds having an area of 0.081 ha each. Four-day-old hatchlings stocked at 0.8, 1.0 and 1.20 millionha-1 were designated as treatment T1, T2 and T3. At stocking, all hatchlings were of same age with a mean length and weight of 0.90±0.02 cm and 0.001±0.00 g respectively. Highest weight gain was observed in treatment T1 and lowest in treatment T3. Final length, final weight and survival of fingerlings also followed the same trends as weight gain. Fingerlings in treatment T1 produced significantly higher specific growth rate than treatment T2 and T3. Feed conversion ratio was significantly higher in treatment T1 followed by treatment T2 and T3 in that order. Significantly higher number of fingerlings was produced in treatment T3 than in treatment T2 and T1, respectively. In despite of this, consistently higher net benefits were found from treatment T1 than from treatment T3 and T2 and also significant (P
Introduction
Bengala elonga is an indigenous cyprinid of Bangladesh which is locally known as elong in different places of Bangladesh. It is to be familiar with for its excellent taste and market value. Once, this fish was abundantly available in our open water system of rivers, cannals, beel, haors, streams and floodplains of Bangladesh. Like tropical cyprinids, it normally breeds in streams, rivers and floodplains. But due to various ecological changes and over exploitation in its natural habitat; this species is in the verge of extinction. Indiscriminate destructive practices have caused havoc to aquatic bio-diversity in Bangladesh [1]. According to Moyle and Leidy, 1992
worldwide 20% of all fresh water species are extinct, endangered or vulnerable [2]. International Union of Conservation of Nature (IUCN), Bangladesh (2000) enlisted B. elonga one of the endangered minor carps in Bangladesh [3]. So, development of proper nursing and rearing technique of fry and fingerlings of B. elonga is necessary to save this fish from extinction. The technology of breeding and nursery will be prevented this species from extinction and at the same time rural people will have an opportunity to catch and eat this delicious fish. This fish has enormous aquaculture potential and it could be easily grown in fish ponds along with other carp species. In order to do so, a huge quantity of fingerling of B. elonga would be required which could be met through successful rearing of fry and fingerlings. Therefore, a suitable culture method for nursing and rearing of B. elonga are very important to ensure reliable and regular supply of fingerlings. Improper care and lack of understanding about the biotic and abiotic factors in the rearing system may result in mass mortality of young fry [4]. Success in fry nursing depends on a good knowledge of nutritional and environmental requirement of the larvae in the open aquatic ecosystem [5]. To maintain this fish population as well as its conservation and rehabilitation, development of suitable technology for rearing and nursing of fry and fingerlings is very essential. Growth, survival and production of fry and fingerlings in nursery ponds depend on stocking density, type and quality of fertilizers and supplementary feeds. The present experiment has been undertaken to develop a practical and economically viable methodology for mass seed production and rearing of B. elonga under controlled nursery management system.
Materials and Methods
Study Area and Experimental Design
The study was carried out at the private nursery ponds of Fish Seed Farm, Shibpur, Gouripur, Mymensingh, Bangladesh. The experiment was conducted for a period of 42 days from July to August, 2016 in nine earthen nursery ponds with a surface area of 0.081 ha with an average depth of 0.9 meter. The ponds were having similar rectangular size, depth, basin conformation, contour and bottom type. Three treatments with three replicates each were designed and differing in stocking densities of hatchlings was employed. Stocking densities were 0.8 million (3.2 kg) ha-1 (treatment T1), 1.0 million (4.0 kg) ha-1 (treatment T2) and 1.2 million (4.8 kg) ha-1 (treatment T3).
Pond Preparation, Stocking and Fertilization
The ponds were dewatered, freed from aquatic vegetation, predatory animals, exposed to full sunlight and had a well designed system of inlet and outlet. After drying, quicklime (CaCO3, 250 kg/ha) was spread over the pond bottom. All the ponds were filled with ground water. Five days subsequent to liming, the ponds were fertilized with cowdung (organic manure) at the rate of 2470 kg.ha-
1). Seven days after manuring the pond water was sprayed with dipterex (1.0 ppm) to eradicate harmful insects and predatory zooplankton. The experimental ponds were stocked with 4 days old B. elonga having an initial length of 0.90±0.02 cm and weight of 0.001±0.00 g, respectively.
Fertilization
After stocking fry, all the ponds were fertilized with cow dung at the rate of 250 kg.ha-1, Urea 25.0 kg.ha-1and TSP 12.5 kg.ha-1 at weekly intervals to stimulate the primary productivity of the ponds throughout the experimental period.
Supplementary Feeding
In order to meet up the increasing dietary demand, a commercial fish feed, Saudi Bangla purchased from Saudi- Bangla Industrial Company, Bangladesh. In order to meet the increasing dietary demand, supplementary feed consisting of a mixture of mustard oilcake, rice bran, wheat bran, and fish meal in 40:25:25:10 proportions was supplied at the rate of 10-12% of their total biomass twice daily commencing from the first day of stocking. The rate of feeding was 24kg.million-1 hatchling.day-1 for the first one week, 28 kg for the second 2 weeks, 32 kg for the third 2 weeks and 36 kg for the fourth two weeks. Proximate composition of the feeds was analyzed according to AOAC (1995) method, nitrogen free extract (NFE) by subtraction. Proximate composition (% dry matter) of the supplementary feeds (crude protein, crude lipid, Crude fiber, ash and Nitrogen-free extract) of experimental feeds was 32.21%, 7.70%, 10.19%, 18.16% and 31.74%, respectively. Feeds were supplied to the fish twice daily in the morning and afternoon commencing from the first day of stocking. Daily ration was adjusted by estimating the standing crop once in each week by random sampling of the stock.
Water Quality Parameters
Physico-chemical parameters of pond water were monitored weekly between 9.00 and 10.00 h. Water temperature was recorded using a Celsius thermometer and transparency (cm) was measured by using a Secchi disc of 20 cm diameter. Dissolved oxygen and pH were measured directly using a digital electronic oxygen meter (YSI, Model 58, USA) and an electronic pH meter (Jenway, Model 3020, UK). Total alkalinity was determined by titrimetric method [6].
Plankton Monitoring
Quantitative and qualitative estimates of plankton in the nursery ponds were taken weekly. Water from different locations and depths of each pond were collected and filtered through fine-meshed plankton net (0.04 mm) to obtain a 50 ml sample. The samples were preserved immediately with 5% buffered formalin in plastic bottles. Plankton density was estimated by using a sub-sampling technique. A Sedgwick-Rafter (S-R) cell was used under a calibrated compound microscope for plankton counting. Plankton count (number of cells per liter of water sample) was made using the formula proposed by Rahman and Stirling [7, 8].
Estimation of Growth, Survival, Production and Feed Utilization
Total yield (kg) and number of B. elonga harvested from each pond were recorded. Twenty percent of the population from each pond was randomly sampled and individually weighed and measured for total length (TL) with the help of a portable sensitive balance (Model HL 400 EX) and a measuring scale until they attained marketing size. Growth in terms of weight, Average daily gain (ADG), Specific Growth Rate (SGR) and Food conversion ratio (FCR) was estimated. SGR and FCR were calculated according to Brown; Castell and Tiews and Gangadhara et al., respectively [9, 10, 11]. After 42 days, the fingerlings were harvested by repeated netting, followed by draining or drying the ponds. Both the number of species were counted and weighed. Survival (%) and production (number.ha-1) of fingerlings were then calculated and compared among the treatments.
Economic Analysis
The cost analysis was in terms of hectare to maintain a standard unit. In calculating the cost, the variable (only material inputs) was used. The gross return from the pond was the sale proceeds of the total fish production.
Analysis of Experimental Data
The data were analyzed through one way analysis of variance (ANOVA) using MSTAT followed by Duncan’s New Multiple Range test to find out whether any significant difference existed among treatment means [12, 13]. Standard deviation in each parameter and treatment was calculated and expressed as mean ±S.D. In all statistical analysis, the difference was considered to be significant when P < 0.05.
Results
Water Quality Parameters
Mean levels of physico-chemical parameters over the 42 days nursing of fry and fingerlings are presented in Table1. The mean water temperatures in treatment T1, T2 and T3 were not statistically significant (P>0.05). Mean Secchi disk transparency was recorded suitable range in the treatment T1 (27.62±4.16 cm) and differed
| Treatment | |||||||||||
|---|---|---|---|---|---|---|---|---|---|---|---|
| Parameter | |||||||||||
| T 1 | T 2 | T 3 | |||||||||
| Temperature (0C) | 29.48±2.77 | 29.55±2.616 | 29.35±2.44 | ||||||||
| (26.18-31.15) | (26.44-31.25) | (26.20-31.12) | |||||||||
| Transparency (cm) | 27.62±4.16a | 34.20±5.04b | 40.66±5.88c | ||||||||
| (24.05-31.60) | (31.34-39.22) | (38.54-45.48) | |||||||||
| pH | 7.77±0.15 | 7.71±0.19 | 7.75±0.16 | ||||||||
| (7.42-8.12) | (7.62-8.05) | (7.47-8.00) | |||||||||
| Dissolved oxygen (mg/L) | 5.02±0.85 | 4.90±0.56 | 3.98±0.88 | ||||||||
| (4.10-5.52) | (4.54-5.20) | (3.16-4.18) | |||||||||
| Total alkalinity (mg/L) | 133.16±8.05a | 127.45±7.04b | 120.35±8.14c | ||||||||
| (118.35-141.55) | (122.04-131.68) | (110.11-126.48) |
Table 1: Physico-chemical characters of water in the earthen nursery ponds during the experimental period. Figure in the same row
Significantly (P< 0.05) among different treatments. The highest pH was recorded in treatment T1 (7.77±0.15) and pH decreased from T1 to T3 but did not differ significantly (P>0.05). Highest range of dissolved oxygen was recorded in treatment T2 (5.02±0.85 mg.l-1) and lowest range of dissolved oxygen was recorded in treatment T3. However, there were no significant variations (P>0.05) in the value of dissolved oxygen among the different treatments. Total alkalinity was found to be highest in treatment T2 (133.16±8.05 mg.l-1) and lowest in treatment T3 (120.35±8.14 mg.l-1) and differ significantly (P<0.05). Suitable range of total alkalinity was recorded in different treatment. Despite these variations, water quality parameters in all the experimental treatments were within the normal range for fish culture (Table 1).
Plankton Enumeration
From the Table 2, it was found that the quantity of phytoplankton and zooplankton found in treatment T1 (314.77±54.86 and 118.04±26.23) ml-1 stocked at 0.8 million spawn.ha-1, T2 (278.69±49.67 and 89.30±22.70) ml-1 stocked at 1.0 million spawn.ha-1 and T3 (241.01±45.27 and 73.89±18.61) ml-1 stocked at 1.2 million spawn.ha-1, respectively. Twenty nine genera of phytoplankton recorded in four groups viz. Chlorophyceae, Bacillariophyceae, Cyanophyceae and Euglenophyceae. The mean abundance of total phytoplankton of T1 was significantly higher (P<0.05) than those of T 2 and T3. The zooplankton population consisted of 12 genera including nauplii in two groups viz. Crustacean and Rotifera. Rotiferans were dominant over the entire experimental periods in all treatments. The abundance of zooplankton differed significantly (_P<_0.05), decreasing from T1 to T3.
| Treatment | |||||||||||
|---|---|---|---|---|---|---|---|---|---|---|---|
| Plankton group | |||||||||||
| T 1 | T 2 | T 3 | |||||||||
| Plankton (cell/ml×103) | |||||||||||
| Chlorophyceae | 135.54±7.16a | 118.28±5.22b | 108.16±4.41c | ||||||||
| (127.35-148.24) | (113.41-125.98) | (99.22-115.32) | |||||||||
| Bacillariophyceae | 103.26±3.44a | 96.88±4.84b | 82.50±3.08c | ||||||||
| (97.45-106.22) | (92.68-101.60) | (76.34-88.62) | |||||||||
| Cyanophyceae | 68.64±3.11b | 58.45±3.62a | 46.34±2.28c | ||||||||
| (64.18-72.35) | (52.22-62.66) | (41.22-49.42) | |||||||||
| Euglenophyceae | 7.33±1.02b | 5.08±0.88a | 4.01±0.56c | ||||||||
| (6.12-10.22) | (4.18-7.60) | (3.50-6.74) | |||||||||
| Total Phytoplankton | 314.77±54.86a | 278.69±49.67b | 241.01±45.27c | ||||||||
| Zooplankton (organism/ml×103) | |||||||||||
| Rotifera | 55.60±2.78a | 47.26±2.66b | 38.23±2.55c | ||||||||
| (52.04-58.18) | (43.96-49.28) | (34.28-42.52) | |||||||||
| Crustaceae | 46.22±1.24a | 37.92±1.1b | 32.24±2.029c | ||||||||
| (43.22-46.95) | (34.84-39.45) | (30.12-36.33) | |||||||||
| Others | 6.22±1.06a | 4.12±1.22b | 3.42±0.75c | ||||||||
| (5.66-9.22) | (3.05-5.25) | (2.78-4.62) | |||||||||
| Total Zooplankton | 118.04±26.23a | 89.30±22.70b | 73.89±18.61c |
Table 2: Average variation of phytoplankton and zooplankton population under different treatments. Figure in the same row having
Growth, Feed Utilization and Production of Fish
The growth and production of fingerlings in term of gain in number and weight under three treatments were investigated and monitored weekly. The results obtained are presented in Table 3 and figures 1 & 2 which indicated that the growth in terms of number and weight showed much variation in each treatment and continued till final harvesting. During the investigation, final weight of B. elonga was recorded to be 70.55±4.05, 55.44±5.41and 35.60±5.88 g in treatment T1, T2 and T3, respectively. The increase in weight B. elonga was the highest in T1
followed by T2 and T3, respectively. The initial length and weight (0.90±0.02 cm and 0.001 g) of spawn stocked in all the ponds was the same. The fingerlings in treatment T1 showed the highest gain in length and weight (7.01±2.22 cm and 70.55±4.05 g) compared to the treatments T2 and T3, where stocking density of fingerlings was 0.80million.ha-1.
| Treatments | |||||||||||
|---|---|---|---|---|---|---|---|---|---|---|---|
| Parameters | |||||||||||
| T 1 | T 2 | T 3 | |||||||||
| Initial length (cm) | 0.90±0.02 | 0.90±0.02 | 0.90±0.02 | ||||||||
| (0.88-0.94) | (0.88-0.94) | (0.88-0.94) | |||||||||
| Final length (cm) | 7.01±2.22a | 5.80±2.48b | 4.60±2.88c | ||||||||
| (6.88-6.32) | (4.90-5.25) | (3.80-4.94) | |||||||||
| Initial weight (g) | 0.001±0.001 | 0.001±0.001 | 0.001±0.001 | ||||||||
| (0.0009-0.0014) | (0.0009-0.0014) | (0.0009-0.0014) | |||||||||
| Final weight (g) | 70.55±4.05a | 55.44±5.41b | 35.60±5.88c | ||||||||
| (68.05-74.55) | (52.28-60.62) | (36.80-42.55) | |||||||||
| Net weight gain (g) | 70.549±4.01a | 55.439±5.08b | 35.599±5.34b | ||||||||
| (68.08-74.44) | (52.10-60.54) | (32.01-39.28) | |||||||||
| Average daily gain(g) | 1.68±0.02a | 1.32±0.03b | 0.85±0.03c | ||||||||
| (1.54-1.1.74 | (1.26-1.40) | (0.78-0.90) | |||||||||
| Specific growth rate | 20.70±0.23a | 20.46 ±0.32b | 20.02±0.016c | ||||||||
| (19.02-21.18) | (19.05-21.08) | (19.01-20.94) | |||||||||
| Survival rate (%) | 80.40±0.72a | 71.02±0.88b | 60.72±0.92c | ||||||||
| (79.86-81.90) | (71.77-73.78) | (66.80-69.44) | |||||||||
| FCR | 0.79±0.01a | 0.91± 0.01b | 1.0±0.01c | ||||||||
| (0.75-0.85) | (0.88-0.96) | (0.95-1.04) | |||||||||
| Production#/ha | 643200±664.12a | 710200±701.43b | 728640±841.75c | ||||||||
| (580,608-687,206) | (679,564-791,188) | (698,825-846,906) | |||||||||
| Production (kg)/ha | 45377.12±46.34a | 39372.78±64.12b | 25938.86±84.12c | ||||||||
| (42592.24-47176.14) | (37222.56-40420.54) | (224822-27155.66) |
Table 3: Growth performance, survival and production of _Bengala elonga_ fry or fingerlings after six weeks of rearing; mean ± S.
Table 3: Growth performance, survival and production of Bengala elonga fry or fingerlings after six weeks of rearing; mean ± S.D. with ranges in parentheses. Figure in the same row having the same superscript are not significantly different (P>0.05). Values in the parenthesis indicate the range. # Total number of fingerlings harvested after 42 days. Average daily gain (g) = (mean final weight-mean initial weight) / time interval (days). Specific growth rate (SGR)=Ln mean final weight-Ln mean initial weight)/time interval (days)× 100. FCR (Food conversion ratio) = Total diet fed (kg)/ total wet weight gain (kg).
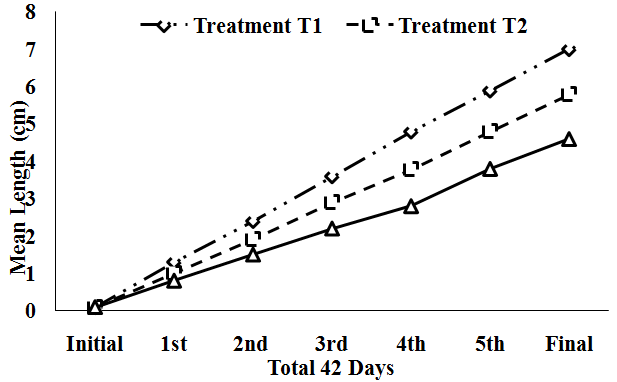
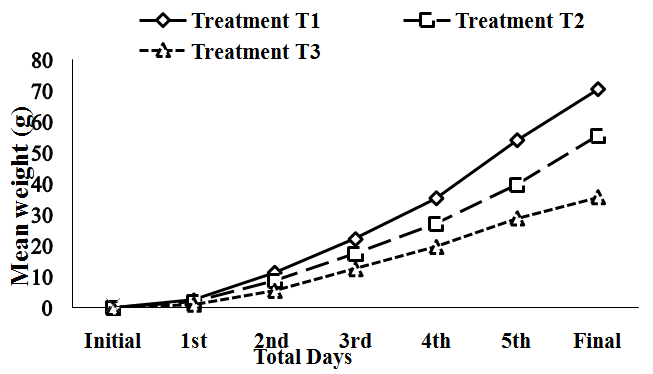
Figure 2: 7 day’s interval mean weight (g) gain of fry Bengala elonga under different density. However, the mean final weights of fingerlings in different treatments were significantly different (P<0.05). SGR in treatment T1 was significantly higher than in T2 and T3 (P<0.05). Food conversion ratio was significantly lower in T1 than T2 and T3. Therefore, best SGR and FCR were recorded in treatment T1 where lowest number of fingerlings of B. elonga was reared. The highest survival rate was also observed in T1 and the lowest in T3. There was a significant variation (P < 0.05) in the survival rate in B. elonga individuals among different treatments. The net productions of fingerlings were 643,200# (45377.12±46.34 kg), 720,500# (39372.78±64.12 kg) and 728640# (25938.86 kg) ha-1.days-42 in treatment T1, T2 and T3, respectively. Total production of fingerlings was recorded to be higher in treatment T1 and lowest in treatment T3. On the other hand, highest number of fingerlings was stocked in treatments T3, where lowest production was recorded and differed significantly (P < 0.05) from T1 and T2. The mean productions (number.ha-1) of fingerlings were 643200, 720,500 and 776,640 in treatment T1, T2 and T3, respectively. Production in number was highest in treatment T3 and lowest in treatment T1. Total productions (kg.ha-1) of fingerlings were found to be 3922.88, 3277.56 and 2391.28 kg in treatment T1, T2 and T3, respectively. Highest production was recorded higher in treatment T1, and lowest in treatment T3. However, production of fingerlings differ significantly (P<0.05) among the three treatments (Table 3). On the other hand, cost of production in treatment T1 was consistently lower than those treatments T2 and T3 (Table 4). Highest net benefit (in term of Bangladeshi Tk.ha-1 and one US$ = Bangladeshi TK. 79.00) was obtained in treatment T1 (483330.00) followed by T2 (234119.00) and T3 (1910.00) in that order.
| Amount TK•ha-1•month-2 | ||||||||||||||
|---|---|---|---|---|---|---|---|---|---|---|---|---|---|---|
| Item | T | reatment T | 1 | Treatment | Treatment | Remarks | ||||||||
| (Tk)a | T (Tk) 2 | T (Tk) 3 | ||||||||||||
| Total return (TR)b | 771840 | 568160 | 364320 | Price is related with size and weight | ||||||||||
| a. Variable cost: | ||||||||||||||
| 1. Price of hatchlings | 75000 | 86000 | 95000 | |||||||||||
| 2. Feed 1(Tk. 40.00/kg) | 104480 | 132800 | 148480 | |||||||||||
| 3. Fertilizer | 8112 | 8112 | 8112 | |||||||||||
| 4. Human labour cost | 16800 | 16800 | 16800 | 02 labour day-1 | ||||||||||
| (Tk.200.00/day) | ||||||||||||||
| 5. Chemicals | 4208 | 6280 | 7390 | |||||||||||
| 6. Miscellaneous | 20000 | 20000 | 20000 | With netting | ||||||||||
| Total Variable cost (TVC) | 228600 | 269992 | 295782 | |||||||||||
| b. Fixed cost : | 37050 | 37050 | Tk. 200.00 dec.-1 according to local rate, Mymensingh | |||||||||||
| 1.Pond rental value | 37050 | |||||||||||||
| 2.Interest of operating capital | 22860 | 26999 | 29578 | 10% interest according to BKB, Bangladesh | ||||||||||
| Total fixed cost (TFC) | 59910 | 64049 | 66628 | |||||||||||
| Total cost | 288510 | 334041 | 362410 |
Table 4: Cost and benefits from the nursing of _Bengala elonga_ fingerlings in 1-ha earthen ponds for a nursing period of 7 weeks
| (TC= TVC+TFC) | ||||
|---|---|---|---|---|
| Gross margin | 543240 | 298168 | 68538 | |
| (GM= TR-TVC) | ||||
| Net return (TR-TC) | 483330 | 234119 | 1910 |
Table 5: Cost and benefits from the nursing of _Bengala elonga_ fingerlings in 1-ha earthen ponds for a nursing period of 7 weeks
Table 4: Cost and benefits from the nursing of Bengala elonga fingerlings in 1-ha earthen ponds for a nursing period of 7 weeks. BKB= Bangladesh Krishi Bank Figures with different superscripts in the same row varied significantly (P<0.05). Figures in the parenthesis indicate range. a1 US$ =Tk. 79.00 bSale price Tk.1.20/fingerling; (T1), Tk.0.80/fingerling; (T2) and Tk.0.50/fingerling (T3).
Discussion
The environmental parameters exert an immense influence on the maintenance of a well aquatic environment and production of food organisms. Growth, feed efficacy and feed consumption of fish are normally governed by a few environmental factors [14]. The primary productivity of water body is dependent on physico-chemical factors of water, which are governed by environmental factors. The temperature of the experimental ponds was within the acceptable range for nursery ponds that agrees well with the findings of Kohinoor et al. [15] and Chakraborty et al. [16].Transparency was consistently higher in T3, possibly due to the reduction of the plankton population by higher density of fish [17, 18]. The close variation in transparency might be due to application organic manure and grazing pressure of stocked fishes. The pH values agree well with the findings of APHA 1998, Chakraborty et al, Rahman and Rahman and Chakraborty and Mirza [19, 20, 21, 22]. The dissolved oxygen in the morning was low in ponds stocked with a high density of fish compared to ponds stocked with a low density. Similar results were observed by Boyd [23]. APHA, Wahab et al. and Rahman and Rahman [19, 24, 21]. Alkalinity levels indicate productivity of the ponds was medium to high [25]. Higher total alkalinity values might be due to application of higher amount of lime doses during the experimental period [19, 23, 26]. In the present study the quantity of both phytoplankton and zooplankton was inversely related with the stocking density of fry. The quantity of phytoplankton and zooplankton was higher in T1 treatment where stocking density of spawn was low. The phytoplankton abundances were consistently higher than that of zooplankton. Similar results were also recorded in various food fish and fry/fingerling rearing ponds [24, 27, 28]. Higher phytoplankton concentrations in pond water normally indicate higher productivity. The higher abundance of phytoplankton compared to zooplankton might be due to regular fertilization and excess uneaten feed [29]. In this experiment, crude protein levels (32.88% dry weight) in supplementary feeds are very near the dietary protein of 31% for the optimal growth of B. elonga [30]. Growth in terms of length, weight, weight gain and SGR of fingerlings of B. elonga was significantly higher in T1 where the stocking density was low compared to those of T2 and T3 although same food was supplied in all the treatments at an equal ratio. The low growth rate B. elonga in treatment T2 and T3 appeared to be related with higher densities and increased competition for food and space and an inverse relationship with in the stocking density provided that space-limiting effects operate on the population [31, 32, 21, 33]. In this experiment, at higher stocking densities, presence of abundant food substances could produce a comparative interaction among the population causing a stressful situation [34]. During the experimental period, ecological factors, pond preparation, feed quality, healthy fish and stocking rate was influenced the high percentage of survival rate of B. elonga [35]. Highest survival rate was recorded in treatment T1 [36, 33, 16, 22]. The FCR values of T1 are significantly lower than those T2 and T3, respectively. The FCR values are reported by Das and Ray and Islam [37, 22]. De Silva and Davy stated that digestibility plays an important role in lowering the FCR value by efficient utilization of food [38]. Digestibility, in turn, depends on daily feeding rate, frequency of feeding, and type of food used [39]. However the lower FCR value in the present study indicates better food utilization efficiency, despite the values increased with increasing stocking densities. Significantly higher survival was noted in treatment T1, where, the stocking density was lower than T2 and T3. The reason for reduced survival rate in these treatments was due to higher stocking density of fry as well as competition for food and space in the experimental ponds [40, 18, 15, 21, 33]. In the present study, a significant higher number of fingerlings were produced in pond stocked with 0.80 million hatchlings. ha-1 than those of from the treatment T1 and T2 stocked with 1.0 and 1.20 million hatchlings.ha-
1, respectively. Despite this, consistently higher net benefits were obtained from ponds stocked with 0.80 million hatchling. ha-1 than those from the treatment T2 and T3. The higher market price of the larger fingerlings (suitable for stocking in grow-out ponds) produced in ponds with 0.80 million hatchling/ha, substantially increased the net benefit compared to smaller fingerlings that produced in other ponds with higher stocking densities. Overall, highest growth, survival and benefits of fingerlings were obtained at a density of 0.80 million hatchling/ha. Growth of fingerling to a greater extent depended on the quality and quantity of food available. In the present investigation, the amount of supplementary feeds given in different treatments was based on the number of hatchlings stocked and amount of feed provided per individual was kept at the same level. Hence, the observed low growth at higher stocking densities could be due to less availability of natural food and some variations in environmental parameters [22]. The results in the present experiment are very similar to those of Munshi, Kohinoor et al., Vijayakumar et al., Rahman and Rahman, Usmani et al. and Chakraborty et al. [28, 21, 16, 41, 42, 43]. Finally, it can be concluded that the survival, growth, production of B. elonga fingerlings were inversely related to the stocking densities of hatchlings. Stocking density of 0.06 million hatchlings/ha may be advisable for rearing of B. elonga fingerlings for 7 weeks in single-stage nursing. Production of adequate quality seeds through application of our present findings might be extremely helpful towards the protection of elong from extinction as well as for its conservation and rehabilitation.
References
-
Hussain MG, Mazid MA (2001) _Genetics_ _Improvement and Conservation of Carp_ Species in Bangladesh. Bangladesh Fisheries Research Institute, Mymensingh, pp: 56.
-
Moyle PL, Leidy RA (1992) Loss of biodiversity in aquatic ecosystem: Evidence from Fish Fauna. _In_ Fielder PL, Jani HL (eds) Conservation of biology: the theory and practice of nature conservation, preservation and management. Chapman and Hall, New York, pp: 562.
-
Munjurul Hannan Khan SM, Monirul H, Rashiduzzaman A, Nargis BJ, Shameem P, et al. (2000) Red book of threatened fish of Bangladesh, The world conservation Union Appendix 1, IUCN, Bangladesh, pp: 61.
-
Jhingran VG, Pullin RSV (1985) A hatchery manual for the common carp, Chinese and Indian majors carps. ICLARM studies and reviews, III, pp: 191.
-
Mollah MFA (1985) Effects of stocking density and water depth on growth and survival of fresh water cat fish (_Claias macrocephalus_) larvae. Indian J Fish 32: 1-17.
-
Clesceri LS, Greenberg AE, Trussell RR (1989) Standard Methods of the Examination of Water and Wastewater 17th (Edn.) American Public Health Association, American Water Works Association and Water Pollution Control Federation, 1015 Washington DC, USA 20036, pp: 10-203.
-
Rahman MS (1992) Water quality management in Aquaculture BRAC prokashana, Dhaka, Bangladesh, pp: 84.
-
Stirling HP (1985) Chemical and Biological Methods of Water Analysis for Aquaculturist_._ Institute of Aquaculture, University of Stirling, Scotland, UK, pp: 119.
-
Brown ME (1957) Experimental studies on growth. In: The physiology of fishes. Brown ME (Ed), Academic Press, New York, 1: 361-400.
-
Castell JD, Tiews K (1979) Report of the EIFAC, IUNS and ICES Working Group on the Standardization of Methodology in Fish Nutrition Research, Hamburg, Federal Republic of Germany, EIFAC Tech, pp: 26.
-
Gangadhara B, Nandeesha MC, Varghese TJ, Keshavanath P (1997) Effect of varying protein and lipid levels on the growth of Rohu, _Labeo rohita_. Asian Fish Sci 2: 139-147.
-
Duncan DB (1955) Multiple range and multiple _F_- testes. Biometrics 11: 1-42.
-
Zar JH (1984) _Biostatistics_. Prentice-Hall, Inc. Englewood Cliffs, New Jersey, USA, pp: 718.
-
Brett JR (1979) Environmental factors and growth. In: Hoar WS, Randal DJ, Brett JR (Eds.) Environmental relations and behavior, Fish Physiology (vol 6) Academic press, New York, pp: 599-677.
-
Kohinoor AHM, Haque MZ, Hussain MG, Gupta MV (1994) Growth and survival of Thai punti, Puntius gonionotus (Bleeker) spawn in nursery ponds at different stocking densities. J Asiat Soc Bangladesh Sci 20: 65-72.
-
Chakraborty BK, Miah MI, Mirza MJA, Habib MAB (2005) Growth, Yield and Returns to _Puntius sarana_ (Hamilton) Sarpunti, in Bangladesh under Semi intensive Aquaculture. Asian Fish Sci 18(2005): 307-322.
-
Haque MZ, Rahman MA, Hossain MM (1993) Studies on the effect of stocking densities on the growth and survival of mrigal (_Cirrhinus mrigala_) fry in rearing ponds. Bangladesh J Zool 21(1): 51-58.
-
Haque MZ, Rahman MA, Hossain MM, Rahman MA (1994) Effect of stocking densities on the growth and survival of mirror carp, _Cyprinus carpio_ var. _specularis_ in rearing ponds. Bangladesh J Zool 22: 109-116.
-
APHA (1998) Standard methods for the examina- tion of water and wastewater, 20th (edn), American Public Health Association, Washington, DC, pp: 141.
-
Chakraborty BK, Miah MI, Mirza MJA, Habib MAB (2003) Rearing and nursing of local sarpunti, _Puntius sarana_ (Hamilton) at different stocking densities. Pakistan J of Biological Sci 6(9): 797-800.
-
Rahman MR, Rahman MA (2003) Studies on the growth, survival and production of calbasu (_Labeo_ _calbaus_ Ham.) at different stocking densities in primary nursing. Bull Fac Sci Unv Ryuyus Jpn 76: 245-255.
-
Chakraborty BK, Mirza MJA (2007) Effect of stocking density on survival and growth of endangered bata, Labeo bata (Hamilton-Buchanan) in nursery ponds. Aquaculture 265: 156-162.
-
Boyd CE (1982) Water Quality Management for Pond Fish Culture. Elsevier, The Netherlands, pp: 318.
-
Wahab MA, Ahmed ZF, Haq MS, Begum M (1994) Compatibility of silver carp in the polyculture of cyprinid fishes. Progress, Agric 5: 221-227.
-
Bhuiyan RR (1970) Physico-Chemical qualities of some ancient tanks of Sibsagar, Assam. Environ Health 12: 129-134.
-
Jhingran VG (1991) Fish and Fisheries of India, 3rd (edn.) Hindustan Publishing Corporation Delhi, India.
-
Haque MS, Wahab MA, Wahid MI, Haq MS (1998) Impacts of a Thai silver barb (_Puntius gonionotus,_ Bleeker) inclusion in the polyculture of carps. Bangladesh J Fish Res 2(1): 15-22.
-
Kohinoor AHM, Islam MS, Begum N, Hussain MG (1999) Production of Thi sharpunti (_Puntius_ _gonionotus_ Bleeker) in polyculture with carpsusing low cost feed. Bangladesh J Fish Res 3(2): 77-83.
-
Keshavanath P, Gangadhar B, Ramesh TJ, VanRooij JM, Beveridge, et al. (2002) The effects of periphyton and supplemental feeding on the production of the indigenous carps _Tor khudree_ and _Labeo fimbriatus_. Aquaculture 213: 207-218.
-
De Silva SS, Gunasekera RM (1991) An evaluation of the growth of Indian and Chinese major carps in relation to the dietary protein content. Aquaculture 92: 237-241.
-
Johnson WE (1965) On mechanism of self regulation of population abundance in Oncorhynchus nerka. Mitt Int Verein Theor Angew 13: 66-87.
-
Islam MS (2002) Evaluation of supplementary feeds for semiintensive pond culture of Mahaseer, _Tor_ _putitora_ (Hamilton). Aquaculture 212: 263-276.
-
Chakraborty BK, Miah MI, Mirza MJA, Habib MAB (2006) Rearing and nursing of endangered sarpunti, _Puntius sarana_ (Ham.) with tree supplementary feeds. J Asiat Bangladesh sci 32(1): 33-41.
-
Houde ED (1975) Effect of stocking density and food density on survival, growth and yield of laboratory reared of sea Brea, _Archosargus_ _rhomboidales_ (L.) (Sparidae). J Fish Biol 7: 115-127.
-
Choudhury H, Rao NGS, Saha GN, Rout M, Ranaujia DR (1978) Record fish production through intensive fish culture in a farmer’s pond. J Inland Fish Soc India 10: 19-27.
-
Munshi JSD (1996) Ecology of _Heteropneustes_ _fossilis_, an air-breathing catfish of South-east Asia. Narendra Publishing House, Delhi, India, pp: 174.
-
Das I, Ray AK (1989) Growth performance of Indian major carps _Labeo rohita_ (Ham.) on duckweed incorporate pelleted feed: a preliminary study. J Inland Fish 211: 1-6
-
De Silva SS, Davy FB (1992) Fish nutrition research system in Asia. Asian Fish Sci 5: 129-144.
-
Chiu YN, Sumagaysay NS, Sastrillo MGS (1987) Effect of feeding frequency and feeding rate on the growth and feed efficiency of milk fish, _Chanos_ _chaqnos_ (Forskal) Juveniles. Asian Fish Sci 1: 27-31.
-
Tripathi SD, Dutta A, Sen Gupta KK, Pattra S (1979) High density rearing of rohu spawns in village ponds. In: Symosium of Inland Aquacult. CIFRI. Barrack pore, pp: 14.
-
Vijayakumar C, Sridhar S, Haniffa MA (1998) Low cost breeding and hatching techniques for the catfish _Heteropnuestes fossilius_ for small-scale farmers. NAGA 21 (4): 15-17.
-
Usmani N, Jafrim AK, Khan MA (2003) Nutrient digestibility studies in Heteropneustes fossilis (Bloch), Clarias batrachus (Linnaeus) and _Clarias_ _gariepinus_ (Burchell). Aquaculture Res 34(14): 1365-2109.
-
Association of Official Analytical Chemists (AOAC) (1984) In: Howritz W, (Ed.), Official Methods of Analysis, 14th (Edn.) AOAC, Washington, DC, pp: 1018.
- Genetic Improvement of Nile Tilapia (Oreochromis niloticus): Advances in Selective Breeding and Genomic Approaches for Sustainable Aquaculture
- Microplastics, Contaminants, and Waste Hotspots: Divergences and Faults in Prioritizing Control Efforts
- Creating a Healthier, More Vibrant Open and Closed Aquatic Environment. A Submersible, Centrifugal Magnetically Affixed Current Changing Aquarium Pump
- An Attempt to Assess Alpha Diversity and Sample Size: Using the Ostracod Assemblages off Kumamoto Port, Japan
- Assessment of the Efficiency of Common Fishing Gears and Crafts Used at Mohananda River of Chapai Nawabganj, Bangladesh
- Fish Productivity and Biodiversity Status of Sundarban Mangrove in Bangladesh