Water in Atmosphere and Earth and Atmospheric Electricity
Atmospheric moisture plugs a near-surface pore space. Evaporating moisture increases neutral condensation nucleus density in the surface air that leads to an increase in the atmospheric electric field. Industrial use of confined waters minimizes the atmosphere-soil air exchangeand an increase in the atmospheric electric field. The change in perched water levels, including variations in atmospheric pressure controls the soil radon exhalation. The pressure drop by thousandths will increase the exhalation of soil radon by more than an order of magnitude. The vertical conductance current can be compared with precipitation currents in the powerful negative fields of a cumulonimbus cloud.
Introduction
The space charge of the surface air is due to the origin of ionization by exhaling soil radon [1, 2, 3]. The high molecular weight of radon Rn222 makes its isolated sub vertical migration not possible. Traditionally, the transfer of the ionizer is believed to happen due to bubble formations of all volatile gases and water vapour [4, 5, 6]. The recent experimental results indicate the only possibility of ionizer transport by hydrogen and methane [7, 8]. These bubbles of the two volatile gases exhale radon to the near-surface layers of the soil and to the atmosphere by the soil space from a depth of 4-6 m. In the ionization cycle a pair of light ions is produced, which determines the polar conductivities of atmospheric air; recombination of light ions with neutral condensation nuclei leads to the formation of heavy ions, which determine the atmospheric electric field (AEF). Atmospheric moisture (precipitation, dew) will plug the near-surface pore space, thereby preventing radon transport into the atmosphere.
The dynamics of aquifers primarily perched and ground water will control the soil-atmosphere air exchange process. Raising aquifer levels will extrude the soil air, including soil radon, into the atmosphere; declining levels will cause the reverse effects. Let us consider a series of experimental studies illustrating the effect of atmospheric moisture and aquifers on the exhalation of soil radon on elements of surface atmospheric electricity.
The Influence of Atmospheric Moisture on the Surface Atmospheric Electricity
During the field research performed in the Stavropol Territory in June 2005, the stability of the AEF was monitored. The climate of the Stavropol Territory allowed for observations in 'good weather' conditions [9, 10], when a parameter to be monitored was just slightly varying. However, according to the practice total calmness and the absence of clouds do not always provide a local weak meteorological effect on AEF diurnal variations, Figure 1. In the time interval of 10h32m-11h07m, June 09, 2005,a stationary gauss meter has recorded an intense field outburst observed between the counts 10h34m – 10h54m.The average background level of the field is ~ 90 V/m, the maximum amplitude of the burst is ~ 150 V/m. To demonstrate normal background variation of the field at a stationary observation point, the plot is provided in two scales, large-scale E (z) and small-scale E1 (z).
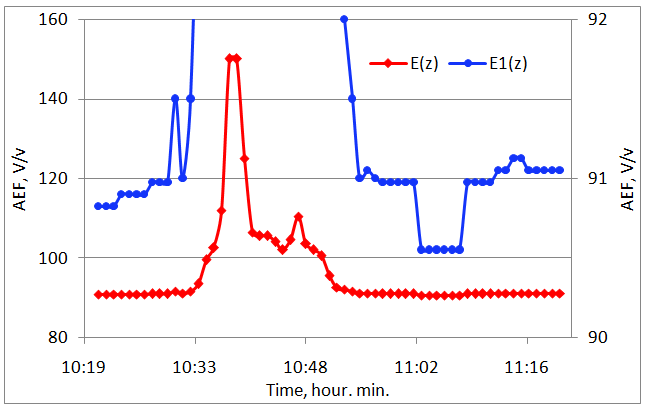
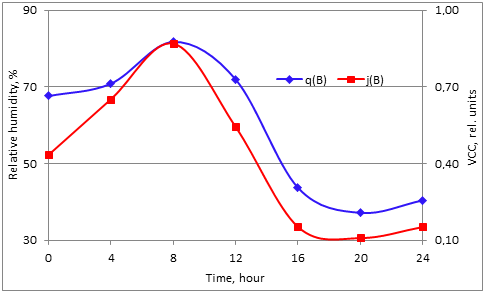
Figure 1: Field outburst according to indications of a gauss meter at a stationary point on June 09, 2005. The cause of the observed changes in the field was the solar warming of the underlying surface, which caused evaporation of the dew and moisture accumulated overnight in the pore space. On the one hand, this process led to the injection of neutral condensation nuclei, which caused the recorded changes in the field. On the other hand, it caused the full opening of near-surface pores that increased exhalation of the soil radon. In the records of volumetric activity of atmospheric radon, signal growth was also recorded during this period. No noticeable changes in the volumetric activity of soil radon were observed. According to statistical data, the soil radon content is as high as two orders of magnitude greater than the atmospheric radon content [11, 12]. The process of evaporation in the atmosphere is characterized by relative humidity [13]. The relationship between these parameters can be found in [14, 15], representing a vast statistical material (7 to 45 equilibrations per each pair of parameters) of synchronous measurements of the relative humidity, q, and the volumetric activity of atmospheric radon, Rn(a). In the range of relative humidity of 20-90% and volumetric activity of the atmospheric radon of 1.1-4.1 Bq/l, the relation of these parameters is given by the equation Rn(a) = 0.87*exp (0.018q) [Bq/l] with the confidence D = 0.91, where the relative humidity values are normalized to 1%. Figure 2 gives an additional illustration of the relationship between the relative air humidity and the elements of surface atmospheric electricity. Here, daily variations of the vertical conduction current (VCC), j, and the relative air humidity, q, recorded in Turkmenistan [j(T)] and in Belarus [j(B)] are shown. The correlation coefficients of diurnal VCC variations and the relative air humidity are rather high: k [j(B),q] = 0.96 and k[j(T),q] = 0.92. It should be noted that relative humidity was not monitored at the point of current measurement. Relative air humidity data was taken at the nearest meteorological stations, which were 20-30 km distant from the points of atmospheric-electrical observations.
![Figure 2: Examples of diurnal variations in the relative air humidity, q, and vertical conduction current in the surface atmosphere in Belarus [j (B)] and in Turkmenistan [j (T)]. Let us consider one more example of the relationships between VCC and evaporation processes in the atmosphere. Figure 3 shows the results of VCC](/fulltextimages/1308/fig_2.png)
observations, j(18.10)-j(21.10), recorded by a differential passive antenna [21] for time intervals of 02h–12h. The instrument was installed in the foothills, in the fault zone above the stony river bed, dry by autumn, near the city of Zaqatala, Azerbaijan. The fault zone and the narrow river canyon is the reason for negative background current values of 19-21.10.83.
![Figure 4: Spatial AEF variations on Svetlogorsk‑Uznozh highway over the urban water intake zone. In May 1987, in the territory of the Uznozh testing area, monitoring measurements of AEF [E(t)], VCC [j(t)], and water level [z(t)] in the observation well were performed. Figure 5 shows the record of AEF, VCC, and water level on May 21 from 17h31m till 18h03m, while a cumulonimbus cloud with no precipitation was passing over the testing area. In this time interval, AEF changed its sign and fell slightly below the detection limit of the instrument, - 5,000V/m, so it was recovered with confidence D = 0.99 as a function of the VCC with the confidence D = 0.99.](/fulltextimages/1308/fig_4.png)
Figure 3: Variations of VCC in the time interval 02h - 12h on 18-21.10.83. The observation results near the city of Zaqatala, Azerbaijan. For several days until 18.10.83, continuous rainstorms occurred. Since the night of 18.10, the weather has changed dramatically: it became warmer, the sky cleared from clouds and in the following day’s clear sunny weather established. According to the records in Figure 3, since 2 am, 18.10, a sharp increase in the recorded signal was observed and reached its maximum at about 08:30 am - at the time when the surface beneath the antenna was completely heated up by the sun, j(18.10). The same maximum repeated on 19.10.83 and 20.10.83, but had a shorter duration and lower amplitude: j(19.10), j(20.10). The record made on 21.10 provided no maximum at all, j(21.10). The result observed is a consequence of moisture evaporation that has accumulated in the soil during the time of rainstorms. A sharp warming up happened on 18.10.83 stimulated an intensive evaporation of accumulated water into the atmosphere. The natural maximum of current occurs at the moment of complete heating the underlying surface beneath the instrument up by solar radiation. The process of evaporation of accumulated moisture was repeated for 3 days and stopped on October 21, when moisture accumulated during the rainstorms completely evaporated.
Dynamics of Aquifers and Atmospheric Electricity
Below the data of the AEF profile observations over the cone of depression of the urban intake station in Svetlogorsk (Belarus) [8]. The measurements were carried out using stationary and mobile gauss meters 'Field-2'. The stationary instrument was continuously operated at the control point, at the Uznozh test site. The mobile instrument was installed on a roof of UAZ-452 vehicle (the height of measuring plates was about 2.3m above the ground) and was used to control the AEF on Uznozh ‑ Svetlogorsk highway. Figure 4 shows field variations on 17.2-km long profile recorded at the background signal level in the control point at the Uznozh of about 90V/m. Attention is drawn to peak amplitudes of the field in the immediate vicinity of the intake station ‑ picket 5 of the observational profile, 2.4km from its beginning. Morning, day and evening values reached 400, 900, and 600V/m, respectively. The reason is the cone of depression in the aquifer during the intake and extended in the Svetlogorsk-Uznozh direction. The depression created by water intake minimizes the atmosphere-soil air exchange, which ultimately leads to a decrease in soil radon exhalation and, consequently, to recorded high field values¾the classical electrode effect [8, 16].
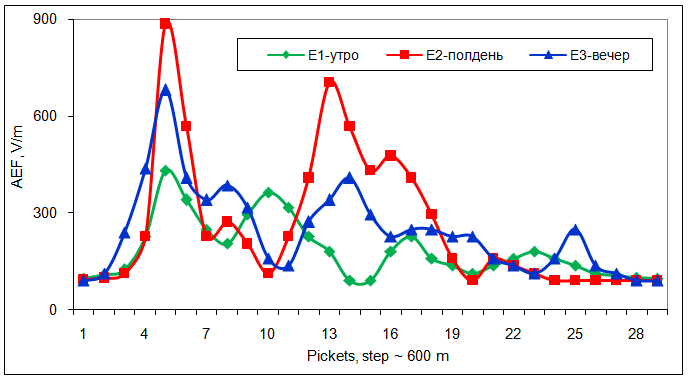
Figure 4: Spatial AEF variations on Svetlogorsk‑Uznozh highway over the urban water intake zone. In May 1987, in the territory of the Uznozh testing area, monitoring measurements of AEF [E(t)], VCC [j(t)], and water level [z(t)] in the observation well were performed. Figure 5 shows the record of AEF, VCC, and water level on May 21 from 17h31m till 18h03m, while a cumulonimbus cloud with no precipitation was passing over the testing area. In this time interval, AEF changed its sign and fell slightly below the detection limit of the instrument, - 5,000V/m, so it was recovered with confidence D = 0.99 as a function of the VCC with the confidence D = 0.99.
![Figure 6: Variations of AEF -E(t), VCC -j(t) and water level in the observation well z(t) in weak negative fields. Recording of the vertical conduction current j(t) surely repeated the variations of AEF; the correlation coefficients between the field and the current in the cases under consideration are sufficiently large: k(j,E)cloud = 0.91, k(j,E)drizzle = 0.74. Unfortunately, VCC was registered in relative units. However, the relative variations of the current during the passage of a thunderstorm cloud, with a drizzle, as well as changes in the water level in the observation well are very close to each other - Figure 5&6. To explain the reasons for correlation of hydrogeological and atmospheric electrical processes, let us turn our attention to the concept of barometric efficiency [17, 18]. With increasing atmospheric pressure, the level of aquifers and flow rates of sources decrease, and with its decrease they rise. Barometric efficiency is considered as a parameter of the aquifer, characterizing its elastic properties and the degree of isolation from the atmosphere. The maximum level changes caused by variations in atmospheric pressure will be observed in perched water and groundwater, directly related to the atmosphere ~ 8 mm / hPa. In view of the isolation of the confined water from the atmosphere, changes in their levels are much less than ~ 2 mm / hPa. In observations made on May 21 and 29, 1987, the confined water level was monitored, and its oscillations were ~ 3 mm. This means that during both in case of the cumulonimbus cloud and the drizzle, the atmospheric pressure varied within 1.5hPa, which is typical of such a meteorological situation [2,13]. On the one hand, the rise in the level of aquifers replaces the soil air, i.e., promotes the release of carrier gases and ionizers into the atmosphere. On the other hand, the very process of raising the level sets in motion the soil air in the covering rocks, intensifying the exhalation of soil radon, as in the case of the presence of microvibrations in the ground [19,8]. In the examples considered, this process is not related to the rise in the level of the confined water, but to the elevation of perched water - the water level in the nearby pond was ~ 0.8 m. The link between the increase in the water level and the change of electrical characteristics of the surface air with variations in atmospheric pressure is exhaling soil radon. Let us discuss an experiment carried out on a filled soil cushion 0.6-0.8m thick in a waterlogged area using two radon sensors ¾ samples of the soil and atmospheric air were taken simultaneously. When a cumulonimbus cloud appeared at the horizon, at intervals of 20 minutes, three measurements of the volumetric activity of the soil radon, atmosphere and AEF were taken. With a change in the field from 312V/m to -1,180V/m and -7,500V/m, the volumetric activity of the soil radon increased by 17.3 times, and the atmospheric radon activity increased by 15.3 times. Turning back to Figure 5, let us estimate the VCC value at its minimum. Prior to AEF decline to negative values, the field level varied within 90-110V/m. This means that at the minimum of VCC, the increase in the high- temperature superconductivity modulus due to the field has reached a value of ~50. An increase in polar conductivity at the field minimum is equal to the increase in the volumetric activity of the atmospheric radon before the thunderstorm by ~ 15.3 times (see above). Assuming that the background values of the VCC are at the world average level of (2-3)*10-12A/m2, we obtain the magnitude of the current modulus at the field minimum |j min| = (1.5-2.3)*10-9A/m2 [20]. As follows from Figures 5&6, relative VCC variations in the first and second cases of observations are comparable. Historically, precipitation currents are estimated by the magnitude 10-9-10-8A/m2 [21, 13] that agrees with the results of |j min| estimate.](/fulltextimages/1308/fig_6.png)
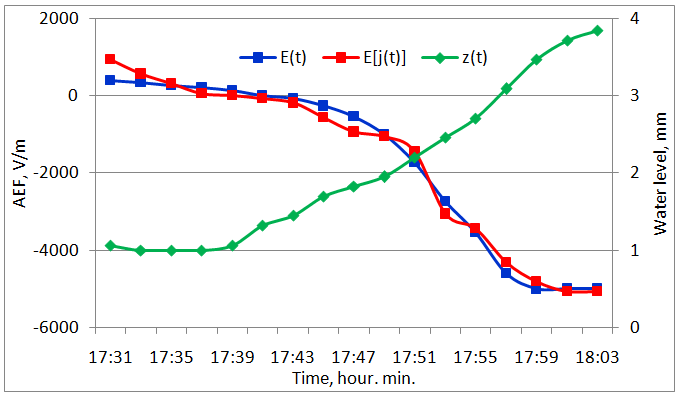
Figure 5: Variations of AEF -E(t), VCC -j (t) and water level in observation well - z(t) during a cumulonimbus cloud. Similar result was observed in the period of 01h00m ‑ 14h00m, May 29, 1987, with a drizzling rain¾Figure 6. The only difference is that, in this case, AEF varied from zero to -400V/m in different directions, and its variations in antiphase corresponded to changes in the water level in the observation well.
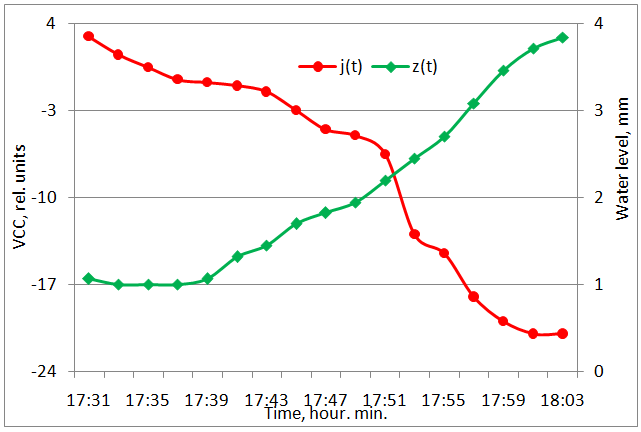
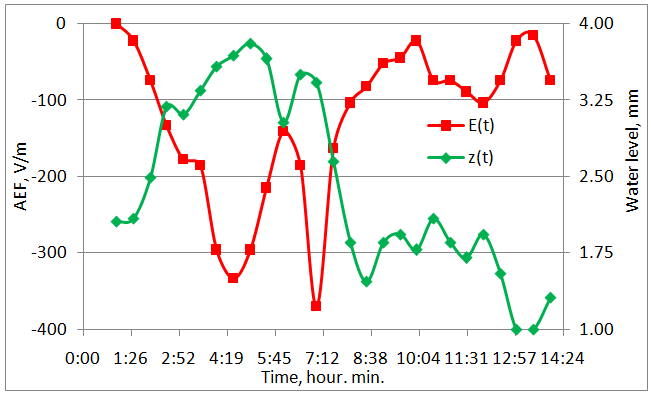
Figure 6: Variations of AEF -E(t), VCC -j(t) and water level in the observation well z(t) in weak negative fields. Recording of the vertical conduction current j(t) surely repeated the variations of AEF; the correlation coefficients between the field and the current in the cases under consideration are sufficiently large: k(j,E)cloud = 0.91, k(j,E)drizzle = 0.74. Unfortunately, VCC was registered in relative units. However, the relative variations of the current during the passage of a thunderstorm cloud, with a drizzle, as well as changes in the water level in the observation well are very close to each other - Figure 5&6. To explain the reasons for correlation of hydrogeological and atmospheric electrical processes, let us turn our attention to the concept of barometric efficiency [17, 18]. With increasing atmospheric pressure, the level of aquifers and flow rates of sources decrease, and with its decrease they rise. Barometric efficiency is considered as a parameter of the aquifer, characterizing its elastic properties and the degree of isolation from the atmosphere. The maximum level changes caused by variations in atmospheric pressure will be observed in perched water and groundwater, directly related to the atmosphere ~ 8 mm / hPa. In view of the isolation of the confined water from the atmosphere, changes in their levels are much less than ~ 2 mm / hPa. In observations made on May 21 and 29, 1987, the confined water level was monitored, and its oscillations were ~ 3 mm. This means that during both in case of the cumulonimbus cloud and the drizzle, the atmospheric pressure varied within 1.5hPa, which is typical of such a meteorological situation [2, 13]. On the one hand, the rise in the level of aquifers replaces the soil air, i.e., promotes the release of carrier gases and ionizers into the atmosphere. On the other hand, the very process of raising the level sets in motion the soil air in the covering rocks, intensifying the exhalation of soil radon, as in the case of the presence of microvibrations in the ground [19, 8]. In the examples considered, this process is not related to the rise in the level of the confined water, but to the elevation of perched water - the water level in the nearby pond was ~ 0.8 m. The link between the increase in the water level and the change of electrical characteristics of the surface air with variations in atmospheric pressure is exhaling soil radon. Let us discuss an experiment carried out on a filled soil cushion 0.6-0.8m thick in a waterlogged area using two radon sensors ¾ samples of the soil and atmospheric air were taken simultaneously. When a cumulonimbus cloud appeared at the horizon, at intervals of 20 minutes, three measurements of the volumetric activity of the soil radon, atmosphere and AEF were taken. With a change in the field from 312V/m to -1,180V/m and -7,500V/m, the volumetric activity of the soil radon increased by 17.3 times, and the atmospheric radon activity increased by 15.3 times. Turning back to Figure 5, let us estimate the VCC value at its minimum. Prior to AEF decline to negative values, the field level varied within 90-110V/m. This means that at the minimum of VCC, the increase in the high- temperature superconductivity modulus due to the field has reached a value of ~50. An increase in polar conductivity at the field minimum is equal to the increase in the volumetric activity of the atmospheric radon before the thunderstorm by ~ 15.3 times (see above). Assuming that the background values of the VCC are at the world average level of (2-3)*10-12A/m2, we obtain the magnitude of the current modulus at the field minimum |j min| = (1.5-2.3)*10-9A/m2 [20]. As follows from Figures 5&6, relative VCC variations in the first and second cases of observations are comparable. Historically, precipitation currents are estimated by the magnitude 10-9-10-8A/m2 [21, 13] that agrees with the results of |j min| estimate.
Conclusion
As follows from the given materials of the field observations, depositing on the ground, the atmospheric moisture plugs the near-surface pore space. With increasing air temperature, including as a result of solar heating, evaporation begins. Pores open and exhalation of the soil radon increases. Evaporating water increases the density of neutral condensation nuclei in the surface air that increases inevitably the atmospheric electric field.
Industrial use of confined waters minimizes the atmosphere-soil air exchange. As a result, the exhalation of the soil radon into the atmosphere decreases that increases inevitably the atmospheric electric field. The strongest effect on the change in elements of surface atmospheric electricity is caused by changes in the levels of perched water and groundwater, including variations in atmospheric pressure. Initial pressure falling by several hPa will increase exhalation of the soil radon by more than an order of magnitude. As a result, in strong negative fields of a cumulonimbus cloud, the vertical conduction current becomes comparable to the precipitation currents.
References
-
Baranov VI (1956) Radiometrics M, Publishing house of the USSR Academy of Sciences, pp: 343.
-
Tverskoi PN (1951) The Course of meteorology L. Gidrometeoizdat, pp: 887.
-
Frenkel YaI (2009) Theory of Phenomena of Atmospheric Electricity M. LIBROKOM Book House, pp: 152.
-
Voitov GI, Rudakov VP, Shuleikin VN, Kozlova NS, Baranova LV (1999) Emanation and electrical effects in the atmosphere of subsoil over the Kaluga ring structure. Russian Journal of Earth Sciences 1(6): 503-510.
-
Voitov GI, Gusev AS, Shuleikin VN (2000) Emanation (hydrogen-radon) and electrical effects over complexly built tectonic structures (on the example of the Aleksandrov zone of pre-breaking uplifts, Belarus). Reports of the Academy of Sciences 370(1): 105-108.
-
Gergedava ShK, Buzinov SN, Shuleikin VN, Voitov GI (2001) Unconventional geophysics for underground gas storages. Oil, gas and business 5(43): 2-7.
-
Zubarev AP, Shuleikin VN (2009) Complex geophysical and geochemical monitoring in the operation of underground gas storage facilities. Moscow: Publishing House Gazprom UGS, pp: 264.
-
Shuleikin VN, Shchukin GG, Kupovykh GV (1915) Development of methods and means of applied geophysics-atmospheric-electrical monitoring of geological heterogeneities and zones of geodynamic processes SPb. Izdatelstvo Russian State Hydrometeorological University, pp: 205.
-
(1960) Guide to ground-based observations of elements of atmospheric electricity. Publishing House MGO, pp: 95.
-
Semenov KA (1982) Good weather and elements of atmospheric electricity. Tr MGO 455: 112-119.
-
Sisigina TI (1962) Measurements of radon exhalation from the surface of rocks. In Coll.: Questions of nuclear meteorology, Gosatomizdat, pp: 104-111.
-
Sisigina TI (1965) Exhalation of radon from the surface of several types of soils in the European part of the USSR and Kazakhstan. In Coll.: Radioactive isotopes in the atmosphere and their use in meteorology M. Atomizdat, pp: 40-48.
-
Fligl R, Buzinger J (1965) Introduction to Atmospheric Physics Mir M, pp: 467.
-
Stiro BI (1959) Questions of nuclear meteorology. Vilnus, pp: 418.
-
Styro BI (1968) Self-purification of the atmosphere from radioactive contamination L. Gidrometizdat, pp: 290.
-
Redin AA (2011) Mathematical modeling of electrodynamic processes in the surface layer under the conditions of aerosol pollution of the atmosphere. Taganrog, PhD. Thesis, pp: 19.
-
Bagmet AL, Bagmet MI, Barabanov VL (1989) Investigation of ground-level fluctuations in the level of groundwater at the well "Obninsk" Izvestiya AN SSSR. Series of Physics of the Earth 11: 84-95.
-
Barabanov VL, Grinevsky AO, Kalachev AA, Savin IV (1988) Frequency characteristics of the well-aquifer system based on observations of the groundwater level Izvestiya AN SSSR. Series of Physics of the Earth 3: 41-50.
-
Shuleikin VN (2013) Radon transfers to near-surface soil layers and surface atmosphere. Geophysical processes and the biosphere 12(2): 57-66.
-
Koshkin NI, Shirkevich MG (1976) Handbook of elementary physics. Moscow, Nauka, pp: 255.
-
Kanonidi KKh, Lidvansky AS, Sobieshevich LE, Kaerdinov N (2010) Pulsations of the geomagnetic field associated with variations in the intensity of cosmic rays during thunderstorms. Proceedings of the 31st All-Russian Conference on Cosmic Rays, Moscow, Moscow State University Press.
- Genetic Improvement of Nile Tilapia (Oreochromis niloticus): Advances in Selective Breeding and Genomic Approaches for Sustainable Aquaculture
- Microplastics, Contaminants, and Waste Hotspots: Divergences and Faults in Prioritizing Control Efforts
- Creating a Healthier, More Vibrant Open and Closed Aquatic Environment. A Submersible, Centrifugal Magnetically Affixed Current Changing Aquarium Pump
- An Attempt to Assess Alpha Diversity and Sample Size: Using the Ostracod Assemblages off Kumamoto Port, Japan
- Assessment of the Efficiency of Common Fishing Gears and Crafts Used at Mohananda River of Chapai Nawabganj, Bangladesh
- Fish Productivity and Biodiversity Status of Sundarban Mangrove in Bangladesh