Present Status of Mud Crab Population in Bangladesh
<p>Apparent declines in abundance of mangrove crabs Scylla spp. in the coastal area of Bangladesh have prompted concern regarding long-term determination of this important cultural and economic resource. From the survey of ten districts according to treatment T1, T2 and T3 the total production of the coastal area was decreased from 32255.06±178.18mt to 25643.46±141.96mt between 2013 and 2016 and the percentage of the total production of the experimental area was declined 9.55, 15.36 and 20.50% within the year 2013-14, 2014-15 and 2015-16. The decreasing trends or regression type was Exponential and the equation was y = 6.724e0.81×; where R2 is 0.980. There is a significant trends in case of male, female and immature mud crab of coastal area. In case of female mud crab total catch percentage was decreased from 43.11% to 27.95% between 2013 to 2016. In case of male and immature mud crab total catch percentage was increased from 29.08% to 38.34% and 27.81% to 33.71% between 2013 and 2016. Rising pressure of trap, line and catch by hand, and decreasing pressure of catch by net was detected to catch mud crab in the experimental area. So, eco-friendly catch and juvenile culture of mud crab is to be practiced until established mud crab hatchery to minimize the requirement of seed production of crab in aquaculture crab field.</p>
Introduction
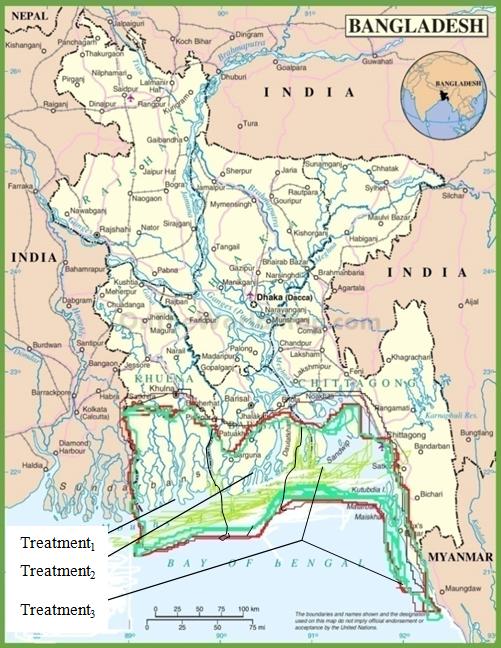
Bangladesh has a coastline of 710 km with 6.18.780 ha of mangrove tidal flats and 80,000 ha of associated areas suitable for coastal aquaculture [1]. Mud crab aquaculture has been practiced for many years in the coastal regions, particularly in southeast (Chittagong, Cox,s Bazar, Noakhali) and southwest (Bhola, Potuakhali, Barguna, Phirujpur, Bhagerhat, Khulna and Satkhira) Bangladesh. Mud crab farmers are to be practiced mud crab fattening in pen and cages in the coastal area by traditional methods. When the disease outbreaks in shirmp farming, mud crab became a important species for aquaculture due to its demand of international markets. Now days, mud crab culture is going to popular in the greater Khulna, Barisal, Noakhali and Chittagong regions [2]. Once the coastal area of Bangladesh had abundance of mud crab and wild fish species. Due to over exploitation and various ecological changes in the mangrove area, the population of mud crab is going to decrease. The mangrove area is under great stress and its existence is under danger because of changing aquatic ecosystems and habitat degradation. Indiscriminate destructive harvesting crab practices, soil erosion and lower salinity have caused havoc to the aquatic biodiversity of coastal area. Mud crabs of the genus Scylla are importance as a source of delicious food and income throughout much of the tropical Indo-Pacific and as a consequence have been reduced, in both abundance and size, throughout much of their range [3, 4, 5]. In Bangladesh, ten districts of coastal area is one of the most valuable resources for Scylla spp. (Figure 1). These crabs have economic value resulting from export and commercial sale to local market. A general trend among ten districts of Bangladesh that mangrove crabs are becoming increasingly scarce, have raised concerns regarding the sustainability of current harvest levels and persistence of mangrove crabs as a viable and valuable resource. A planned and systematic study is needed to determine the present status of biodiversity in the coastal area with a view to undertake appropriate measures to conserve and manage the aquatic resource. The present study conducted to determine the abundance, crab species combination, catch statistics and related aspects of mangrove area. Aquatic biodiversity of an area should be studied in relation to ecology of coastal area and the entire catchments area of a water body.
Materials and Methods
Study Area and Experimental Design
The research has been carried out in 26 Upazilas under the district of Sathkhira, Khulna, Bagherhat, Phirojpur, Borguna, Potuakhali, Bhula, Noakhali, Chittagong and Cox’sBazar (Table 1). The study area was designed as a treatment T1, T2 and T3. Treatment T1 was designed with thirteen Upazillas of Sathkhira, Khulna and Bagherhat districts, Treatment T2 with eight Upazillas of Phirojpur, Borguna and Potuakhali districts and Treatment T3 was designed with five Upazillas of Bhula, Noakhali, Chittagong and Cox’s Bazar districts depending on eco- system of coastal area (Figure1). About 169 crab harvesters and collectors, 169 crab fatteners and 26 Upazilas under ten districts were selected.
Experimental procedure
Detail survey on mud crab was conducted during 2013 to 2016 with particular emphasis on water quality, mud crab productivity and status of crab exploitation. The research was conducted through collection of both primary and secondary data, comprehensive literature review and extracts of local knowledge and information.
Collection of primary data was made by field observation and different experimentations which comprised of experimental area of coastal region, survey of different crab harvesting methods, crab markets, physico-chemical characteristics of coastal region and fishers’ perception as well. Secondary data were collected from Department of Fisheries (DoF) and from the local fishers.
| No. of crab | |||||||||||||||||||||||
| No. of crab | No. of Upazilla | D | ata collectio | n | |||||||||||||||||||
| T | reat-men | t | District | Upazilla | harvester and | R | emark | s | |||||||||||||||
| fatteners | Office | Methods | |||||||||||||||||||||
| collectors | |||||||||||||||||||||||
| T 1 | Shatkhira | Shamnagar | o7 | 8 | 1 | Questionnaire Interviews and Group Discussion | |||||||||||||||||
| Kaligong | 7 | 7 | 1 | ||||||||||||||||||||
| Debhata | 7 | 8 | 1 | ||||||||||||||||||||
| Asasuni | 7 | 7 | 1 | ||||||||||||||||||||
| Khulna | Dumuria | 7 | 8 | 1 | |||||||||||||||||||
| Paikgacha | 7 | 8 | 1 | ||||||||||||||||||||
| Koyra | 7 | 7 | 1 | ||||||||||||||||||||
| Botiaghata | 6 | 7 | 1 | ||||||||||||||||||||
| Dakup | 7 | 8 | 1 | ||||||||||||||||||||
| Bhagerhat | Sadar | 6 | 7 | 1 | |||||||||||||||||||
| Rampal | 7 | 8 | 1 | ||||||||||||||||||||
| Kochua | 5 | 0 | 1 | ||||||||||||||||||||
| Morolgonj | 7 | 8 | 1 | ||||||||||||||||||||
| T 2 | Phirojpur | Motbaria | 6 | 0 | 1 | ||||||||||||||||||
| Indurkhani | 6 | 7 | 1 | ||||||||||||||||||||
| Borguna | Pathorghata | 7 | 7 | 1 | |||||||||||||||||||
| Amtholi | 7 | 7 | 1 | ||||||||||||||||||||
| Thaltoli | 7 | 8 | 1 | ||||||||||||||||||||
| Potuakhali | Kolapara | 7 | 7 | 1 | |||||||||||||||||||
| Golachipa | 7 | 7 | 1 | ||||||||||||||||||||
| Rangabali | 7 | 0 | 1 | ||||||||||||||||||||
| T 3 | Vhola | Monpura | 7 | 7 | 1 | ||||||||||||||||||
| Charfason | 7 | 7 | 1 | ||||||||||||||||||||
| Noakhali | Hatia | 7 | 7 | 1 | |||||||||||||||||||
| Chittagong | Sandip | 7 | 7 | 1 | |||||||||||||||||||
| Cox’s Bazar | Sadar | 7 | 7 | 1 | |||||||||||||||||||
| Total | 169 | 169 | 26 |
Table 1: Crab harvester and collectors, crab fatteners and data collection methods involved in 26 Upazilas under ten districts.
Study of Physico-Chemical Parameters
Physico-chemical parameters were followed by the standard method of APHA (1998) [6]. Water temperature was measured using a Celsius thermometer. Dissolved oxygen and pH were calculated directly using a digital electronic oxygen meter (YSI Model 58) and an electronic pH meter (Jenway Model 3020). Salinity was measured by Refracto meter.
Fishing Method
Detail survey on harvesting method of the experimental area was conducted with particular emphasis on number of traps, gear, line and catch by hand. Fishers’ used boat for transport of traps, gear, line and catch by hand according to season and availability of crab.
Data Collection
An organized sampling program was run to get a true picture of the catch and catch composition of surveyed area. The experimental coastal area was sampled fortnightly to assess the mud crab abundance and availability. The current study, being a rapid survey, gives only a broad picture of a stock of mud crab was recorded through different crab market survey, collection of different species directly fisher’s catch and interaction with fishers’ in the catching area. The harvesting was followed to compare the status of the mud crab trend among different years Shannon index was followed by Shannon [7]. Shannon Diversity Index: s H = ∑ - (Pi * ln Pi) i=1 Where: H = the Shannon diversity index Pi = fraction of the entire population made up of species i S = numbers of species encountered ∑ = sum from species 1 to species S Note: The power to which the base e (e = 2.718281828.......) must be raised to obtain a number is called the natural logarithm (ln) of the number.
Analysis of Experimental Data
The collected data were reviewed carefully before genuine tabulation. The processed data were reworded to a master sheet from which classified tables were prepared revealing the findings of the study. The data were analyzed through one way ANOVA using MSTAT followed by Duncan’s Multiple Range Test to find out whether any significant difference existed among treatment means [8, 9]. Standard deviation in each parameter was calculated and expressed as mean ±S.D.
Results
Physico-Chemical Parameters of Experimental Area
The result of the physico-chemical parameters of the experimental area is furnished in Table 2 which included temperature, Salinity, pH and dissolve oxygen of water. It is evident from the Table 2 that the mean water temperature of the coastal area was not statistically significant (P > 0.05). Temperature ranged from 16.35 to 31.01oC between 2013 and 2016. Mean salinity differed significantly (P < 0.05), during the year 2013 to 2016 and ranged was 05.10 to 31.22‰. Higher values of salinity occurred during February and March due to increased flow and relatively stable conditions of water. The mean dissolved oxygen (DO) of the experimental area did not differ significantly (P > 0.05). Dissolved oxygen (DO) ranged from 4.38 to 8.54 between 2013 and 2016. Results obtained from the series experiment indicated that salinity and dissolved oxygen showed a tendency to increase with the tides. pH of the experimental area did not differ significantly (P > 0.05). PH ranged from 6.45 to 8.88 between 2013 and 2016. A significant rise in pH during pre-monsoon; followed by a drop in winter was noted in the experimental area.
| Different year | ||||||||||||||
|---|---|---|---|---|---|---|---|---|---|---|---|---|---|---|
| Parameters | ||||||||||||||
| 2013 | 2014 | 2015 | 2016 | |||||||||||
| Temperature (oC) | 27.02±6.38 | 26.45±6.55 | 26.54±7.11 | 26.88±6.48 | ||||||||||
| (17.41-30.10) | (16.52-30.55) | (16.35-30.44) | (16.66-31.01) | |||||||||||
| Salinity (ppt) | 19.52±7.76c | 18.07±6.88d | 21.44±6.18b | 22.85±6.22a | ||||||||||
| (05.10-30.22) | (05.11-30.02) | (05.12-30.10) | (05.18-31.22) | |||||||||||
| Dissolved oxygen | 6.48±1.22 | 5.97±1.54 | 6.58±1.22 | 7.08±1.52 | ||||||||||
| (mg/L) | (4.38-7.44) | (4.88-7.04) | (4.70-8.54) | (4.66-8.12) | ||||||||||
| pH | 8.05± 3.11 | 7.90±2.44 | 7.50± 1.55 | 7.06±2.22 | ||||||||||
| (6.45-8.44) | (6.50-8.88) | (6.65-8.85) | (6.60-8.77) |
Table 2: Physico-chemical parameters of 10 coastal districts of Bangladesh.
Figures with different superscripts in the same row varied significantly (_P>_0.05). Figures in the parenthesis indicate the range.
Habitat of Mud Crabs
According to 88.17% harvesters and collectors of crab, 85.80% crab fatteners and 65.38% of Upazilla Fisheries Officers agreed the reproduction of mud crab occurs year- round.
| c | No. of crab | ||||||||||||||||
|---|---|---|---|---|---|---|---|---|---|---|---|---|---|---|---|---|---|
| f | No. of crab | 9 | No. of Upazilla | ||||||||||||||
| Sl. No. | Characteristics | Habitat of mud crab | harvester and | ||||||||||||||
| atteners n=16 | Office n=26 | ||||||||||||||||
| ollectors n=169 | |||||||||||||||||
| 1 | Reproduction | Whole the year | 149 | 145 | 17 | ||||||||||||
| 2 | Copulation takes place directly | After molting of female and involves an extended period of mate guarding by the male. | 159 | 108 | 20 | ||||||||||||
| 3 | Destination of female | Substantial distances offshore from a few to many tens of kilometers | 124 | 134 | 21 | ||||||||||||
| 4 | Larvae enter the plankton | Deep sea | 105 | 101 | 18 | ||||||||||||
| 5 | Juvenile destination | Deep sea to sea shore. | 135 | 124 | 16 | ||||||||||||
| 6 | Destination of male | Mangrove channels or in association with burrows located in mangrove forests, on mudflats and banks of channels. | 150 | 155 | 19 |
Table 2: Habitat of mud crabs in coastal area of Bangladesh. Copulation of mud crab takes place directly was known to 94.08, 63.91 and 76.92% of harvesters and collectors of crab, crab fatteners and Upazilla Fisheries Officers. About 124% harvesters and collectors, 134% crab fatteners and 21 Upazilla Fisheries Officers said that destination of female was substantial distances offshore from a few to many tens of kilometers. About 62.13% harvesters and collectors, 59.76% crab fatteners and 69.23% Upazilla Fisheries Officers recognized that larvae enter the plankton in deep sea. About 135 harvesters and collectors of crab, 124 crab fatteners and 16 Upazilla Fisheries Officers said that the destination juvenile was deep sea to sea shore and about 88.76% harvesters and collectors of crab, 91.71% crab fatteners and 73.08% Upazilla Fisheries Officers said that male mud crab habitat was mangrove channels or in association with burrows located in mangrove forests, on mudflats and banks of channels.
Uses of Fishing Craft Line and Gears
About four types of fishing methods were identified in the coastal area. The percentage of catch statistics of coastal area showed the use of cylindrical bamboo traps, net, line and catch by hand during law tide were 31.20, 34.30 18.20 and 16.30% in 2013, respectively. The number of using cylindrical bamboo traps, line and catch by hand were increased in 2014 to 2015. In between 2014 and 2015, using of increasing trend by cylindrical bamboo trap, line and catch by hand were 32.40, Number of replicates for each substrate; crab collector n=169, crab fattener n=169 and Upazilla office n=36.22.40 and 15.10%; and 34.10, 23.20 and 16.50% and decreasing trend by net was 30.10 and 26.2%. Finally, in 2016, increasing trend of using cylindrical bamboo traps, line and catch by hand were 35.40, 24.20 and 17.10%.
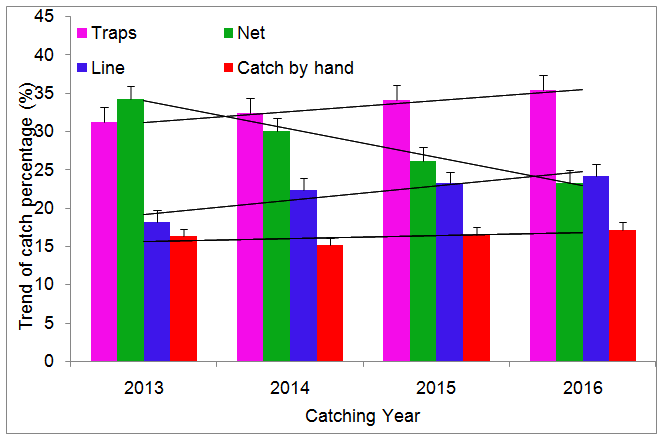
But in case of netting decreasing trend was also recorded at 23.40% (Figure 3). There was a significant difference (P < 0.05) in percentages of crab catches among different fishing methods in between 2013 and 2016. A significant trend of catches was observed with cylindrical bamboo traps, line and catch by hand during the reporting period. In case of trap, line and catch by hand, the increasing trends or regression type was linear and the equations were y = 143× + 29.7, where R2 = 0.995; y = 1.88× + 17.3, where R2 = 0.846; y = o.38× + 15.3, where R2 = 0.342. In case of net, the decreasing trends or regression type was linear and the equation was y = - 3.69× + 37.7; where R2 = 0.992. A significant decline in the abundances of mud crab population was accounted due to increasing fishing pressure.
Catch and Catch Composition
The status of available catch position of mud crab in the
coastal area of ten districts according to treatment T1, T2
and T3 was identified (Figure 4). The present study
indicated the presence of two mud crab species in the
study area. In 2013, the harvesting of mud crab in
treatment T1 T2 and T3 were 16922.57±26.76,
6120.84±22.34 and 9211.65±18.86 mt. But in between
2014 and 2015, total catch Number of replicates for each
substrate; Crab collector n=169, Crab fattener n=169 and
Upazilla office n=36.of ten districts under treatment T1, T2
and T3 was decreased at 15223.16±22.06, 5578.74±20.11
$$ \text {a n d} 8 3 7 4. 8 5 \pm 1 7. 2 8 \quad \mathrm {m t}; \quad \text {a n d} 1 4 2 3 1. 6 7 \pm 1 9. 8 8, $$
4987.55±17.88 and 8082.88±15.39 mt step by step.
Finally, in 2016, the total catches of in treatment T1, T2
and T3 was decreased and recorded at the production of
13497.53±20.18, 4675.15±17.76 and 7470.78±14.44 mt.
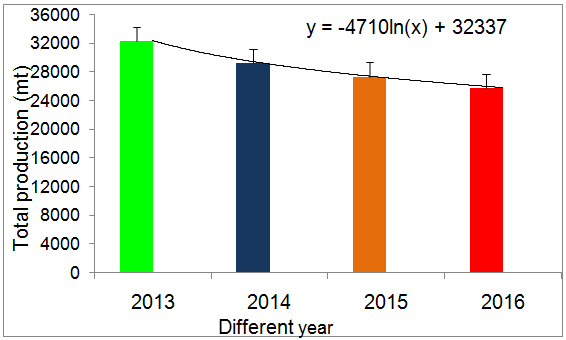
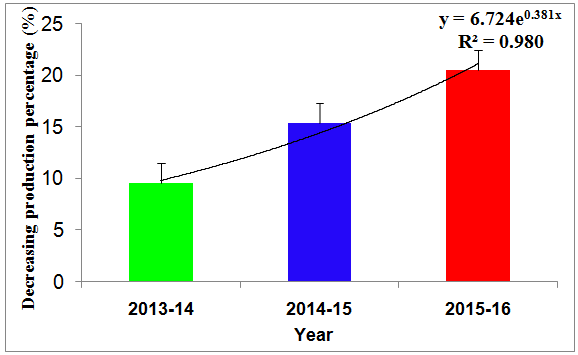
Figure 5: Decreasing total catch of mud crabs in ten districts between 2013 and 2016. Number of replicates for each substrate; crab collector n=169, crab fattener n=169 and Upazilla office n=36. A decreasing trend of total catch was recorded in between 2013 and 2016. Annual total catch of this survey area was estimated to be 32255.06±178.18; 29176.75±159.63, 27302.10±148.58 and 25643.46±141.96 mt in the year 2013,
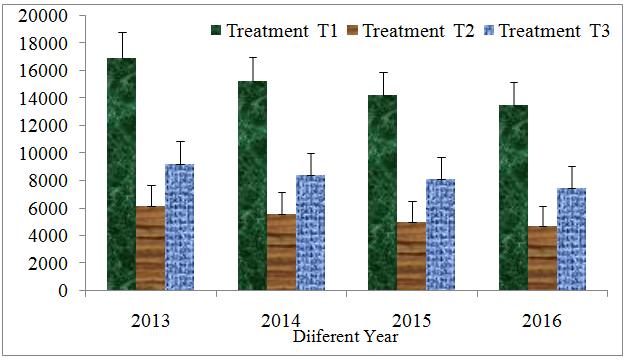
Figure 6: Decreasing catch percentage (%) of mud crabs between 2013 and 2016. Number of replicates for each substrate; crab collector n=169, crab fattener n=169 and Upazilla office n=36. 2014, 2015 and 2016, respectively consisting of three treatments viz., Scylla serrata and Scylla olivacea. A decreasing trend of total population of mud crab in the coastal area was identified between 2013 and 2016. The decreasing type was logarithmic (y = - 4710In (×) + 32337), where R2 = 0.992.
Increasing capture pressure resulting in gradual reduction in the population of mud crab was clearly demonstrated (Figure 5). Decreasing total production percentage (%) in three treatments between 2013 and 2016 was shown in the figure 6. The percentage of the total production of the experimental area was declined 9.55, 15.36 and 20.50% within the year 2013-14, 2014-15 and 2015-16. The decreasing trends or regression type was Exponential and the equation was y = 6.724e0.81×; where R2 is 0.980.
Sex Distribution
All specimens of mud crab were assessed as either sexually mature or immature based on the visibility of gonads on the photographs. The males proved more difficult to determine for maturity than females, as the hepatopancreas sometimes had smeared and thereby covered the male gonad on the photographs. Males where therefore only classified as mature if there was as a clear visual of the gonads. All sexually mature specimens should have visible gonads during this time of year [10].
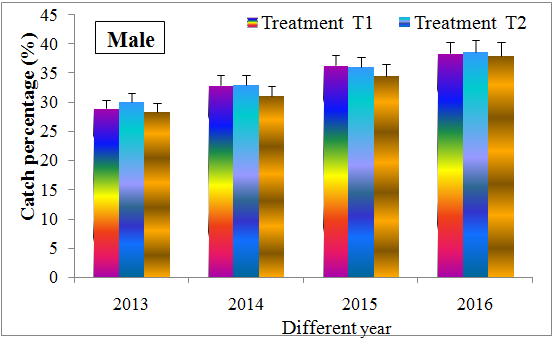
Male
The sex distribution in mud crabs caught in the coastal area of ten districts under three treatments was identified (Figure 7). In 2013, the catch percentage of male in treatment T1 T2 and T3 were 29.0±1.88,
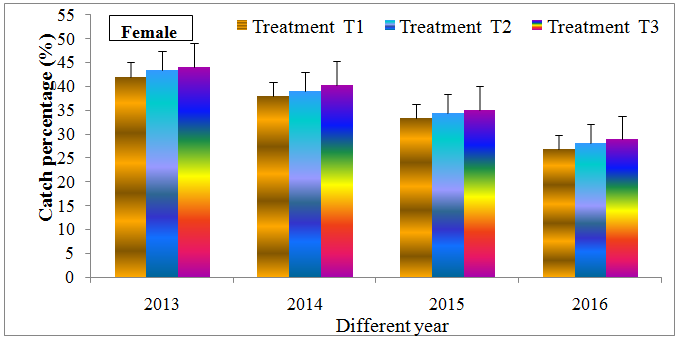
Figure 7: Catch percentage (%) of caught male crab between 80-184 mm in CW within 2013 to 2016 in ten districts. Crab collector n=169, crab fattener n=169 and Upazilla office n=36. 30.0±1.76 and 28.25±1.80%. But catch percentage was increased in between 2014 and 2015 at 33.00±2.01, 33±1.88 and 31±1.56%; and 33.36±2.02, 36.00±1.98 and 34.50±1.88%. Finally, in 2016 the catch percentage of male in treatment T1, T2 and T3 was increased at the rate of 38.40±3.08, 38.66±2.76 and 38.0±2.11%. The sex ratio was fluctuated around 8.0 to 10.0% between 2013 and 2016.
Female
The sex distribution of mud crabs caught in the coastal area of ten districts under three treatments was Identified (Figure 8).
crab between 800-164 mm in CW within 2013 to 2016
in different districts. Number of replicates for each
substrate; crab collector n=169, crab fattener n=169
and Upazilla office n=36.
In 2013, the catch percentage of male in treatment T1
T2 and T3 were 42.0±3.22, 43.33±2.16, and 44.00±2.04%.
But catch percentage was decreased in between 2014 and
2015 at the rate of 38.00±2.21, 39.00±1.98 and
$$
4 0. 2 5 \pm
$$ 4 0. 2 5 \pm 1. 8 6 \%; \mathrm {a n d} 3 3. 3 3 \pm 2. 2 2, 3 4. 3 3 \pm 1. 9 0 \mathrm {a n d} $$
35.00±1.80%. Finally, in 2016 the catch percentage of
female in treatment T1, T2 and T3 was recorded at the rate
of 26.80±2.11, 28.17±2.06 and 28.89±2.01%. The
population of female sex was decreased around 15.0%
between 2013 and 2016.
Imature Crab
The sex distribution of immature mud crabs caught in the coastal area of ten districts under three treatments was identified (Figure 9). In 2013, the catch percentage of male in treatment T1 T2 and T3 were 29.0±2.78, 26.67±2.62 and 27.75±2.88%. But catch percentage was increased in between 2014 and 2015 at 29.00±2.22, 28.0±2.02 and 28.75±1.87%; and 30.33±2.42, 29.67±2.11 and 30.50±1.89%, respectively. Finally, in 2016 the catch percentage of immature crab in treatment T1, T2 and T3 was increased at the rate of 34.00±3.08, 33.67±2.86 and 35.50±2.51%. The sex ratio was fluctuated around 5.0 to 7.0% from 2013 to 2016.
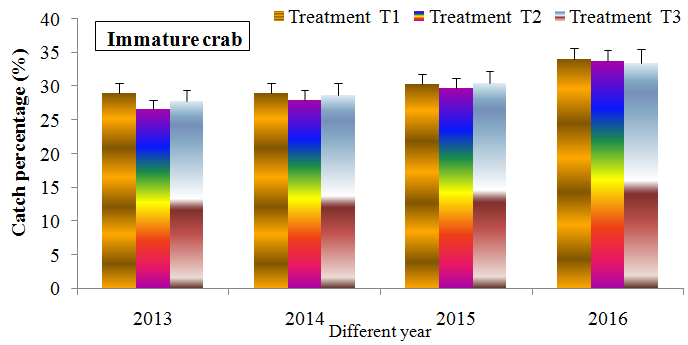
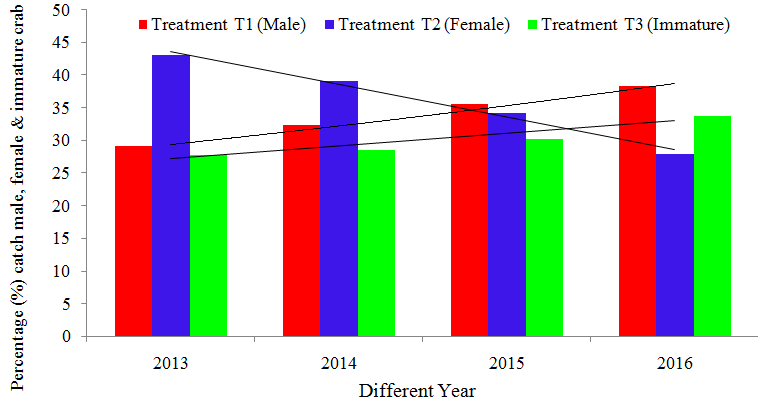
Figure 10: Catch percentage (%) of caught male. female and immature crab between 2013 and 2016 in ten districts under three teatments of experimental area. Crab collector n=169, Crab fattener n=169 and Upazilla office n=36. Population of coastal area of Bangladesh (Figure 10). In case of male a increasing data was recorded at 29.08±1.55, 32.34±1.08, 35.61±1.00 and 38.34±1.33% from 2013 to 2016 in treatment T1. The increasing trends or regression type in treatments was linear and the equation was y = 26.70e0.092×; where R2 is 0.993.In case of immature crab also a increasing data was recorded at 27.81±1.22, 28.58±1.12, 30.17±1.05 and 33.71±1.15% from 2013 to 2016 in treatment T3. The increasing trends or regression type in treatments was linear and the equation was y = -5.034× + 48.67; where R2 is 0.990. Finally, In case of female mud crabs total population was decreased at the percentage of 43.11±1.44, 39.08±1.25,
34.22±1.35 and 33.71±1.45% during 2013, 2014, 2015 and 2016. The decreasing trends or regression type in three treatments was linear and the equation was y = 1.929× + 25.24; where R2 is 0.903.
Culture Practices
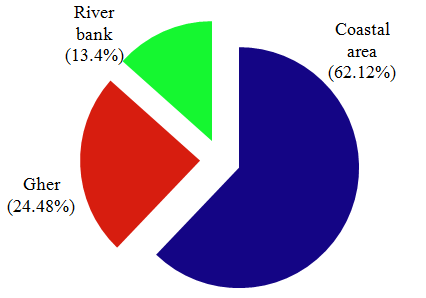
Mud crab fattening was practiced by pen and cage culture method in the coastal area of Bangladesh. Now a day, another important technology of Juvenile crab culture method was introduced by the Project Director, “Culture of Cuchia (mud eel) and Crab in the Selected Area of Bangladesh and research project”. Immature mud crabs were released in enclosure (Pen) and fed until developed their gonad maturity. Juvenile mud crab culture, Crab fattening in pen and cage started recently in 26 upazillas of ten districts under treatment T1, T2 and T3. Cage culture was practiced commercially in Shamnogor (Satkhira) and Sadar upazilla of Cox’s Bazar. There were 2.3 million cages in this area for soft shell culture. About 11.50 million crabs (size 90-180gm) needed for soft shell culture for the year 2016. This was challenge for the coastal area of Bangladesh because of total dependency of wild mud crab collection. Mud crab farming is totally dependent on wild seed supply. Data collected from the crab harvester, collector and fattener it was found that 62.12% crabs was collected from coastal area including mangrove area, 24.48% collected from Gher and rest of others 13.40% was collected from coastal river bank. About 62.12, 24.48 and 13.40% of mud crab was collected from coastal area, gher and river (Figure. 11). Neap tide was locally called Gun. Crabs of > 100g weight was priced from BDT 400 to 1500 Tk./kg. The export size was >120g.
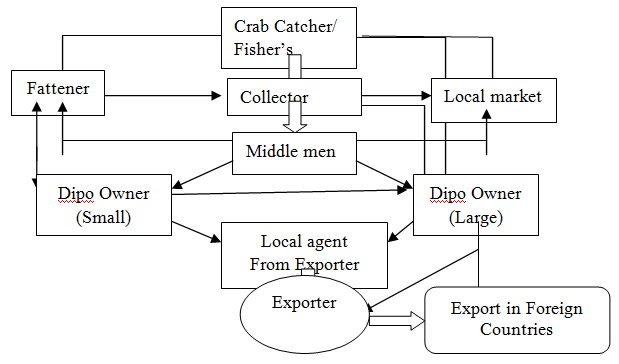
Marketing Channel in Mud Crab Trading
The marketing channel of the mud crab business was found to be consisted with the harvesters, forias (middle men), depot owner’s suppliers, agents and exporters. The trading pattern involved a series of intermediaries from harvesters to consumers. In the whole region, a general type of marketing channels (Figure. 12) was observed. The marketing system was developed on different grading of male and female size. Gonad developed female mud crab rate was in the market. The grading system was almost similar in the experimental area. Experienced farmers could tell whether the ovaries were full examining against the light.
Discussion
Mangrove or mud crabs of the Scylla spp. are importance as a source of delicious food and income throughout much of the tropical Indo-Pacific and as a consequence have been depleted, in both abundance and size, throughout much of their range [3, 4, 5]. They occur from Bangladesh, India and Southeast Asia to parts of Japan and China and throughout the Pacific islands [11], Scylla species are harvested for subsistence throughout their range, are the focus of small to moderate scale in some areas, and are farmed commercially in Southeast Asia [12]. In Bangladesh, ten districts of coastal area is one of the most valuable resources for Scylla spp. These crabs have economic value resulting from export, domestic exchange, and commercial sale to local market. Recent studies show that despite apparent declines in catch-per-unit effort and harvest effort in the mangrove area, export of crabs for sale was increased substantially respectively, which is supported by Naylor and Drew 1998, and Naylor et al. 2002 [4, 13].
Anticipated economic and human population trends are likely to increase demand for this valuable resource, as well as place greater pressures on the mangrove area that provide key habitat for the species [13, 14]. These trends among coastal area that mangrove crabs are becoming increasingly scarce have raised concerns regarding the sustainability of current harvest levels and determination of mangrove crabs as a viable and valuable resource [15, 16, 17]. Reproduction occurs year-round in the tropics, with seasonal maxima that appear to coincide with seasonally high rainfall [18]. Copulation takes place directly in Scylla spp after the female molts and involves an extended period of mate guarding by the male. Ovigerous females swim substantial distances offshore from a few to many tens of kilometers where the eggs hatch and larvae enter the plankton [19, 20, 21]. Juvenile S. serrata are most common in intertidal habitats, whether on mudflats or in mangroves [22, 23, 16, 24], moving into deeper habitats as they grow [16]. Larger male S. serrata are commonly found in mangrove channels or in association with burrows located in mangrove forests, on mudflats, or in the banks of channels, as well as on neighboring reef flats [19]. Most households on mangrove area harvest crabs from nearby mangrove forests. The goal of this effort is to inform development of management strategies that will ensure continued availability of mangrove crabs, yet are simple for local resource managers to implement and evaluate. The highest volume of mud crab population was collected from mangroves and tidal rivers from November to January while shrimp farm was the main source of crabs during rainy season from June to August. The catch was high during spring and neap tide [25]. Medium and large crab of more than 14 cm carapace width and weighing more than 400 g were collected exclusively for export, which is agreed by Raj, M. M. 1992 [26]. The females crab with mature ovaries was particularly expensive in the market of Bangladesh, which is agreed by Ladra et al. 1991 [27]. The catch statistics indicate that fishing pressure of coastal area was increased rapidly in the year 2013 to 2016. As a result, a decreasing trend in production percentage of the surveyed area was clearly pronounced within four years which was very similar to the report of Moyle and Leidy [28]. The total catch statistics of mud crabs in the surveyed coastal area indicated that percentage of mud crabs was sharply decreased within four years which are very similar to the study of Chakraborty [29, 30, 31].
Shannon index [7] was used to identify the present status of the coastal area. Due to over-exploitation and various ecological changes in natural aquatic ecosystem health such as coastal area, commercially important Scylla spp. were under stress which is in agreement with the findings of Hill 1994 [21]. The study clearly indicates that the mud crabs of the coastal area were subjected to over fishing resulting in gradual decline in crab population. The present study focuses on the abundance, catch statistics and related aspects of coastal area of Bay of Bengal. Mud crab was facing as higher risk of extinction day-by-day. A planned and systematic study was applied to determine the present status of biodiversity in the coastal area with a view to undertake appropriate measures to conserve and manage the mud crab resource. To overcome the basic requirement of mud crab fry in the aquaculture mud crab field, hatchery should be established in the coastal region of Bangladesh. But until to establish the hatchery, eco- friendly catch system of mud crab and juvenile mud crab culture should be applied in the coastal area.
References
-
Anon (2003) Principles for a code of conduct for the management and sustainable use of mangrove ecosystem. World Bank, Washington D.C.
-
Azam KD, Kamal M, Mustafa (1998) Status and potential of mud crab (_Scylla serrata_) in Bangladesh. In: Proceedings of National Seminar on integrated management, Ganges Floodplains and Sudarbans Ecosystem. Rahman MA, Shaha MS, Murtaza MG, Matin MA (Edr.), Khulna University, Bangladesh, pp: 150-160.
-
Brown IW (1993) Nearshore marine resources of the South Pacific: Information for fisheries management and development. Wright A, Hill L (Edr.), Forum Fisheries, pp: 611-642.
-
Naylor R, Drew M (1998) Valuing mangrove resources in Kosrae, Micronesia. Environ Dev Econ 3: 471-490.
-
Marichamy R, Rajapackiam S (2001) The aquaculture of Scylla species in India. Asian Fish Sci 14: 231-238.
-
APHA (1998) Standard methods for the examination of water and wastewater, 20th (Ed.), American Public Health Association, Washington, DC.
-
Shannon CE (1948) A mathematical theory of communication. Bell System Tec J 27: 379-656.
-
Duncan DB (1955) Multiple range and multiple F- testes. Biometrics 11(1): 1-42.
-
Zar JH (1984) Biostatistics. Prentice-Hall, Inc. Englewood Cliffs, New Jersey, USA, pp: 718.
-
Macia A, Afonso PS, Paula J, Paula e Silva R (2014) The mud crab Scylla serrata (Forska°l) in Maputo Bay, Mozambique. WIOMSA.
-
Macnae W (1968) A general account of the fauna and flora of Mangrove swamps and forests in the Indo- West-Pacific region. Adv Mar Biol 6: 73-270.
-
Trin˜o AT, Mellamena OM, Keenan C (1999) Commercial evaluation of monosex pond culture of the mud crab _Scylla_ species at three stocking densities in the Philippines. Aquaculture 174 (1- 2):109-118.
-
Naylor RL, Bonine KM, Ewel KC, Waguk EE (2002) Migration, markets, and mangrove resource use on Kosrae, Federated States of Micronesia. Ambio 31(4): 340-350.
-
Hauff RD, Ewel KC, Jack J (2006) Tracking human disturbance in mangroves: Estimating harvest rates on a Micronesian island. Wetlands Ecol Manage14 (2): 95-105.
-
Caswell H (2001) Matrix population models. 2nd (Ed.), Sinauer Associates, Sunderland, Massachusetts.
-
Hill BJ, Williams MJ, Dutton P (1982) Distribution of juvenile, subadult and adult Scylla serrata (Crustacea: Portunidae) on tidal flats in Australia. Mar Biol (Berl.) 69: 117-120.
-
Williams MJ, Hill BJ (1982) Factors influencing pot catches and population estimates of the portunid crab _Scylla serrata_. Mar Biol (Berl.) 71(2): 187-192.
-
Le Vay L (2001) Ecology and management of mud crab (Scylla spp.). Asian Fish Sci 14(2): 101-111.
-
Perrine D (1978) The mangrove crab (_Scylla serrata_) on Ponape. Marine Resources Division, Ponape, East Caroline Islands, Trust Territory of the Pacific Islands.
-
Hyland SJ, Hill BJ, Lee CP (1984) Movement within and between different habitats by the portunid crab Scylla serrata. Mar Biol (Berl) 80: 57-61.
-
Hill BJ (1994) Offshore spawning by the portunid crab Scylla serrata (Crustacea: Decapoda). Mar Biol (Berl) 120: 379-384.
-
Hill BJ (1975) Abundance, breeding and growth of the crab Scylla serrata in two South African estuaries. Mar Biol (Berl) 32(2): 119-126.
-
Hill BJ (1978) Activity, track, and speed of movement of the crab Scylla serrata in an estuary. Mar Biol (Berl.) 47(2): 135-141.
-
Chandrasekaran VS, Natrajan R (1994) Seasonal abundance and distribution of seeds of mud crab Scylla serrata in Pichavaram mangrove, Southeast India. J Aquacult Trop 9: 343-350.
-
Islam S (2013) Status of mud crab aquaculture in Bangladesh. In: Proceedings of National Seminar on Mud crab aquaculture and fisheries management. Emillia TQ, Fe Dolores PS, Thampi Sam Raj YC, Mandal A (Eds.), Rajiv Gandhi Centre for Aquaculture, India, pp: 01-06.
-
Raj MM (1992) A review of the mud crab (_Scylla_ _serrata_) fishery on the east coast of India and in Kerala State. Report of the seminar on the Mud Crab Culture and Trade. Surat Thani, Thailand, Bay of Bengal Programme, Brackish water culture, BOBP/ REP/51, Madras, India, pp: 103-124.
-
Ladra FD, Lin CJ (1991) Trade and Marketing practices of mud crab in the Philippines. Report of the seminar on the Mud Crab Culture and Trade. Surat Thani, Thailand, Bay of Bengal Programme, Brackish water culture, BOBP/REP/51, Madras, India, 211-221.
-
Moyle PB, Leidy RA (1992) Loss of biodiversity in aquatic ecosystems: Evidence from fish faunas. In Conservation Biology: The Theory and Practice of Nature Conservation, Preservation, and Management. Chapman and Hall, New York, USA, pp: 128-169.
-
Chakraborty BK (2009) Aquatic biodiversity of Someswari and Nethai River; Gharia and Nidaya Beel of Northern Bangladesh. In Aquaculture Research Progress, Nova Science Publishers, New York, USA, pp: 3231-268.
-
Chakraborty BK (2010) Status and Position of Aquatic Biodiversity of Four Beels and its Floodplain Level of Northern Bangladesh with a Good Practice of Beel Nurseries and Community Based Co-Management Policy. In Advances in Environmental Research, Nova Science Publishers, New York, USA, 8: 121-164.
-
Nandi NC, Dev Roy MK (1990) Burrowing activity and distribution of Scylla serrata (Forska° l) from Hooghly and Matla estuaries, Sundarban, West Bengal. 88(2): 167-171.
- Genetic Improvement of Nile Tilapia (Oreochromis niloticus): Advances in Selective Breeding and Genomic Approaches for Sustainable Aquaculture
- Microplastics, Contaminants, and Waste Hotspots: Divergences and Faults in Prioritizing Control Efforts
- Creating a Healthier, More Vibrant Open and Closed Aquatic Environment. A Submersible, Centrifugal Magnetically Affixed Current Changing Aquarium Pump
- An Attempt to Assess Alpha Diversity and Sample Size: Using the Ostracod Assemblages off Kumamoto Port, Japan
- Assessment of the Efficiency of Common Fishing Gears and Crafts Used at Mohananda River of Chapai Nawabganj, Bangladesh
- Fish Productivity and Biodiversity Status of Sundarban Mangrove in Bangladesh