Assessment of the Water Quality Parameters of Tagwai Reservoir, Nigeria
Assessment of some of the physico-chemical parameters of Tagwai Reservoir, Minna, Niger State, Nigeria was carried out for the period of four months (January, 2018 to April, 2018). Four sampling stations were located on the reservoir, which included Kwatan Bello, Kwata Birgi, Hanyin Danladi, and Kwatan Raga. Water samples were collected twice in a month. Total of thirty two samples were collected and analyzed. Water temperature, pH, Transparency, Total hardness, Total alkalinity, Electrical conductivity, Biochemical oxygen demand, Dissolved oxygen, Nitrate-nitrogen, phosphate phosphorus, and Total dissolved solid were assessed. The results indicated that apart from Total Dissolved Solid, there was significantly different (P0.01) from each other. Only Total Dissolved Solid showed a significant difference (P
Introduction
Water is known to be one of the most important compounds to the ecosystem. Water of better quality is described by its physical, chemical and biological characteristics. Water occupies about seventy percent (70%) of the earth’s surface being the most abundant liquid in the world [1]. The water that is fit for human consumption is called drinking water or potable water. Water that is not fit for drinking but is not harmful for humans when used for swimming or bathing is called by various names other than potable or drinking water, and is sometimes called safe water, or “safe for bathing”. The development of many towns and cities requires construction of water reservoirs across rivers and streams to supply piped water for domestic use. Tagwai reservoir is a major reservoir in Minna, Niger State. The reservoir serves some purposes including fisheries, irrigation of farmlands, recreation and transportation. The rapid increase in population and the dependence on the water bodies for use therefore demands a proper understanding of the dynamics of the water, as the only medium where aquatic communities thrives [2]. It is therefore desirable to assess the Tagwai reservoir by collecting and analyzing the water samples from different stations with a view to studying the physical and chemical parameters, so as to establish the water quality status of the reservoir.
Materials and Methods
Study Area
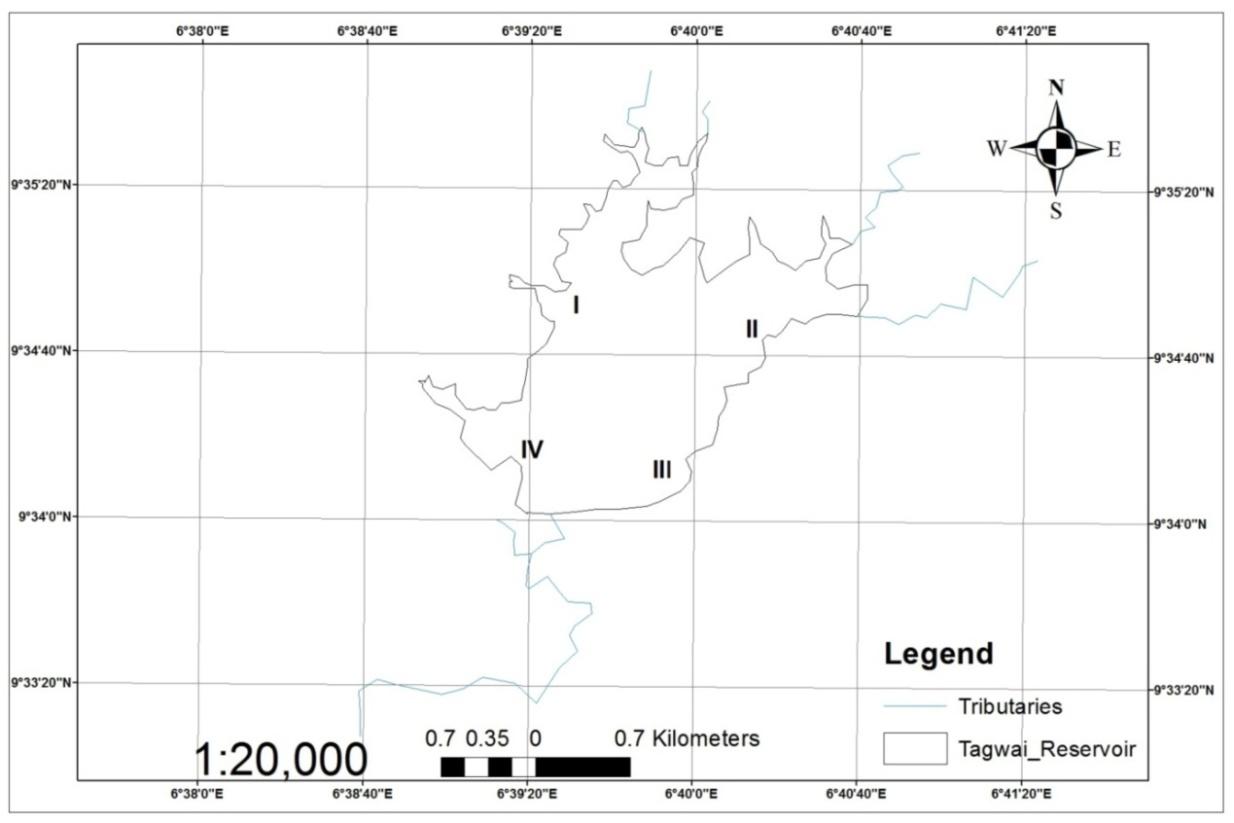
Tagwai Reservoir is located between longitude 6° 39’E and longitude 9° 44’E and latitude 9° 34’N and latitude 9° 37’N in Minna, Niger State.The construction work of the Reservoir started in November 1997 and the reservoir was impounded on schedule in the rainy season of 1998. The reservoir is 25m high and 1.8km long. The reservoir has a capacity of 28.3million cubic meters [3] (Figure 1).
Sampling Stations
The water samples from Tagwai reservoir were collected from four different stations twice in a month, in sampling bottles from January, 2018 to April, 2018. The sampling stations include the following: Sampling station I, Kwatan Bello: This station is close to a settlement where farming activities is practiced. Sampling station II, Kwatan Birgi: This station is in the town not close to the farmland. Sampling station III, Hanyin Danladi: This station is close to a settlement where swimming and washing take place. Sampling station IV, Kwatan Raga: This station is one of the places where fishing activities take place.
Analysis of the physico -chemical parameters
Temperature, pH, and Transparency were recorded using Temperature/Dissolved Oxygen meter and pocket digital pH meter, Transparency was measured using Spectrophotometer. Electrical conductivity was measured using a Unicam Pye model (292) conductivity meter, Total dissolve matter was calculated by multiplying the specific conductivity value of the water from the reservoir by 0.65 [4].
Total alkalinity was determined by phenolphthalein alkalinity titration method and Nitrate – Nitrogen value determined by phenoldisulphonic acid method [5]. While other parameters such as Biochemical oxygen demand (BOD), Dissolved oxygen (DO2), phosphate-phosphorus (PO4–PH), and, total hardness was estimated in the laboratory by using standard equipment and methods.
Statistical Analysis
Data collected were subjected to statistical analysis. One-way analysis of variance (ANOVA) was used to test for differences, while the means were compared using Least Significant Difference (LSD) Test.
Results
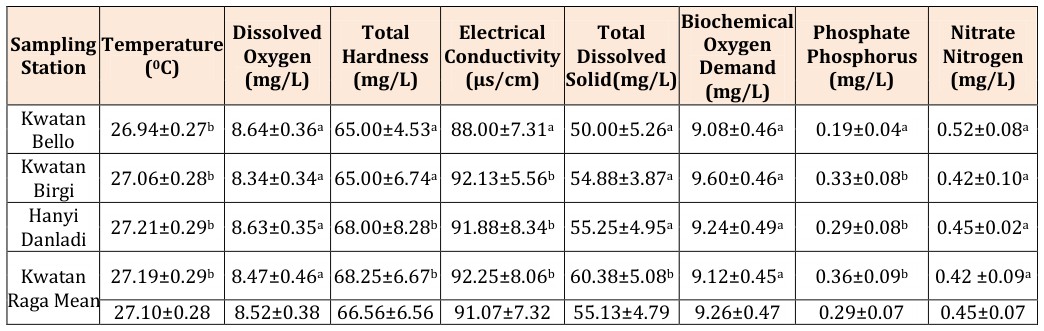
There were few variations in the physical and chemical parameters in the sampling stations. The results are detailed in Table 1, 2 and 3. Analysis of variance (ANOVA) (Table 1) showed that only total dissolved solid was significantly different at P<0.05while other parameters such as transparency, temperature, pH, dissolved oxygen, electrical conductivity, biochemical oxygen demand, phosphate–phosphorus, total alkalinity, total hardness, and nitrate- nitrogen were insignificant at P>0.05. Table 2 revealed that the mean monthly transparency was significantly higher (P<0.05) in January (16.88±2.15) than in remaining months. The mean transparency in March was not significantly different (P>0.05) from that recorded for the month of April. Temperature recorded for the month of February (27.89±0.17) was not significantly different from that of March (27.41±0.24), whereas, the mean monthly Temperature recorded in the month of January and April was significantly lower than that recorded for the month of February and March. Water pH recorded in January (6.62±0.11) was not different significantly (P>0.05) from that of February (6.90±0.03). Table 3 showed that there were no significant difference (P>0.05) in the mean physico - chemical parameters between pH, dissolved oxygen, biochemical oxygen demand and nitrate-nitrogen in all the four sampling stations. In the case of transparency, Hanyin Danladi, had the least transparency value when compared to other sampling stations, with a significantly highest Transparency value in Kwatan Raga. The mean total alkanity was higher (P<0.05) in Kwatan Bello, Kwatan Birgi, and Hanyin Danladi when compared to that of Kwatan Raga with a lower total alkalinity. Total Hardness is significantly higher (P<0.05) in Kwatan Bello and Kwatan Birgi when compared to that of Hanyin Danladi and Kwatan Raga. On the other hand, the mean electrical conductivity recorded at Kwatan Bello was significantly lower (88.00±7.31) than those recorded for other sampling stations. The mean total dissolved solid was significantly lower (P>0.05) in Kwatan Raga than in the remaining 3 sampling stations. The mean total dissolved solid is significantly lower (P>0.05) in Kwatan Raga than in the remaining three sampling stations. Phosphate-phosphorus had the least value recorded at Kwatan Bello, this is statistically significant (P<0.05) from the value recorded for other sampling stations.
Source: Niger State Water Board, Minna, Niger State, Nigeria.
Transparency (NTU)
Temperature (OC)
pH Between Groups 28.051 3 9.35 59.037 0 Within Groups 4.435 28 0.158 Total 32.486 31 Total Alkalinity(mg/L) Between Groups 3937.125 3 1312.375 3.939 0.018 Dissolved Oxygen(mg/L) Test parameter Variations Sum of Squares df Mean Square F Sig.
Between Groups 591.094 3 197.031 18.773 0 Within Groups 293.875 28 10.496 Total 884.969 31 Between Groups 12.405 3 4.135 19.574 0 Within Groups 5.915 28 0.211 Total 18.32 31 Between Groups 7.191 3 2.397 19.801 0 Within Groups 3.389 28 0.121 Total 10.58 31
| Within Groups | 9328.75 | 28 | 333.17 | ||||||||||||||
|---|---|---|---|---|---|---|---|---|---|---|---|---|---|---|---|---|---|
| Total | 13265.88 | 31 | |||||||||||||||
| Between Groups | 2456.375 | 3 | 818.792 | 2.999 | 0.047 | ||||||||||||
| Total Hardness(mg/L) | Within Groups | 7645.5 | 28 | 273.054 | |||||||||||||
| Total | 10101.88 | 31 | |||||||||||||||
| Between Groups | 4835.625 | 3 | 1611.875 | 5.995 | 0.003 | ||||||||||||
| Electrical Conductivity(µs/cm) | |||||||||||||||||
| Within Groups | 7528.25 | 28 | 268.866 | ||||||||||||||
| Total | 12363.88 | 31 | |||||||||||||||
| Between Groups | 1125 | 3 | 375 | 2.325 | 0.096 | ||||||||||||
| Total Dissolved Solid(mg/L) | Within Groups | 4516.5 | 28 | 161.304 | |||||||||||||
| Total | 5641.5 | 31 | |||||||||||||||
| Between Groups | 22.14 | 3 | 7.38 | 9.315 | 0 | ||||||||||||
| Biochemical Oxygen Demand(mg/L) | |||||||||||||||||
| Within Groups | 22.185 | 28 | 0.792 | ||||||||||||||
| Total | 44.325 | 31 | |||||||||||||||
| Between Groups | 0.957 | 3 | 0.319 | 14.314 | 0 | ||||||||||||
| Phosphate- Phosphorus(mg/L) | |||||||||||||||||
| Within Groups | 0.624 | 28 | 0.022 | ||||||||||||||
| Total | 1.581 | 31 | |||||||||||||||
| Between Groups | 0.45 | 3 | 0.15 | 3.801 | 0.021 | ||||||||||||
| Nitrate-Nitrogen(mg/L) | Within Groups | 1.105 | 28 | 0.039 | |||||||||||||
| Total | 1.555 | 31 |
Table 1: ANOVA showing variations of the Physico-chemical parameters at the sampling station of Tagwai Reservoir, Minna, Niger St
| Month e | ||||||||||||||||||||||||||||||
|---|---|---|---|---|---|---|---|---|---|---|---|---|---|---|---|---|---|---|---|---|---|---|---|---|---|---|---|---|---|---|
| B | iochemic | al | ||||||||||||||||||||||||||||
| D | issolve | d | Total | Total | C | Electrical onductivit (µs/cm) | Total y Dissolved Solid (mg/L | ) | P P | hosphate – | N | Nitrate- | n | |||||||||||||||||
| Transpar | ) | T | emperatur | e | Oxygen | |||||||||||||||||||||||||
| pH | Oxygen | Alkalinity | Hardness | hosphorus | itroge | |||||||||||||||||||||||||
| ncy (NTU | (OC) | Demand | ||||||||||||||||||||||||||||
| (mg/L) | (mg/L) | (mg/L) | (mg/L) | (mg/L) | ||||||||||||||||||||||||||
| (mg/L) | ||||||||||||||||||||||||||||||
| January 1 | 6.88±2.15c | 26.89±0.12a | 6.62±0.11a | 7.38±0.19a | 71.88±3.21b | 68.00±4.94b | 94.63±7.69b | 55.88±4.79b | 8.63±0.52a | 0.03±0.01a | 0.61±0.09d | |||||||||||||||||||
| February 1 | 0.25±0.53b | 27.89±0.17b | 6.90±0.03a | 7.86±0.08a | 48.88±5.06a | 56.50±7.05a | 71.87±3.00a | 45.38±4.49a | 8.26±0.20a | 0.25±0.08b | 0.49±0.09c | |||||||||||||||||||
| March | 6.00±0.46a | 27.41±0.24b | 7.61±0.18b | 9.16±0.14b | 70.75±5.76b | 61.75±7.69b | 106.00±7.49 | c 58.13±5.66b | 9.92±0.22ab | 0.46±0.05c | 0.29±0.03a | |||||||||||||||||||
| April | 6.75±0.37a | 26.21±0.06a | 7.75±0.13b | 9.69±0.12b | 78.25±9.88c | 80.00±1.86c | 91.75±3.21b | 61.13±2.35c | 10.23±0.21b | 0.43±0.04c | 0.39±0.05b | |||||||||||||||||||
| Mean | 9.97±0.87 | 27.10±0.14 | 7.22±0.11 | 8.52±0.13 | 67.44±5.98 | 66.56±5.39 | 91.06±5.35 | 55.13±4.32 | 9.26±0.29 | 0.29±0.05 | 0.45±0.07 |
Table 2: Mean monthly values of some physico-chemical parameters of Tagwai Reservoir, Minna, Niger State. Mean with the same supe
Table 2: Mean monthly values of some physico-chemical parameters of Tagwai Reservoir, Minna, Niger State. Mean with the same superscript alphabets in the column are not significantly different at P>0.05 level of significant from Least Significance Difference Test (LSD) using SPSS Version 20.0. ± Standard error of mean (SE) of duplicate determinations.
| Month |
|---|
- Biochemical
- Dissolved
- Total
- Hardness
- Electrical
- Conductivity
- Total
- Dissolved
- Solid(mg/L)
- Phosphate
- Phosphorus
- Sampling
- Temperature
- Oxygen
- Demand
- Oxygen (mg/L)
- Station (0C)
- (mg/L)
- (µs/cm)
- (mg/L)
- (mg/L)
- Kwatan
- Bello
- 26.94±0.27b 8.64±0.36a 65.00±4.53a 88.00±7.31a 50.00±5.26a 9.08±0.46a
- 0.19±0.04a
- 0.52±0.08a
- Kwatan
- Birgi
- 27.06±0.28b 8.34±0.34a 65.00±6.74a 92.13±5.56b 54.88±3.87a 9.60±0.46a
- 0.33±0.08b
- 0.42±0.10a
- Hanyi
- Danladi
- 27.21±0.29b 8.63±0.35a 68.00±8.28b 91.88±8.34b 55.25±4.95a 9.24±0.49a
- 0.29±0.08b
- 0.45±0.02a
- 27.19±0.29b 8.47±0.46a 68.25±6.67b 92.25±8.06b 60.38±5.08b 9.12±0.45a
- 0.36±0.09b
- 0.42 ±0.09a
- Kwatan
- Raga Mean
- 27.10±0.28
- 8.52±0.38 66.56±6.56 91.07±7.32
- 55.13±4.79
- 9.26±0.47
- 0.29±0.07
- 0.45±0.07
Table 4: Mean value of some Physico-chemical Parameters at four sampling station of Tagwai Reservoir Minna, Niger
Discussion
The mean transparency value for Tagwai reservoir was highest in January (16.8NTU) and lowest in March (6.0NTU). There was no significant difference (P>0.05) in transparency in term of stations at Kwatan Birgi and Kwatan Raga. Higher Transparency in May was due to runoff from rain, as well as gradual settling of suspended particles [6]. Ibrahim, et al. [7] also made similar observation in the study of Kontagora reservoir.
The Temperature ranged between 26.89OC-27.8OC. This falls within the range of aquaculture reported by Dupree and Hunner [8], who observed that warm water fish grow best at 25OC-32OC.
The Hydrogen ion concentration value ranges from 6.62-7.75 and was within the range for inland waters (pH 6.5 – 8.5), as reported by Antoine and Al – Saadi [9]. The pH was highest in March and April (7.6± 0.18; 7.15 ± 0.13) and lowest in January and February (6.62 ± 0.11; 6.90 ± 0.03). This variation may be due to biological activities and changes in temperature [10]. Thus, the pH value range obtained in this study is within acceptable level of 6.0 – 8.5 for culturing tropical fish species [12], and for the recommended level for drinking water [11]. Federal Environmental Protection Agency (F.E.P.A) recommended 6.5 - 8.5 for drinking water and 6.0 – 9.0 for aquatic life.
The Total Alkalinity was significant at (P<0.05) in the month of February and April (78.25mg/L-48.88mg/L). The maximum value was recorded in April (78.25mg/L) and minimum in February (48.88mg/L). However, Total Alkalinity was higher in Kwatan Bello (70.38mg/L) and lowest in Kwatan Raga (63.63mg/L). This agrees with the observation of Yakubu et al. [13] who recorded highest alkalinity to be 70.0mg/L and lowest as 40.20mg/L.
Total Hardness recorded ranged from 56.50mg/L- 80.0mg/L. This agrees with the observation of Manjare, et al. [14] who recorded water hardness as ranged 70mg/L- 179mg/L.
Total Dissolved Solid recorded fluctuates from 45.38mg/L-61.13mg/L. The maximum value was recorded in April (61.13mg/L) and the minimum in February (45.38mg/L).This was as a result of high rainfall. The total dissolved solid and biochemical oxygen demand correlated positively. This agrees with the findings of Ojutiku and Kolo [15] who observed that vegetation and organic load in water depleted oxygen in Kigera reservoir and that conductivity, nitrate and biochemical oxygen demand are the function of productivity and vegetation growth.
In the present study, Electrical Conductivity varies from 71µs/cm-106µs/cm. The highest value of conductivity was in March and it indicates a large quantity of dissolved minerals salt in water, thereby rendering it sour and unsuitable for consumption. Similar observation was made by Sangpal, et al. [16].
Biochemical Oxygen Demand from 8-10mg/Lfall within the acceptable value or range of standard for drinking water. High Biochemical Oxygen Demand was recorded in April due to huge load of sediment and sewage from nearby village. However, this is in agreement with the findings of Yakubu, et al. [13].
The phosphate-phosphorus and Nitrate-Nitrogen recorded ranged from 0.03mg/L-0.46mg/L and 0.2mg/L- 0.61mg/L respectively. This is within the tolerable limit recommended by the World Health Organization [17], Ekom and John [18] have similar observation in Cross River State. Ekom and John [18] reported that the absence of zooplankton could decrease phosphate concentration. However, low values recorded could be due to dilution effects of the rains and flood water.
Dissolved Oxygen values of 7.38 mg/L -9.69 mg/L in this study is similar to those reported for many other polluted Nigeria waters including 0.58mg/L to 10.0mg/L for mangrove swamps of Lagos Lagoon [19], 1.20mg/L to 9.40mg/L documented by Edokpayi and Osimen [20] for some polluted water bodies in Nigeria.
Conclusion
The study of physical and chemical properties of water provides reasonable background information into the quality of water present in lakes, rivers, oceans, canals and ground water. One of the most important nutrients for man, animals and plants is water, without which they cannot survive. The increasing concentration of various chemicals generated from the industries and their subsequent release to the surrounding environment, as well as the domestic water, raised a wide spread and increasing public concern over their negative effects on human health and environment.
The result from this study showed that Transparency was high in all the stations and is not within the recommended value of standard of drinking water. Also, the water in the sampling stations was hard and hence not suitable for domestic home activities, while other parameters are normal and within the safety standard of World Health Organization [17].
Acknowledgment
We are grateful to the entire staffs of the Laboratory of Biological sciences Department of Ibrahim Badamasi Babangida University, Lapai, Niger State, Nigeria for providing technical assistance. We also acknowledge the financial assistance receive from the management of Ibrahim Badamasi Babangida University through Tertiary Education trust fund for sponsoring this research.
Contributions
We are thankful for Tertiary Education trust fund for the financial contribution provided and also the members of tagwai community for their cooperation and information during the research.
References
-
Agbabiaka TO, Oyeyiola GP (2012) Microbial and physicochemical assessment of Foma River, Itanmo, Ilorin, Nigeria: An Important source of domestic water in Ilorin metropolis. International Journal of Plant, Animal and Environmental science 2(1): 209- 216.
-
Kolo RJ, Tukura MD (2007) Aspects of limnological studies of Tagwai Dam, Minna, Niger State, Nigeria. Journal of Aquatic Sciences 22(1): 59-64.
-
Kolo RJ, Ojutiku RO, Musulmi DT (2010) Plankton communities of Tagwai Dam Minna, Nigeria. Continental Journal of Fisheries and Aquatic Science 4: 1-7.
-
O’wen TL (1979) Handbook of common methods in limnology 2nd (Edn.), CV Mosby Company, London, pp: 199.
-
Mackereth FJH (1963) some methods of water analysis for limnologists. Fresh water Biol Ass Scient Publs 21: 72.
-
Khan MAG, Choudhary SH (1994) Physical & Chemical Limnology of Lake Kaptai, Bangladesh. Water research 35(1): 2324-2456.
-
Ibrahim BU, Auta J, Balogun JK (2009) An Assessment of the Physico-chemical parameters of Kontagora Reservoir, Niger State, Nigeria. Bayero Journal of Pure and Applied Sciences 2(1): 64-69.
-
Dupree HA, Hunner JU (1984) The Status of warm Water Fish Farming and progress in Fish Farming Research. U.S. Fish and Wild Life Service, Washington DC, USA, pp: 155.
-
Antoine SE, Al Saadi HA (1982) Limnological studies on the polluted Ashar Canal at Basra (Iraq). In: Reveges hydrobiologia 67: 405- 418.
-
Adebowale KO, Agunbiade FO, Olu Owolabi BI (2008) Impacts of Natural and Anthropogenic Multiple Sources of Pollution on the Environmental Conditions of Ondo State Coastal Water Nigeria. EJEAF Che 7(4): 2797-2811.
-
Huett M (1997) Text Book of Fish Culture, Breeding and Cultivation of Fish. 2nd (Edn.), Fishing News Books, Publ, University Press, Cambridge, pp: 438.
-
World Health Organization (WHO) (1984) Guide lines for drinking water quality. World Health Organization, Geneva, pp: 211.
-
Yakubu UP, Oyero JO, Zakari BH, Ibrahim A (2014) The Assessment of the Water Quality Parameters of Agaie/Lapai Dam in Niger State, Nigeria. Global Journal of Bio-Science and Bio-technology 3(2): 139- 148.
-
Manjare SA, Vhanalakar SA, Muley DV (2010) Analysis of Water Quality using Physico- Chemical Parameters, Tamdalge Tankin Kolhapur District, Maharashtra. International Journal of Advanced Biotechnology and Research 2: 115-119.
-
Ojutiku EP, Kolo RJ (2011) Temporal and spatial variations in some physico-chemical parameters of River Chanchaga, Niger State, Nigeria. Journal of Applied Biosciences 47: 3242-3245.
-
Sangal RR, Kulkarni UD, Nandurkar JA (2012) An Assessment of the Physico-chemical Properties to Study the Pollution of Potentials of UJJANI Reservoir, Solapur District, India. APRN Journal of Agriculture and Biological Science 6(3): 34-38.
-
World Health Organization (WHO) (1991) International Standards for drinking Water. 3rd(Edn.), World Health Organization, Geneva.
-
Ekom RA, John OO (1993) Seasonal Variation in Water Quality of the Cross River, Nigeria. Journal of Tropical Hydrobiology 26(2): 95-103.
-
Lawson EO (2011) Physico-chemical Parameters and Heavy Metal Contents of Water from Mangrove Swamps of Lagos Lagoon, Lagos, Nigeria. Advances in Biological Research 5(1): 08-21.
-
Edokpayi CA, Osimen EC (2001) Hydro-biological Studies on Ibiekuma River at Ekpoma Southern Nigeria after impoundment: The Faunal Characteristic. African Journal of Science and Technology 2(1): 72-81.
- Genetic Improvement of Nile Tilapia (Oreochromis niloticus): Advances in Selective Breeding and Genomic Approaches for Sustainable Aquaculture
- Microplastics, Contaminants, and Waste Hotspots: Divergences and Faults in Prioritizing Control Efforts
- Creating a Healthier, More Vibrant Open and Closed Aquatic Environment. A Submersible, Centrifugal Magnetically Affixed Current Changing Aquarium Pump
- An Attempt to Assess Alpha Diversity and Sample Size: Using the Ostracod Assemblages off Kumamoto Port, Japan
- Assessment of the Efficiency of Common Fishing Gears and Crafts Used at Mohananda River of Chapai Nawabganj, Bangladesh
- Fish Productivity and Biodiversity Status of Sundarban Mangrove in Bangladesh