Applications of Remote Sensing in Oceanographic Research
Remote sensing (RS) has a wide range of applications in the field of physical, biological, coastal, satellite oceanography. RS in Oceanographic research is the collection of oceanographic, monitoring of coastal and oceanic processes data and analysis various processes using space borne and air borne sensors. RS offers many advantages over conventional procedures such as synoptic coverage, repeated observations, and area averaging. The main applications are ocean weather and climate studies, measuring primary productivity, water quality monitoring, detection of potential fishing zone, marine life assessment, marine pollution monitoring, determination of near shore bathymetry and mapping, sensing of ocean current and wave, human impacts on marine and coastal life etc. This study aims to identify and explain the importance of RS, advancements, rationality of applications, and future trends in oceanic research.
Introduction
Remote sensing (RS) is the science and art of obtaining information about an object, area or phenomenon through an analysis of the data acquired by a device which is not in contact with the object, area or phenomenon under investigation [1]. Ocean is vast and complex so the observation, monitoring and studies of oceanic process and aspects are critical. Understanding the oceans is vital for pure scientific curiosity, global climate change issues, fisheries, aquaculture conservation, minerals resource (both renewable and non-renewable) exploitation, coastal zone management, transportation/recreation, marine pollution hazards and submarine communication and acoustic propagation for strategic planning. There are several complementary approaches to studying the ocean: (1) observations, (2) process models, including pure theory and simplified numerical models, (3) simulations of the flow using complex numerical models, (4) combined observational/numerical modeling simulations (data assimilation) and (5) statistical approaches/soft computing techniques like multiple regression, genetic algorithm or artificial neural networks etc.
RS utilizes satellite and/or airborne based sensors to collect information about a given object or area. Radiation that is emitted or reflected by the object or water body, is recorded by sensors. Light (Figure 1) from the sun through the water body to the remote sensing sensor (passive remote sensing). The possible interactions are absorption and scattering by the water constituents, reflection and absorption by the sea surface, reflection and refraction at the water/air interface and absorption and scattering by the atmosphere.
![Figure 1: Simple Data collection techniques in water body via remote sensing [2].](/fulltextimages/3354/fig_1.jpeg)
RS is so high sophisticated technology for this purpose. The benefits of RS in oceanography include the ability to collect data over vast ocean to characterize natural features or physical objects on the ground, to observe surface of ocean and objects on a systematic basis and monitor their changes over time, and the ability to integrate this data with other information to aid decision making. RS from satellites can be collected at various spatial resolutions. Images can detect features in a size range of tens to hundreds of meters or larger. Remote sensing instruments may also acquire data in different spectral bands of the electromagnetic spectrum which provides information. Application of RS in Oceanographic research refers to collection of oceanographic data and analysis various processes using space borne and air borne sensors. monitoring of coastal and oceanic processes is very important in sea level, sea surface temperature (SST) changes due to climate change and global warming, shore line changes, coastal morphology due to dynamic nature of coastal zone, detection of chlorophyll content, oil spill, suspended or dissolved matter, algal bloom, measurement of near shore bathymetry, natural hazards, management of coastal zone, exploration and exploitation living and nonliving resource and determination of human impacts [3].
| S | .No | . | Parameters | Satellite and their data used | Uses | ||||||
| 1 | Sea surface temperature(SST) | MODIS, AMSRE, TMI | Helps in the study of climate change and weather forecasting | ||||||||
| 2 | Total suspended solids (TSSs) | DEIMOS-1, LANDSAT, ASTER | Provides information of hydrodynamic modelling of coast | ||||||||
| 3 | Chlorophyll content | SeaWiFS, IKONOS, IRS P4 OCM | Indicates the concentration of phytoplankton | ||||||||
| 4 | Potential fishing zone | NOAA AVHRR, IRS OCM | Indicates highly potentials of fishing | ||||||||
| 5 | Wave height and spectra | GEOSAT, ASAR (ENVISAT) | Provides information for navigation | ||||||||
| 6 | Sea surface height, wind speed | Topex /Poseidon, ERS-1, ERS-2 | Detection of mid-scale sea surface, importance variables in ocean mixtures | ||||||||
| 7 | Surface current, front, circulation | POES/AVHRR, GOES/IMAGER, JASON-1 | Wave and current modelling |
Table 1: Ocean parameters with their importance of each parameters [4,5].
Materials and Methods
This study was based of secondary information. To collect secondary data, an intensive literature review related to RS, RS development status, RS application approaches in Oceanography context were conducted through an online and offline in addition, relevant policy documents and government reports were also collected from government agencies through personal contacts the secondary data and graphic illustrations also was collected from original researchers with permission and open sources software python, R and ArcGIS, MS Excel are used for data analysis and visualization. For data analyses, the “content analysis” method was used. This method is a research tool for interpreting and coding textual material (e.g. documents, books, oral communication, interviews, and graphics) to elicit meaningful information over different themes.
Applications of Remote Sensing in Oceanography
Ocean Weather and Climate Studies
Remote sensing has given major advances in understanding the climate system and its change by quantifying processes and spatio temporal states of atmosphere, land and oceans. Satellite data are frequently used with climate models to stimulate the dynamic of the climate system and to improve climate projections [6]. Sea surface temperature (SST) plays an important role in many oceanic processes that is directly related to heat transfer between ocean and atmosphere and served as important indicator of climate state.in numerical weather prediction models, the SST field exerts its influence in the calculation of surface fluxes over the oceans [3]. The Advanced Very High Resolution Radiometer on board the National Oceanic and Atmospheric Administration (NOAA) satellites allows us to monitor the SST worldwide. Satellite observations also reveal an uneven warming pattern [7].
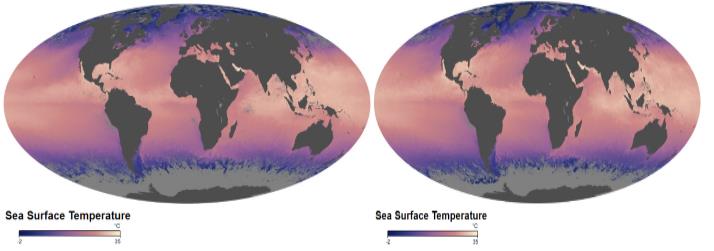
The satellite measures the temperature of the top millimeter of the ocean surface. In this map, the coolest waters appear in blue (approximately 2 degrees Celsius), and the warmest temperatures appear in pink-yellow (35 degrees Celsius). Landmasses and the large area of sea ice around Antarctica appear in shades of gray, indicating no data were collected.
The Map provides estimates of sea level rise based on measurements from satellite radar altimeters. The local trends were estimated using data from TOPEX/Poseidon (T/P), Jason-1, and Jason-2, which have monitored the same ground track since 1992. An inverted barometer has been applied. The estimates of sea level rise do not include glacial isostatic adjustment effects on the geoid, which are modeled to be +0.2 to +0.5 mm/year when globally averaged [8].
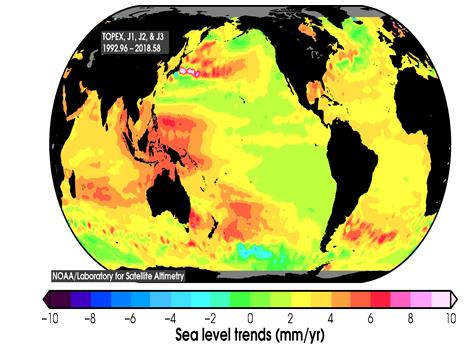
Combined data sets of TOPEX/Poseidon, Jason-1 and Jason-2 produced by the Laboratory for Satellite Altimetry, NOAA (https://www.star.nesdis.noaa.gov/sod/lsa/SeaLevel Rise/LSA_SLR_maps.php).
Mapping and Prediction for Oil Spilling Extent and Drift
Oil spill (OS) can destroy marine life and habitat of land animal as well as human. For OS mapping and prediction some information must need to know these are Spill location, size and extent of oil spill, direction and magnitude, wind, current and wave information for predicting future oil movement. Annually, 48% of the oil pollution in the oceans is fuels and 29% are crude oil. Tanker accidents contribute with only 5% of all pollution entering into the sea. The detection and mapping of oil on a water surface is the most common uses of oil spill remote sensing [9, 10].
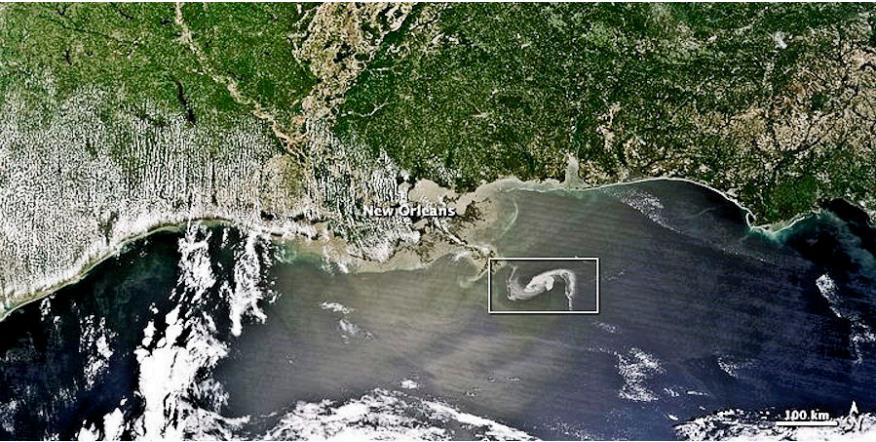
A multi-spectral image was derived from MODIS and corrected by a supervised classification system to enhance and characterize oil on water [9]. Laser fluorosensors use the phenomenon that oil aromatic compounds interact with ultraviolet light, absorb the light energy, and release the extra energy as visible light. The absorption and emission wavelengths are unique to oil [11]. Satellite-based oil pollution monitoring capabilities in the Norwegian waters were demonstrated in the early 1990s by using images from the ERS-1 satellite [12].
Ocean Color Study
Ocean color is an important aspect for RS. It provides numerous potentials and useful information for oceanographic research. Ocean color sensors are having high radiometry to measure water quality with reasonable accuracy and precision. Thermal infrared sensors provide sea surface temperatures (SST) and features with varying sea surface temperatures.
| Application of ocean color | Information from Ocean color sensors | ||||
|---|---|---|---|---|---|
| Provides information for current, eddies, mixing zone etc. | Spatial and temporal distribution of phytoplankton | ||||
| Identify potential fishing zone and upwelling zone | Role of global carbon cycle and other biogeochemical cycles | ||||
| Synoptic maps of ocean color | Processes associated with coastal current, boundary current, eddies etc. | ||||
| Provides information of pelagic ecosystem | Determination of algal bloom |
Table 2: Applications of ocean colors and usefulness of ocean color sensors. Ocean Primary Productivity Measuring Chlorophyll –a
Table 2: Applications of ocean colors and usefulness of ocean color sensors. Ocean Primary Productivity Measuring Chlorophyll –a (chla) is an important parameter that is used in determining open sea (case-1 waters) and coastal water (case-2 waters) quality status or presence of turbid and very high biomass hypertrophic waters. Sensors such as Landsat, SPOT, and IKONOS are also frequently used to estimate Chla [14, 15, 16, 17].
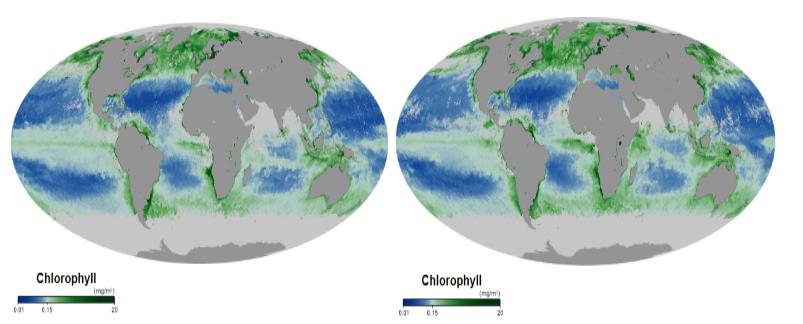
Figure 5: Chlorophyll concentration maps of July 2008 and July 2018 are based on observations by the MODIS on NASA’s Aqua satellite (source: https://earthobservatory.nasa.gov/global- maps/MY1DMM_CHLORA). Places where chlorophyll amounts were very low, indicating very low numbers of phytoplankton are blue. Places where chlorophyll concentrations were high, meaning many phytoplankton were growing, are dark green.
Total Suspended Matter (TSM) and Colored Dissolved Organic Matter (CDOM) Monitoring The study of TSM concentration has a huge ecological importance, because the suspended matter is the main carrier of various inorganic and organic substances and becomes the main substrata for biochemical processes [18]. The TSM concentration affects ocean/coastal productivity, water quality, navigation, and coastal defense. Teodoro AC, et al. presented different methodologies to estimate the TSM concentration in a particular area of the Portuguese coast, from remotely sensed multispectral data (ASTER, SPOT HRVIR, and Landsat TM), based on single-band models, multiple regression, and ANNs [19]. Coloured dissolved organic matter (CDOM) is an important variable for sea land interaction studies and water monitoring .many researchers have showed that the capability to estimate CDOM from satellite RS data [20, 21, 22]. Loisel H, et al. proposed a new method to assess a CDOM, based on the theoretical link between the vertical attenuation coefficient and the absorption coefficient with high accuracy [23].
| Open ocean waters (case-1 waters) | Coastal waters (case -2 waters) | ||||
|---|---|---|---|---|---|
| Pigment concentration | Concentration of three components | ||||
| Bloom dynamics and productivity | Bloom dynamics, productivity, coastal dynamics, sediment transport | ||||
| Carbon cycle | Water quality, carbon cycle, fisheries leisure activities, aquaculture |
Table 3: Visible remote sensing over open and coastal water [24]. Detection of Shoreline Changes HABs could be defined by an incr
Table 3: Visible remote sensing over open and coastal water [24]. Detection of Shoreline Changes HABs could be defined by an increase in the high concentration of a phytoplankton species that has an adverse impact on the environment. They cause eutrophic conditions, depleting oxygen levels needed for organic life, and limiting aquatic plant growth by reducing water transparency. The use of remote-sensing techniques for detecting phytoplankton and mapping HABs could be found in Klemas V [29]. Detection of Potential Fishing Zone Quantitative analysis of SST and Chla can give a clear understating of circulation and distribution of phytoplankton of the surface ocean. RS combined with conventional data collection techniques provides a powerful tool for designing harvesting strategies for living marine resources. Remotely sensed satellite observations of sea surface may provide significant information to assess and improve the potential yield of fishing grounds [30]. Satellite based RS provides synoptic views of the ocean and is capable of detecting mesoscale features through thermal infrared and visible sensors. Hence, it can be useful for locating potential fishing zones (PFZs) [31]. An integrated approach was developed by Solanki HU, et al. using ocean colour monitor (OCM) derived chlorophyll and AVHRR derived SST for locating PFZs in the Indian waters [13]. Coastal and Oceanic Hazards Mapping Storm surges associated with severe tropical cyclones constitute the world’s worst coastal marine hazard which can cause heavy loss of life and property, damage to the coastal structures and losses of agriculture in affected countries [32]. Satellite remote sensors can map coastal ecosystems and their changes cost-effectively at appropriate scales and resolutions, minimizing the need for extensive field and ship measurements. Remote sensing allows to quantitatively retrieving several parameters useful for produce multi-hazard and vulnerability maps [28, 33]. Determination of Near Shore Bathymetry Optical remote sensing offers a cost-effective alternative to echo sounding and bathymetric LiDAR techniques for deriving bathymetric estimates in shallow coastal and inland waters. Monitoring of coastal bathymetry is vital for exploration and exploitation of nonliving and living resources, operations on engineering structures and ocean circulations [3]. The availability of optical high-resolution satellites, such as IKONOS, QuickBird, and WorldView, has renewed interest in applying optical remote-sensing techniques to the retrieval of bathymetric information for shallow coastal and inland waters, due to their high spatial resolution and enhanced water penetration capability [34, 35, 36]. Teodoro A, et al. proposed a model for the estimation of depth based on Principal Component Analysis (PCA) of an IKONOS-2 image, for the Douro River estuary (Porto, Portugal) [37]. Ocean Current and Wave Studies Ocean currents influence the global heat transport, weather and climate, plankton transport, drift of water pollutants; sediment transport; and marine transportation. As a result, oceanographers, coastal managers, and ships need up-to-date information on ocean and coastal currents. Satellite altimetry is one of the essential remote-sensing techniques for monitoring dynamic ocean conditions, including surface currents, local wind speed, and significant wave height. Satellite altimetry measures sea surface heights, providing data on geostrophic circulation, including major ocean currents. Ocean currents can also be determined by satellite synthetic aperture radar (SAR) or tracking the movement of thermal and color features in the ocean [38]. Satellite derived SST data are useful for detecting axis positions of ocean currents and locations of rings generated from the currents as well as giving qualitative description of meander and ring separation. The measurement of wave characteristics such as height, length and direction using Electromagnetic (EM) wave is of the latest development in the field of ocean wave studies [39]. Oceanographic satellites measure properties of the water surface which can then related to either wind speed or wave height [40]. Variability of ocean health can be assessed through the small scale features like oceanic eddies and small scale gyres.
Discussion
Results of various studies revealed that RS can be successfully used to detect and monitor various aspects in ocean. Reynolds, et al. used microwave remote sensing for calculating SST because of its advantages over infra-red SST retrievals [41]. Marcello, et al. used a methodology for measuring wave velocity directly from SPOT-5 satellite image [42]. A Machine learning method used in detection of ocean pollution with the help of satellite image and radar image such as oil spilling, plastics pollution, algal bloom etc. Oil spill detection currently requires a highly trained human operator to assess each region in each image [43]. Klemas V used to determine ocean current by satellite synthetic aperture radar (SAR) or tracking the movement of thermal and color features in the ocean [39]. Monitoring of coastal bathymetry is vital for exploration and exploitation of nonliving and living resources, operations on engineering structures and ocean circulations [3]. The availability of optical high-resolution satellites, such as IKONOS, QuickBird, and WorldView, has renewed interest in applying optical remote- sensing techniques to the retrieval of bathymetric information for shallow coastal and inland waters. The detection and mapping of oil on a water surface is the most common uses of oil spill remote sensing [9, 10]. RS has numerous usages in Oceanographic research.
Conclusion
The advantages of remote sensing include the ability to collect information over large spatial areas; to characterize natural features or physical objects on the ground; to observe surface areas and objects on a systematic basis and monitor their changes over time; and the ability to integrate this data. Nowadays, machine learning application in remote sensing has brought revolution. This must be applied in ocean studies in broad scale. This review focused to explain that RS has made crucial contribution to our understanding of the ocean climate systems, ocean ecosystem monitoring, ocean and coastal based pollution detection and sophisticated management technology. Along with advancing the science and technology of RS, strong international collaboration and government support are needed to enhance its in oceanographic research. Acknowledgement: I would like to express my deepest appreciation to all those who provided me documents and published papers to complete this review. And there has been no financial support for this work.
References
-
Jonathan C, Lillesand T, Kiefer RW (1980) Remote Sensing and Image Interpretation. 146(3).
-
Laanen M (2007) Yellow Matters–Improving the remote sensing of Coloured Dissolved Organic Matter in inland freshwaters: 209-213.
-
Pandey PC, Kumar R, Varma AK, Mathur AK, Chaturvedi N (2008) Remote sensing applications to coastal oceanography. Model Monit Coast Mar Process pp: 45-67.
-
Guo HD, Zhang L, Zhu LW (2015) Earth observation big data for climate change research. Adv Clim Chang Res 6(2): 108-117.
-
Devi GK, Ganasri BP, Dwarakish GS (2015) Applications of Remote Sensing in Satellite Oceanography: A Review. Aquat Procedia 4: 579-584.
-
Ghent D, Kaduk J, Remedios J, Balzter H (2011) Data assimilation into land surface models: The implications for climate feedbacks. Int J Remote Sens 32(3): 617-632.
-
Yang J, Peng G, Rong Fu, Zhang M, Chen J, et al. (2013) The role of satellite remote sensing in climate change studies. Nat Clim Chang 3(10): 875-883.
-
NOAA (2014) Laboratory for Satellite Altimetry: Sea level rise.
-
Fingas M, Brown C (2014) Review of oil spill remote sensing. Mar Pollut Bull 83(1): 9-23.
-
Brekke C, Solberg AHS (2005) Oil spill detection by satellite remote sensing. Remote Sens Environ 95(1): 1-13.
-
Brown CE (2017) Chapter 7- Laser fluorosensors. Oil Spill Science and Technology 2nd (Edn.), Gulf Publishing Company, Cambridge, MA, USA, pp: 403- 417.
-
Bern TI, Wahl T, Anderssen T, Olsen R (1993) Oil-Spill Detection Using Satellite Based Sar - Experience from a Field Experiment, Photogrammetric Engineering and Remote Sensing.
-
Solanlki HU, Dwivedi RM, Nayak SR (2001) Application of Ocean Colour Monitor chlorophyll and AVHRR SST for fishery forecast: Preliminary validation results off Gujarat coast, northwest coast of India. Indian J Mar Sci 30(3): 132-138.
-
Su YF, Liou JJ, Hou JC, Hung WC, Hsu SM, et al. (2008) A multivariate model for coastal water quality mapping using satellite remote sensing images. Sensors 8(10): 6321-6339.
-
Duan H, Zhang Y, Zhang B, Song K, Wang Z (2007) Assessment of Chlorophyll-a Concentration and Trophic State for Lake Chagan Using Landsat TM and Field Spectral Data. Environ Monit Assess 129(1-3): 295-308.
-
Glardino C, Candianl G, Zilioli E (2005) Detecting chlorophyll-a in Lake Garda using TOA MERIS radiances. Photogramm Eng Remote Sensing 71(9): 1045-1051.
-
Kiefer I, Odermatt D, Anneville O, Wüest A, Bouffard D (2015) Application of remote sensing for the optimization of in-situ sampling for monitoring of phytoplankton abundance in a large lake. Sci Total Environ 527-528: 493-506.
-
Oyama Y, Matsushita B, Fukushima T, Matsushige K, Imai A (2009) Application of spectral decomposition algorithm for mapping water quality in a turbid lake (Lake Kasumigaura, Japan) from Landsat TM data. ISPRS J Photogramm Remote Sens 64(1): 73-85.
-
Teodoro AC, Marçal ARS, Veloso-Gomes F (2007) Correlation Analysis of Water Wave Reflectance and Local TSM Concentrations in the Breaking Zone with Remote Sensing Techniques. J Coast Res 236(6): 1491-1497.
-
Bricaud A, Morel A, Prieur (1981) Absorption by dissolved organic matter of the sea (yellow substance) in the UV and visible domains. Limnol Oceanogr 26(1): 43-53.
-
Tassan S (1994) Local algorithms using SeaWiFS data for the retrieval of phytoplankton, pigments, suspended sediment, and yellow substance in coastal waters. Appl Opt 33(12): 2369-2378.
-
Doerffer R, Fischer J (1994) Concentrations of chlorophyll, suspended matter, and gelbstoff in case II waters derived from satellite coastal zone color scanner data with inverse modeling methods. J Geophys Res 99(4): 7457-7466.
-
Loisel H, Vantrepotte V, Dessailly D, Mériaux X (2014) Assessment of the colored dissolved organic matter in coastal waters from ocean color remote sensing. Opt Express 22(11): 13109.
-
IOCCG Remote sensing of ocean colour in coastal, and other optically-complex, waters. International Ocean Colour Coordinating Group (IOCCG) Dartmouth, NS, Canada, 200AD.
-
Malthus TJ, Mumby PJ (2003) Remote sensing of the coastal zone: An overview and priorities for future research. Int J Remote Sens 24(13): 2805-2815.
-
Maiti S, Bhattacharya AK (2009) Shoreline change analysis and its application to prediction: A remote sensing and statistics based approach. Mar Geol 257(1-4): 11-23.
-
Kuleli T, Guneroglu A, Karsli F, Dihkan M (2011) Automatic detection of shoreline change on coastal Ramsar wetlands of Turkey. Ocean Eng 38(10): 1141- 1149.
-
Teodoro AC (2018) Optical Satellite Remote Sensing of the Coastal Zone Environment-An Overview. Intech open 2: 64.
-
Klemas V (2011) Remote Sensing of Algal Blooms: An Overview with Case Studies. Hidrobiologica 21(3): 381-413.
-
Zainuddin M, Saitoh K, Saitoh SI (2008) Albacore (Thunnus alalunga) fishing ground in relation to oceanographic conditions in the western North Pacific Ocean using remotely sensed satellite data. Fish Oceanogr 17(2): 61-73.
-
Solanki HU, Mankodi PC, Nayak SR, Somvanshi VS (2005) Evaluation of remote-sensing-based potential fishing zones (PFZs) forecast methodology. Cont Shelf Res 25(18): 2163-2173.
-
Dube SK, Rao AD, Sinha PC, Chittibabu P (2008) Storm surges: Worst coastal marine hazard. Model Monit Coast Mar Process pp: 125-140.
-
Mahendra RS, Mohanty PC, Bisoyi H, Kumar TS, Nayak S (2011) Assessment and management of coastal multi-hazard vulnerability along the Cuddalore- Villupuram, east coast of India using geospatial techniques. Ocean Coast Manag 54(4): 302-311.
-
Kanno A, Koibuchi Y, Isobe M (2011) Statistical combination of spatial interpolation and multispectral remote sensing for shallow water bathymetry. IEEE Geosci Remote Sens Lett 8(1): 64- 67.
-
Lyzenga DR, Malinas NP, Tanis FJ (2006) Multispectral bathymetry using a simple physically based algorithm. IEEE Trans Geosci Remote Sens 44(8): 2251-2259.
-
Teodoro ACC, Almeida R, Gonçalves M (2014) Independent Component Analysis (ICA) performance to bathymetric estimation using high resolution satellite data in an estuarine environment. Proc SPIE Int Soc Opt Eng 9239: 923915.
-
Teodoro A, Gonçalves H, Pais-Barbosa J (2010) Bathymetric estimation through principal components analysis using IKONOS-2 data. 7824: 782419.
-
Klemas V (2012) Remote Sensing of Coastal and Ocean Currents: An Overview. J Coast Res 282(3): 576-586.
-
Crombie S (1971) Techniques for Measuring Ocean Waves 2997: 1-18.
-
Young IR, Donelan MA (2018) On the determination of global ocean wind and wave climate from satellite observations. Remote Sens Environ 215: 228-241.
-
Reynolds RW (2004) Impact of TRMM SSTs on a Climate-Scale SST Analysis. J Clim 17: 2938-2952.
-
de Michele M, Leprince S, Thiébot JO, Raucoules D, Binet R (2012) Direct measurement of ocean waves velocity field from a single SPOT-5 dataset. Remote Sens Environ 119: 266-271.
-
Kubat M, RC Holte, Matwin S (1998) Machine Learning for the Detection of Oil Spills in Satellite Radar Images. Mach Learn 30(2-3): 195-215.
- Genetic Improvement of Nile Tilapia (Oreochromis niloticus): Advances in Selective Breeding and Genomic Approaches for Sustainable Aquaculture
- Microplastics, Contaminants, and Waste Hotspots: Divergences and Faults in Prioritizing Control Efforts
- Creating a Healthier, More Vibrant Open and Closed Aquatic Environment. A Submersible, Centrifugal Magnetically Affixed Current Changing Aquarium Pump
- An Attempt to Assess Alpha Diversity and Sample Size: Using the Ostracod Assemblages off Kumamoto Port, Japan
- Assessment of the Efficiency of Common Fishing Gears and Crafts Used at Mohananda River of Chapai Nawabganj, Bangladesh
- Fish Productivity and Biodiversity Status of Sundarban Mangrove in Bangladesh