Effect of the Site and the Type of Fertilizer on the Taxonomic Composition and Abundance of Phytoplankton Population of Ponds in West Cameroon
Pond fertilization is an age-old practice aimed at optimizing yields in so-called production fish farming systems. With this in mind, a characterization study of phytoplankton, the basis of the trophic food chain leading to fish, was conducted from January to December 2021 in ponds in the West Cameroon regionand at the Research Unit of Ichthyology and Applied Hydrobiology of the University of Dschang. To do this, a total of fifteen (15) ponds including 03 in Bamendou fertilized with cowpat, 04 in Batie including 02 fertilized with pig manure and 02 with wheat bran, 01 in Dschang fertilized with chicken manure, 04 in Fokoue including 02 fertilized with pig manure and 02 unfertilized and 03 in Foumbot fertilized with cowpat, were considered. These ponds were chosen based on the availability of fish farmers and the type of fertilizer administered. Sampling of biotic characteristics including phytoplankton richness, relative abundance and density was done between 6 and 8 a.m. following a monthly frequency. The results showed that the highest specific richness (42.73% of total species richness) was observed in Batie ponds fertilized with pig manure and generic richness (81.53% of total genera richness) and families (84.21% oftotal of families richness) highest phytoplankton in Batie ponds fertilized with wheat bran. Regardless of the type of pond, Chlorophyta were more abundant (40.50%). With the exception of Chrysophyta who were absent in the ponds of Foumbot fertilized with cowpat, all other groups were listed in the different types of ponds. The significantly (p<0.05) highest phytoplankton density (71. 107 ind/L) was observed in ponds fertilized with chicken manure with high concentrations of nitrates and nitrites.
Introduction
The global population growth estimated at 10 billion by 2056 is driven by Africa and other developing countries. In Africa, the population growth rate of about 3% [1], climate change, deforestation, and overexploitation of resources are leading to a substantial increase in demand for food products in general and fisheries in particular. Among fisheries resources, fish provides 51% of protein in the human diet [2]. In this context, man is obliged to grow fish as a support for imports and capture fishing, which sees its catches decrease over the years. Pond fish farming could thus be a way to improve production in view of the plurality of its hydrobiological population. Phytoplankton is one of the essential compartments that condition the food chain in aquatic ecosystems, especially in fish ponds. By definition, it refers to all plant microorganisms suspended in water, capable of photosynthesizing their own organic substance, from solar energy, water, oxygen and nutrient salts [3]. Plant plankton can form blooms as a result of the proliferation of one or a few species under favorable hydroclimatic conditions and in particular the imbalance of control by the nutrient resource or by grazing. The appearance of these blooms is related to several factors, including high nutrient concentrations provided in most cases by fertilization of ponds [4]. At the current state of our knowledge, only the work of has focused on the taxonomic composition of phytoplankton in fertilized ponds in our countries [5]. However, the nature of phytoplankton species must allow their proper integration into the food chain leading to fish. It is therefore important to intensify the study of planktonic algae in order to access the biodiversity of lentic ecosystems and specify the ecology of the species present there. This study, a pioneer in the ponds of the highlands of Western Cameroon, has the general objective of contributing to a better knowledge of the ecology of fish ponds through a characterization of phytoplankton population. More specifically, the aim was to assess the effect of the site and the type of fertiliser on the richness, density and relative abundance of phytoplankton phylums, families, genera and species.
Materials and Methods
The work took place from January to December 2021 in the ponds of the West Cameroon region and at the Research Unit of Ichthyology and Applied Hydrobiology of the University of Dschang. The Geoclimatic features of the study area were as follows. LN: 5° and 6°; LE: 10° and 11°, average altitude: 1400 m, average annual rainfall: 1500 mm, temperature: 14-25°C, dry season: mid-November to mid- March, dry season: mid-March to mid-November.
Features of Plankton Collection Ponds
Three sites were chosen, far enough apart to be considered sufficiently representative of the spatial variation of the ecosystem. Using a questionnaire and direct observations, information on the characteristics of the ponds and their conduct by fish farmers was collected. For this purpose, a total of 15 ponds were selected depending on the type of fertilizer administered. The choice of these ponds was also based on accessibility. All these ponds contained two groups of fish; tilapia (Oreochromis niloticus) and catfish (Clarias gariepinus). The characteristics of the ponds in the study are summarized in Table 1.
| Sites | Geographical Coordinates | Altitude (m) | Types of Fertilizers / Area (m ) 2 | Composition of fertilizer |
|---|---|---|---|---|
| Batie | LN: 5°17’-5°18’ and LE: 10°17’- 10°19’ | 1500 | Wheat bran/700 | N: 0.01 ; P: 0.02 ; N/P: 0.5 ; N: 0.59 ; P : 0.60 N/P: 0,93 |
| Wheat bran/400 | ||||
| Pigmanure/400 | ||||
| Pigmanure/400 | ||||
| Bamendou | LN: 5°22’-5°28’ and LE: 10°52’- 10°54’ | 1400 | Cowpat/400 | N: 0.45 ; P: 0.25 N/P: 1,8 |
| Cowpat/200 | ||||
| Cowpat/100 | ||||
| Fokoue | LN: 5°34’-5°36’ and LE: 10°14’- 10°17’ | 1276 | Pigmanure/700 | N: 0.5; P: 0.45 N/P: 1,11 |
| Pigmanure/60 | ||||
| No fertilizer/260 | ||||
| No fertilizer/100 | ||||
| Dschang | LN: 5°44’-5°48 and LE: 9°85’-10°05’ | 1391 | Chicken manure/300 | N: 3; P: 2 N/P: 1,5 |
| Foumbot | LN: 5º 20’ à 5º 22’ and LE: 10º 17’ à 10º 21’ | 1120 | Cowpat/200 | N: 0.3; P: 0.15 N/P: 2 |
| Cowpat/200 | ||||
| Cowpat/200 |
Table 1: Some characteristics of the ponds in the study.
N: Nitrogen; P: Phosphorus; LN: North longitude; LE: East Latitude East Table 1: Some characteristics of the ponds in the study.
Study Design and Data Collection Determination of physicochemical characteristics of water.
In parallel with the collection of phytoplankton, the physicochemical characteristics of the water were measured monthly according to the techniques recommended by Agadjihouede H, et al. [6]. The transparency, depth, pH, dissolved oxygen, temperature and conductivity of the water were analyzed in situ respectively using a Secchi disc, a limnimeter, a pH meter, an oxi-thermometer and a conductivity meter. A 350 ml water sample was also taken per pond and transported to the laboratory in a refrigerated chamber for the determination of nutrient salts (nitrates, ammoniacal nitrogen, nitrites and phosphates) using a HACH DR/2800 spectrophotometer using APHA [7] methods. The concentration of non-ionized ammonia was deduced from that of ammoniacal nitrogen according to the formula of Pihan JC, et al. [8] below.
$$N - NH_3 = \frac{N - NH_4^+}{1 + 10^{10-pH - 0.03T^\circ C}}$$
Phytoplankton Sampling
Phytoplankton sampling was done monthly between 6 and 8a.m. according to the techniques proposed by Agadjihouede H, et al. [6]. For this purpose, 1liter of water was taken from 20 points distributed to reflect the entire area of the pond between the surface and 30cm on average of the depth of the water. The total volume of water withdrawn by infrastructure of 20L was filtered on a plankton sieve with a 40µm mesh opening according to Groga [3]. After obtaining the filtrate, a volume of 250ml concentrated phytoplankton was introduced into the previously labelled boxes and fixed with formalin at 5% in the proportions of 3/4 of the sample and 1/4 of formalin as recommended by Nguetsop VF, et al. [9] for quantitative and qualitative laboratory analyses.
Qualitative and Quantitative Analysis of Phytoplankton
After homogenization of the phytoplankton concentrate in the laboratory, a 10µl sample was taken using a micropipette and mounted between slide and lamella for qualitative observation of phytoplankton organisms. Thus, for each sample, three slides were prepared to ensure the reproducibility of the slides [9]. Species identification was done under the 40X objective optical microscope following randomly selected vertical transects using Ward HB, et al. [10] identification boards and keys Bourrelly P, et al. [11, 12, 13] and Cardinal C, et al. [14].
The quantitative analysis was performed using a ZEISS 47 12 02 inverted microscope with the 40X lens. To do this, after homogenization of the filtrate, three subsamples of 10ml were taken using a pipette and deposited each in a settling cup. A time of ten to fifteen minutes was then observed to allow sedimentation of phytoplankton organisms [15]. The count was done on six fields taken at random in the cup. Finally, the average number of phytoplankton organisms was estimated knowing the total number of fields per cup, this number was reported per unit volume. Frequency of occurrence (F) of a species was calculated using the formula:
$$F = (\text{Pa/P}) \times 100(4)$$ of which: Pa = total number of samples containing the species taken into consideration; P = total number of samples taken.
Statistical Analyses
Two-factor analysis of variance (ANOVA 2) was used to test the effects of sites and the types of fertilizer on density. Where there were significant differences, Duncan’s test at the 5% threshold was used to separate the means [16]. The Chi-deux test ($X_2$) was used to test the effect of sites and the types of fertilizers on relative abundance. The relationships between the physico-chemical characteristics of water and the density of phytoplankton groups were determined by the Pearson correlation test. For these analyses, the statistical software SPSS Version 20.0 (Statistical Package for Social Sciences) was used.
Results
Richness of Species, Genera, Families and Phylums of Phytoplankton Depending on the Site and the Type of Fertilizer
The influence of the site and the type of fertilizer on the richness and distribution of phytoplankton species, genera, families and phylums is summarized in Table 2. It shows that, regardless of the site and the type of fertilizer, a total of 220 species grouped into 38 genera, 19 families and 5 phylums were identified.
Phytoplankton Species: The species richness summarized in Table 2, showed that the highest value of the specific richness was obtained in the Batie ponds fertilized with pig manure with a percentage of 42.73% of the total species richness. The lowest value was recorded in the ponds of Fokoue regardless of the type of fertilizer administered. At the same site, in Fokoue, the specific riches were comparable regardless of the type of fertilizer used while they were higher in the ponds fertilized with pig manure compared to those fertilized with wheat bran for Batie. When comparing sites with the same type of fertilizer, the highest specific richness was obtained in Batie compared to Fokoue for pig manure. Compared to cowpat, the highest specific richness was observed in Bamendou compared to Foumbot.
Phytoplankton Genera: The highest generic richness (Table 2) was obtained in the Batie ponds, fertilized with wheat bran with a percentage of 81.58% of the total genera wealth, and the lowest in the Fokoue ponds regardless of the type of fertilizer used. When comparing the types of fertilizers with equal site, in Batie, the highest generic richness was recorded in ponds fertilized with wheat bran compared to ponds fertilized with pig manure. However, the generic wealth was comparable in the Fokoue ponds regardless of the type of fertilizer administered. Taking into account sites with a type of fertilizer with equal site, the highest generic richness was observed in Bamendou compared to Foumbot for cowpat. For pig manure, these values were higher in Batie than in Fokoue. Phytoplankton Families: The influence of the site and the type of fertilizer on the richness of the phytoplankton families presented Table 2 showed that, the highest values (16 families) are obtained in the ponds of Batie fertilized with the wheat bran with a percentage of 84.21% of the total wealth of the families, and the lowest values (11 families) in the ponds of Foumbot and Dschang. When comparing the type of fertilizer with the same site, in Batie, family richness values were higher in ponds receiving wheat bran compared to ponds fertilized with pig manure. Yet the richness of the families is comparable to Fokoue regardless of the type of fertilizer used. With the same type of fertilizer, the highest family richness values are observed in Bamendou compared to Fokoue for cowpat. These values are higher in Batie compared to Batie for pig manure. The Richness of Thephylums: With the exception of Foumbot ponds fertilized with cowpat where 4 phylums have been listed, all other types of ponds have totalized taxa.
| Classes of Phyto- planktons | Sites and the types of fertilizers | |||||||
|---|---|---|---|---|---|---|---|---|
| Bamendou | Batie | Dschang | Fokoue | Foumbot | Total | |||
| Cowpat (n) | Pig manure (n) | Wheat Bran (n) | Chicken manure (n) | Pig manure (n) | Not fertilized (n) | Cowpat (n) | ||
| Species | 39.09(86) | 42.73(94) | 39.09(86) | 15.00(33) | 11.82(26) | 11,82(26) | 22.73(50) | 100,00(220) |
| Genus | 76.33(29) | 78.95(30) | 81.58(31) | 50.00(19) | 36.84(14) | 36,84(14) | 63.16(24) | 100,00(38) |
| Famillies | 68.42(13) | 73.68(14) | 84.21(16) | 57.89(11) | 42.11(8) | 42,11(8) | 63.16(12) | 100,00(19) |
| Phylum | 100,00(5) | 100,00 (5) | 100,00 (5) | 100,00 (5) | 100,00 (5) | 100,00 (5) | 80,00(4) | 100,00(5) |
Table 2: Effect of the site and the type of fertiliser on the richness of phytoplankton species, genera, families and phylums.
Effect of the Site and the Type of Fertilizer on the Relative Abundance Frequency of Phytoplankton Phylums: The influence of the site and type of fertilizer on the relative abundance of phytoplankton phylums is illustrated in Figure 1. It showed that regardless the site and the type of fertilizer, the highest relative abundance value was recorded in Chlorophyta and the lowest in Chrysophyta.
When considering the site and the type of fertilizer, the highest values were observed in the Chlorophyta phylum of the unfertilized ponds of Fokoue, followed by the batie ponds fertilized with pig manure. Yet Cyanophyta showed the lowest relative abundance values in Bamendou ponds fertilized with cowpat.
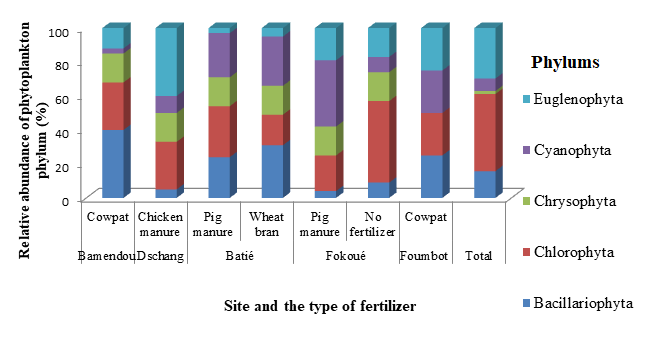
At the same site, in Batie, Chlorophyta were more abundant in ponds fertilized with pig manure while Bacillariophyta were more represented in terms of abundance in ponds receiving wheat bran as fertilizer. In Fokoue, Chlorophyta were more abundant in unfertilized ponds. When comparing sites with the same type of fertilizer, the phylum of Chlorophyta was more abundant in Batie while that of Cyanophyta was more represented in Fokoue for pig manure. Relative to cowpat Euglenophyta, Cyanophyta, Chlorophyta and Bacillariophyta were more abundant in Foumbot while only the phylum Bacillariophytes was more represented in Bamendou in terms of relative abundance.
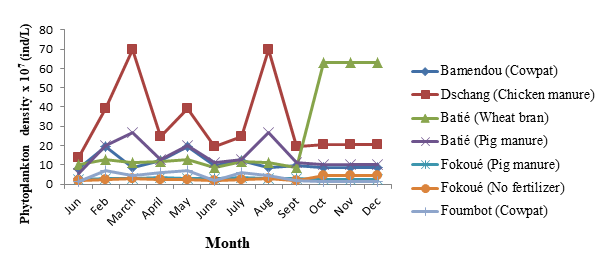
Phytoplankton Density Depending on the Site and the Type of Fertilizer: The evolution of the total density of phytoplankton as a function of the site and the type of fertilizer is illustrated in Figure 2. It generally appeared that with the exception of the months of September to December in the ponds of Batie fertilized with the wheat bran where the evolution was contrary, the density curves presented the same profile, pace and trend regardless of the site and the type of fertilizer. Outside of the last three months of the study where density values were higher in ponds fertilized from Batie, they were higher in Dschang overall. With the peaks of density observed in the months of March and August. From January to September the lowest density values of phytoplankton were observed in the unfertilized ponds of Fokoue. While the lowest values were recorded in the ponds of Foumbot fertilized with cowpat between the months of September to December.
The average values of phytoplankton densities depending on the site and the type of fertiliser are illustrated in Figure 3. It shows that the significantly (p<0.05)highest densities were observed in the ponds of Dschang fertilized with chicken manure and the lowest in Foumbot and Fokoue regardless of the type of fertilizer. When comparing sites with the same type of fertilizer, phytoplankton density was significantly higher (p<0.05) in Bamendou compared to Foumbot for cowpat. Compared to manure, these values were significantly higher in Batie compared to Fokoue. At the same site, in Batie as in Fokoue, the density values were comparable regardless of the type of fertilizer administered.
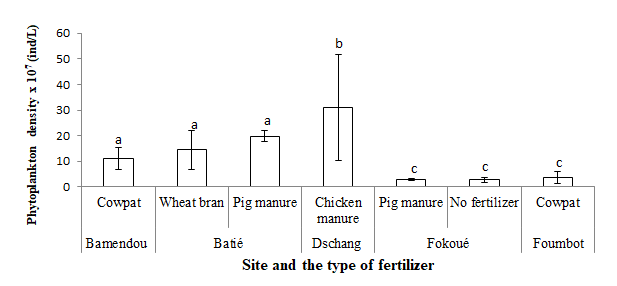
Figure 3: Phytoplankton density according to site and the type of fertilizer. (a-c): Histograms assigned to the same letter are not significantly different (p>0.05) 6.1.7. Correlation between the Physicochemical Characteristics of Water and Phytoplankton Density Depending on the Site and Type of Fertilizer: Correlations between the physicochemical characteristics of water and phytoplankton densities (Table 3) showed that, with the exception of the relationship between phytoplankton density and phosphates on the one hand and transparency on the other hand, which were insignificant(P < 0.01), negative and very strong for all other physicochemical characteristics of water in the unfertilized ponds of Fokoue.
Similarly, phytoplankton density is negatively and strongly correlated with dissolved oxygen in Dschang ponds fertilized with chicken manure. Conversely, the density of phytoplankton is significant (P < 0.01), positively and very strongly correlated with pH in ponds fertilized with cowpat whatever the site.
| Physicochemical characteristics of water | Densities of phytoplankton | ||||||
|---|---|---|---|---|---|---|---|
| Bamendou | Batie | Dschang | Fokoue | Foumbot | |||
| Cowpat | Pig manure | Wheat bran | Chocken manure | Pig manure | No fertilizer | Cowpat | |
| Nitrates (NO3-) | 0.032 | -0.111 | -0.167 | 0.128 | -0.22 | -0.850** | 0.291 |
| Nitrites (NO -) 2 | 0.222 | -0.009 | -0.101 | 0.292 | -0.22 | -0.677** | -0.469 |
| Dissolved oxygen (O2) | 0.16 | 0.177 | 0.139 | -0.992* | 0.452 | -0.999** | 0.312 |
| pH | +0.999** | 0.229 | -0.222 | 0.178 | 0.22 | -0.934** | +0.992** |
| Phosphates (PO 3-) 4 | -0.555 | -0.213 | -0.521 | -0.118 | -0.522 | 0.215 | -0.522 |
| Temperature | 0.26 | 0.144 | 0.12 | 0.077 | -0.22 | -0.765** | -0.18 |
| Transparency | -0.32 | 0.193 | -0.412 | 0.128 | -0.22 | 0.277 | 0.225 |
Table 3: Correlation between physicochemical characteristics of water and phytoplanktons densities.
Discussion
Within biological indicators, the characterization of phytoplankton communities appears as an instant integrator of the trophic level of a water body, due to the direct link between the physico-chemical characteristics of the water body and the structure of the communities. Thus, from our results it emerges that the specific richness of the phytoplankton has been affected by the pond type. Indeed the highest values are observed in the ponds of Batie fertilized with pig manure. A dissimilar observation was made by Nana TA, et al. [5] in unfertilized ponds compared to those fertilized at different doses of chicken manure and pig manure. This result is explained by very low levels of nutrient salts (NO3- and PO43-) in the waters of unfertilized ponds. Yet, it is known that the specific richness of phytoplankton increases with the decrease in the content of nutrient salts. Indeed, Silva EF, et al. [17] showed a decline in biological diversity in more nutrient-rich environments. Moreover, Moss B, et al. [18] suggests that only species capable of adapting to a high enrichment of the environment with nutrients and to an environment with so-called extreme conditions according to physic chemistry have an advantage in eutrophic condition; this results in an unequal distribution of taxa individuals. The population of taxa unable to adapt is decreasing and that of taxas that can adapt is growing. Faced with this dilemma, it is necessary to conduct a detailed study on the optimal content of nutrient salts from which we note a disturbance of the balance of biological species including phytoplankton. Generic richness and the highest phytoplankton families are recorded on the other hand in Batie ponds fertilized with wheat bran. This result is explained by relatively low proportions of nitrogen and phosphorus in this fertiliser. Data on the richness of phytoplankton families by type of fertilizer are poorly documented. It would therefore be desirable to conduct a trial on the determination of the optimal dose of nitrogen and phosphorus in fertilizers for better phytoplankton production.
Results on phytoplankton taxa abundance by site and the type of fertilizer showed that with the exception of the chrysophyta group which was absent in the Foumbot ponds fertilized with cowpat, all other groups were represented in all types of pond. Chlorophyta were more abundant in unfertilized ponds. Observations contradictory to this were reported by Nana TA, et al. [5] who found higher proportions of Cyanophyta and Bacillariophyta in unfertilized ponds. This is explained by the great variability of physicochemical parameters that prevailed in both types of pond because these three large groups of planktonic algae are characteristic African freshwaters. In addition, chlorophyta, which group about six hundred genera and more than eight thousand species, about four-fifths of which live in freshwater, are well represented in Sudanese waters [19].
Phytoplankton densities were affected by the type of pond. Thus, the highest values are recorded in ponds fertilized with chicken manure containing significantly higher nitrogen and phosphorus contents compared to other fertilizers, phosphorus being the main limiting element for algae growth [20]. This result confirms the claims of Taffouo DV, et al. [21] according to the some phytoplankton species abound in much more turbid waters and with high levels of nutrients. Indeed, turbidity participates in the photosynthesis of plants via the penetration of light. Radji R, et al. [22] also reported that physicochemical characteristics of water influence the density of phytoplankton stands. In this work, the density of phytoplankton varied according to the dissolved oxygen content of the waters. Indeed, the highest phytoplankton densities coincide with the highest dissolved oxygen levels of the waters. Similar results were observed by Hasnaoui M, et al. [23]. This could be explained by the essential role of dissolved oxygen in the degradation of fertilizers by bacteria. The decomposition of fertilizers hence releasing the nutrient salts that are the basis of phytoplankton development. Correlations between phytoplankton density and oxygen levels were significant, negative and strong in Dschang ponds fertilized with chicken manure. This would be related to the high predation of zooplankton organisms on phytoplankton in relation to the higher densities of zooplankton in ponds fertilized with chicken manure compared to other types of ponds. Zooplanktonic organisms contributing more than 60% in the transfer of primary production (phytoplankton) in the aquatic environment to fish fry [24, 25, 26].
Conclusion
The richness, density and abundance of phytoplankton species, genera, families and phylums have been affected by the site and the type of fertilizer. Thus, the highest specific phytoplankton richness was recorded in ponds fertilized with pig manure. Generic richness and the highest families are obtained in feed-fertilized ponds containing high nitrogen and phosphorus contents. With the exception of Chrysophyta who were absent in the ponds of Foumbot fertilized with cowpat, all other groups of phylum were listed in all types of ponds. While the highest phytoplankton densities were recorded in ponds fertilized with chicken manure.
References
-
UNICEF (2017) United Nations Children’s Fund, Data, Research and Policy Division. Generation 2030 Africa 2.0. Promoting investments in childhood to benefit from the demographic dividend. Resume exclusive, pp: 12.
-
FAO (2016) La situation mondiale de la pêche et de l’aquaculture: Orgnisation des Nations Unies pour I’alimentation et I’ agriculture, pp: 1-227.
-
Groga (2012) Structure, functioning and dynamics of phytoplankton in Lake Taabo (Ivory Coast). Doctorat unique. Universite de Toulouse, pp: 1-244.
-
Kilham SS, Kilham P (1984) The importance of resource supply rates in determining phytoplankton community structure, In Trophic interactions within aquatic ecosystems, pp: 7-27.
-
Nana TA, Songmo B, Efole ET, Kom MF, Tchoumboue (2020) Effet commparé de la dose de lisier de porc utilisé comme fertilisant en étang sur la richesse et la distribution des taxons phytoplanctoniques. Journal of AppliedBioscience 152: 15630-15639.
-
Agadjihouede H, Bonou AC, Chikou A (2010) Production des zooplanctons en bassin fertilisés avec la fiente de volaille et la bouse de vache. Calavi.01 BP 526 Cotonou. International Journal of Biological and Chemical Science 4(2): 432-442.
-
APHA (1998) Standard method for examination of water and wastewater. American Public Health Association, 20th (Edn.), Washington, DC, pp: 1150.
-
Pihan JC, Landragin G (1985) Model for predicting the acute toxicity of river waters to fish. International Association for Theoretical and Applied Limnology 22(4): 2457-2462.
-
Nguetsop VF, Fonkou T, Pinta JY (2009) Algae assemblages and relationships with some environmental parameters in two wetlands sites in western Cameroon. Revue des Sciences et l’Eau 22(1): 15-27.
-
Ward HB, Whipple GC (1918) Fresh water biology 2nd (Edn.), John Wiley and Sons inc, New-York, pp: 1111.
-
Bourrelly P (1981) Freshwater algae: introduction to systematics, pp: 517.
-
Bourrelly P (1985) Freshwater algae, T.111: Blue and red algae Society and New Edition of Boubée, Paris, pp:606.
-
Bourrelly P (1990) Freshwater algae, T. 1: Green algae. Society and New Edition of Boubée, Paris, pp: 572.
-
Cardinal C (1979) Planktonic algae from the Seine basin (with the exception of cyanophyceae and diatoms). Bulletin of Multinational History. Paris, 4(Sec B) (1-4): 285-327.
-
Utermohl H (1958) To perfect the quantitative phytoplankton methodology. International Association for Theoretical and Applied Limnology: Notices 9(1): 1-38.
-
Steel RG, Torrie JH (1980) Principles and procedures of statistics. 2nd (Edn.), MC Graw hill publishing compagny, New-York, pp: 1-481.
-
Silva EF, Almeida SFP, Nunes ML, Luis AT, Borg F, et al. (2009) Heavy metal pollution downstream the abandoned CovaldaMómine (Portugal) and associated effects on epilithic diatom communities. Sci Total Environ 407(21): 5620-5636.
-
Moss B (1998) Ecology of fresh mater: man end medium, past to future. Blackwell Science, Oxford, pp: 557.
-
Iltis A (1980) Aquatic flora and fauna of Sahelo-Sudanian Africa. _In_: Durand JR, et al. (Eds.), ORSTOM 1: 9-61.
-
Gamier J, Billen G, Coste M (1995a) Seasonal succession of diatoms and Chlorophyceae in the drainage network of the Seine River: observation and modeling. Limnology and Oceanography 40(4): 750-765.
-
Taffouo DV, Ikoli SRA, Oben ML, Tomedi EM (2017) Impacts of the physico-chemical characteristics of the waters on the distribution of phytoplankton and macrophytes of the Nkam River (Cameroon). International Journal of Biological and Chemical Sciences 11(4): 1766-1784.
-
Radji R, Bandji A, Liassou I, Edorh TA, Kouami K (2013) Diversity and dynamics of phytoplankton assemblages in aquatic ecosystems in southern Togo. Afrique Science 9(2): 67-77.
-
Hasnaoui M, Souissi S, Balvay G (2007) Distribution spatio-temporaire du phytoplancton dans un étang d’alevinage. Sud Sciences et technologie, pp: 1-12.
-
Shiel RJ (1995) A guide to identification of rotifers, cladocerans and copepods from Australian inland water. 3rd (Edn.), CRCFE-MDBC, Albury, Australie, pp: 1-150.
-
Haberman J (1998) Zooplancton of lakeVortsjarv. Limnologica 28: 49- 64.
-
David EB (2016) Bouleversement démographique, pp: 11.
- Genetic Improvement of Nile Tilapia (Oreochromis niloticus): Advances in Selective Breeding and Genomic Approaches for Sustainable Aquaculture
- Microplastics, Contaminants, and Waste Hotspots: Divergences and Faults in Prioritizing Control Efforts
- Creating a Healthier, More Vibrant Open and Closed Aquatic Environment. A Submersible, Centrifugal Magnetically Affixed Current Changing Aquarium Pump
- An Attempt to Assess Alpha Diversity and Sample Size: Using the Ostracod Assemblages off Kumamoto Port, Japan
- Assessment of the Efficiency of Common Fishing Gears and Crafts Used at Mohananda River of Chapai Nawabganj, Bangladesh
- Fish Productivity and Biodiversity Status of Sundarban Mangrove in Bangladesh