Sensitivity, Specificity of Vessel Involvement in Pancreatic Head Adenocarcinoma by Imaging Modality per Treatment Effect
Background: In patients with pancreatic adenocarcinoma, the accuracy of identifying vascular involvement via EUS and MDCT remains unclear, especially in the setting of neoadjuvant therapy. Methods: We conducted a retrospective analysis of patients who underwent a pancreaticoduodenectomy between 2012 and 2016 at Advent Health Orland Hospital. Sensitivity, specificity, positive predictive value and negative predictive value of MDCT and EUS with respect to vessel involvement (SMV, PV, SMA) in a given treatment setting (no treatment, neoadjuvant chemotherapy, neoadjuvant chemotherapy/radiation) were analyzed. Results: In the setting of no treatment, MDCT has the highest sensitivity, specificity, PPV, NPV in the evaluation of the SMA: 22%, 94%, 50%, and 83% respectively. In the setting of no treatment, EUS has the highest sensitivity, specificity, PPV, NPV in the evaluation of the SMV: 33%, 95%, 33% and 95% respectively. The modality with the highest specificity in the assessment of PV involvement is intra-operative evaluation regardless of treatment setting. In the setting of neoadjuvant therapy, either EUS or intra-operative evaluation is preferred over MDCT for the evaluation of the SMA, SMV and PV. Discussion: In the setting of no treatment, the SMA is best evaluated via MDCT, the SMV via EUS, and the PV is best evaluated intra-operatively.
Introduction
Pancreatic cancer is the fourth leading cause of cancer- related death in the United States and has among the poorest survival rates after diagnosis [1]. Even with successful resection, the five-year survival is only 15-25% [1].
Approximately 20% of patients have a resectable disease at the time of diagnosis and the remaining patients either have a metastatic or locally advanced disease at presentation [2, 3, 4]. Resectability in patients with newly diagnosed pancreatic ductal adenocarcinoma (PDAC) is determined by radiologic imaging demonstrating tumor proximity to or involvement of the mesenteric and portal vascular structures, in addition to exclusion of extra-pancreatic invasion of adjacent tissues and organs other than the duodenum [5, 6, 7, 8, 9, 10, 11, 12, 13, 14]. Vascular invasion is an important factor in determining margin status and resectability. The role of preoperative imaging is to select which patients are likely to have a margin free resection, and therefor likely to benefit from a pancreaticoduodenectomy [6, 8, 12]. Several classification schemes have been put forth by different organizations regarding vascular involvement and resectability of the peripancreatic vessels (celiac, hepatic, superior mesenteric artery, portal vein or superior mesenteric vein) including the National Compressive Cancer Network (NCCN), the Americas Hepato-Pancreato-Biliary Association (AHPBA) and the Society of Surgical Oncology (SSO) among others, which by and large, have overlapping criteria. Methods commonly used to assess the presence of vascular invasion by tumor include multi-detector computed tomography (MDCT), endoscopic ultrasonography (EUS), and magnetic resonance imaging (MRI) [7, 8]. Multi- detector computerized tomography has been regarded as the modality with the highest diagnostic accuracy for radiographic assessment of resectability. Zamboni et al demonstrated 100% sensitivity in the detection of resectability of pancreatic adenocarcinoma using MDCT, 94% specificity, 98% PPV, and 100% NPV [15]. A meta- analysis by Li et el demonstrated a diagnostic performance of CT with a sensitivity of 73% and a specificity of 95% in the evaluation of vascular invasion [6]. Furthermore, Lee et al demonstrated that MDCT has a sensitivity of 90%, specificity of 41%, PPV 85% and NPV 73% for overall tumor resectability [8]. Additionally, in their assessment of vascular involvement, a sensitivity and specificity of MDCT was calculated to be 61% and 96%, respectively [8]. MDCT of the pancreas is favorably complemented by EUS, which is more sensitive for the early detection of pancreatic lesions, and allows easy access to the pancreas for tissue diagnosis using fine needle aspiration (FNA), as well as assessing the relationship of the tumor to the critical vascular structures, with a reported sensitivity and specificity of 89% and 92% respectively for the major veins (SMV, PV, SPV), and 83% and 94% respectively for the major arteries (SMA, SPA) [7, 9, 11]. Current reports describe the sensitivity and specificity of these modalities on overall vascular involvement but do not specify the diagnostic accuracy of each modality on predicting involvement of the individual vascular structures that influence resectability. The purpose of our study was to describe the sensitivity, specificity, positive predictive value (PPV), negative predictive value (NPV), false positive rate (FPR), and false negative rate (FNR) of MDCT and EUS in predicting vascular involvement of the portal vein (PV), superior mesenteric artery (SMA) and superior mesenteric vein (SMV) in patients with PDAC in the setting of no prior neoadjuvant therapy and in the setting of prior neoadjuvant therapy.
Materials and Methods
Patients Data was collected retrospectively between August 2012 and September 2016. A total of 234 patient records were evaluated. We reviewed the surgical, pathologic, clinical and radiographic records of these patients from AdventHealth Orlando Hospital’s Cerner electronic medical record system.
Inclusion Criteria
- Age 18-89 years
- Diagnosis of pancreatic head adenocarcinoma without metastasis who underwent pancreaticoduodenectomy
- Radiographic evaluations by both CT and EUS only performed at AdventHealth Orlando Hospital Patients who underwent surgery had inspection of major peripancreatic vessel on gross evaluation of the specimen by the surgeon and on pathologic examination by a pathologist, i.e.
PV, SMV, and SMA. Patients were evaluated for tumor resectability via radiographic examination of peripancreatic vessels prior to surgical resection. Final determination of vessel involvement was rendered by pathologic examination.
Imaging Modalities
All CT scans were obtained with multidetector – row CT scanner (Phillips, Siemens, General Electric). Unenhanced scans were obtained using 5 mm collimation, followed by late arterial phase images (performed 20-30 seconds post injection of IV contrast), which was followed by the portal venous phase (performed 70 seconds post injection of IV contrast).
Vascular Invasion
Images were reviewed by board certified radiologists and the degree of vessel involvement was estimated ranging from 0 to 360 degrees of vessel circumference for each vessel.
CA 19-9
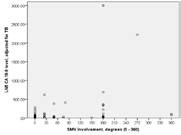
Serum CA 19-9 level was adjusted using serum total bilirubin (TB). If TB was < 2, CA 19-9 level was as measured; if TB was >/= 2, CA 19-9 level was divided by TB for analysis.
Statistical Analysis
Statistical analyses were performed using SPSS version 24 and a Vassar Stats clinical calculator provided by Vassar College. Demographic statistics were produced for age, gender, and race. Correlation analyses were performed using SPSS with application of the Bonferroni correction due to multiple testing when appropriate. An overall alpha equal to .05 was used. Sensitivity, specificity and respective 95% confidence intervals (95CIs) were produced using the Vassar College clinical calculator. In the instances when stratification of the study data by treatment, imaging modality, and vessel produced either small or zero value crosstab cell counts, the sensitivity and/or specificity result could not be calculated or was computationally unreliable.
Results
Of the 234 patient records evaluated, 85 (36%) patients met protocol criteria of diagnosis of PDAC who also underwent surgery. Of these 85 patients, 83 proceeded with pancreaticoduodenectomy and the remaining two were unrespectable as a result of vascular invasion (one patient had an unreconstructable SMV and another had involvement of the SMA). The mean age was 67 years. The male to female distribution was 49 (58%) to 36 (42%), respectively. The race distribution was as follows: 67 (79%) white, 6 (7%) black, 7(8%) Hispanic, 1(1%) Asian, and 4 (5%) other.
Sensitivity, specificity, positive predictive value (PPV), negative predictive value (NPV), false positive rate (FPR), and false negative rate (FNR) of each modality was calculated per vessel involved per treatment with the results noted in tables 1-5, whereby: ► Imaging Modality is CT, EUS, CT+EUS, intra-operative gross(IOG) evaluation by surgeon ► Treatment is
- without chemotherapy and without radiation
- with chemotherapy and without radiation
- with chemotherapy and with radiation ► Vessel involvement was quantified as degree of tumor involvement of vessel circumference. ► Vessels evaluated were:
- Superior Mesenteric Artery (SMA),
- Superior Mesenteric Vein (SMV),
- Portal Vein (PV)
Sensitivity
In reviewing Tables 1 & 2, we are unable to comment on the ideal modality evaluating PV involvement by tumor given an inadequate population size. In the no treatment arm however, the best test for the evaluation of SMA involvement is likely to be CT with a sensitivity of 22%. Multiple modalities seem to be similarly sensitive for SMV evaluation with sensitivity of 33%.
| Sensitivity | Specificity | ||||||||||
|---|---|---|---|---|---|---|---|---|---|---|---|
| 95CI_LL | 95CI_UL | 95CI_LL | 95CI_UL | ||||||||
| No Treatment | SMA | CT | 0.222 | 0.039 | 0.598 | 0.945 | 0.804 | 0.99 | CT | SMA | No Treatment |
| EUS | --- | --- | --- | --- | --- | --- | EUS | ||||
| IOG | 0.111 | 0.005 | 0.493 | 0.918 | 0.769 | 0.978 | IOG | ||||
| CT+EUS | 0.111 | 0.019 | 0.36 | 0.972 | 0.895 | 0.995 | CT+EUS | ||||
| SMV | CT | 0.333 | 0.017 | 0.874 | 0.659 | 0.499 | 0.79 | CT | SMV | ||
| EUS | 0.333 | 0.017 | 0.874 | 0.953 | 0.829 | 0.991 | EUS | ||||
| IOG | 0.333 | 0.017 | 0.874 | 0.84 | 0.693 | 0.928 | IOG | ||||
| CT+EUS | 0.333 | 0.059 | 0.758 | 0.804 | 0.702 | 0.878 | CT+EUS | ||||
| PV | CT | --- | --- | --- | 0.955 | 0.836 | 0.992 | CT | PV | ||
| EUS | --- | --- | --- | 0.954 | 0.832 | 0.992 | EUS | ||||
| IOG | --- | --- | --- | 0.955 | 0.836 | 0.992 | IOG | ||||
| CT+EUS | 0.5 | 0.026 | 0.973 | 0.955 | 0.882 | 0.985 | CT+EUS | ||||
| Chemotherapy Only | SMA | CT | --- | --- | --- | 0.92 | 0.724 | 0.986 | CT | SMA | Chemotherapy Only |
| EUS | --- | --- | --- | 0.96 | 0.776 | 0.997 | EUS | ||||
| IOG | --- | --- | --- | 0.88 | 0.676 | 0.968 | IOG | ||||
| CT+EUS | 0.5 | 0.026 | 0.973 | 0.94 | 0.824 | 0.984 | CT+EUS | ||||
| SMV | CT | --- | --- | --- | 0.304 | 0.14 | 0.53 | CT | SMV | ||
| EUS | --- | --- | --- | 0.782 | 0.557 | 0.917 | EUS | ||||
| IOG | 0.666 | 0.125 | 0.982 | 0.782 | 0.557 | 0.917 | IOG | ||||
| CT+EUS | --- | --- | --- | 0.543 | 0.391 | 0.688 | CT+EUS | ||||
| PV | CT | 0.25 | 0.013 | 0.78 | 0.5 | 0.288 | 0.711 | CT | PV | ||
| EUS | 0.5 | 0.091 | 0.908 | 0.545 | 0.326 | 0.749 | EUS | ||||
| IOG | --- | --- | --- | 0.818 | 0.589 | 0.94 | IOG | ||||
| CT+EUS | 0.375 | 0.102 | 0.741 | 0.522 | 0.368 | 0.672 | CT+EUS | ||||
| Chemotherapy + Radiation | SMA | CT | 0.75 | 0.219 | 0.986 | 0.428 | 0.118 | 0.797 | CT | SMA | Chemotherapy + Radiation |
| EUS | --- | --- | --- | 0.856 | 0.42 | 0.992 | EUS | ||||
| IOG | 0.5 | 0.091 | 0.908 | 0.571 | 0.202 | 0.881 | IOG | ||||
| CT+EUS | 0.375 | 0.102 | 0.741 | 0.642 | 0.356 | 0.86 | CT+EUS | ||||
| SMV | CT | --- | --- | --- | --- | --- | --- | CT | SMV | ||
| EUS | 0.5 | 0.091 | 0.908 | 0.571 | 0.202 | 0.881 | EUS | ||||
| IOG | 0.75 | 0.219 | 0.986 | 0.571 | 0.202 | 0.881 | IOG | ||||
| CT+EUS | 0.75 | 0.355 | 0.955 | 0.285 | 0.095 | 0.579 | CT+EUS | ||||
| PV | CT | --- | --- | --- | 0.545 | 0.245 | 0.818 | CT | PV | ||
| EUS | --- | --- | --- | 0.545 | 0.245 | 0.818 | EUS | ||||
| IOG | --- | --- | --- | 0.818 | 0.477 | 0.967 | IOG | ||||
| CT+EUS | --- | --- | --- | 0.545 | 0.326 | 0.749 | CT+EUS |
Table 1: Sensitivity and specificity of each imaging modality per vessel involved per treatment. [L Mesropyan].
| Sensitivity | Specificity | |||
|---|---|---|---|---|
| No Treatment | SMA | CT | CT+EUS | |
| No Treatment | SMV | All modalities are similar | EUS | |
| No Treatment | PV | UND | All modalities are similar | |
| No Treatment | Chemo Only | SMA | UND | EUS or CT+EUS |
| SMV | Chemo Only | UND | IOG or EUS | |
| PV | Chemo Only | UND | IOG | |
| Chemo + Rad | SMA | CT | EUS | |
| Chemo + Rad | SMV | IOG or CT+EUS | UND | |
| Chemo + Rad | PV | UND | IOG |
Table 2: Summery of sensitivity and specificity of each imaging modality per vessel involved per treatment.
where UND = unable to be determined due to either low or zero value crosstab cell counts following stratification of the sample data Table 2: Summery of sensitivity and specificity of each imaging modality per vessel involved per treatment.
Specificity
Portal vein evaluation is best accomplished in the operating room by the surgeon in order to determine resection with negative margins regardless of treatment arm with a specificity of 95% and 81% with and without neoadjuvant therapy respectively. Furthermore, CT in conjunction with EUS is likely the preferred modality for SMA evaluation. However, EUS is the preferred modality for SMV evaluation in the setting of no treatment. EUS also remains the modality of choice for both SMV and SMA evaluation in the setting of neoadjuvant therapy. The specificity of CT + EUS for SMA involvement by tumor is 97% in the absence of neoadjuvant therapy. The specificity of EUS for SMA involvement is 96% with neoadjuvant chemotherapy, and 85% with neoadjuvant chemotherapy + radiation. The specificity of EUS for SMV involvement by tumor is 95% in the absence of neoadjuvant therapy, 78% with neoadjuvant chemotherapy, and 57% with neoadjuvant chemotherapy +radiation.
PPV and NPV
In reviewing Tables 3 & 4, CT is the test of choice for evaluating SMA involvement by tumor with a PPV of 50% and NPV of 83% in the no treatment arm. SMV involvement is best evaluated by EUS in the absence of treatment (PPV 33% and NPV 95%) and in the setting of neoadjuvant chemotherapy (PPV 37%). The addition of radiation to chemotherapy altered the modality of preference to intra- operative evaluation with the highest PPV and NPV of 50% and 80% respectively. PV evaluation is limited given sample size, however, the data suggests that intra-operative evaluation has the highest PPV in the setting of no treatment and neoadjuvant chemotherapy, 33% and 50% respectively.
| PPV | NPV | ||||||||||
|---|---|---|---|---|---|---|---|---|---|---|---|
| No Treatment | 95CI_LL | 95CI_UL | 95CI_LL | 95CI_UL | |||||||
| SMA | CT | 0.500 | 0.091 | 0.908 | 0.833 | 0.680 | 0.924 | CT | SMA | No Treatment | |
| EUS | --- | --- | --- | 0.800 | 0.649 | 0.899 | EUS | ||||
| IOG | 0.250 | 0.013 | 0.780 | 0.809 | 0.653 | 0.908 | IOG | ||||
| CT+EUS | 0.500 | 0.091 | 0.908 | 0.816 | 0.715 | 0.888 | CT+EUS | ||||
| SMV | CT | 0.06 | 0.003 | 0.322 | 0.935 | 0.771 | 0.988 | CT | SMV | ||
| EUS | 0.33 | 0.017 | 0.874 | 0.953 | 0.829 | 0.991 | EUS | ||||
| IOG | 0.13 | 0.006 | 0.533 | 0.948 | 0.813 | 0.991 | IOG | ||||
| CT+EUS | 0.11 | 0.018 | 0.345 | 0.945 | 0.860 | 0.982 | CT+EUS | ||||
| PV | CT | --- | --- | --- | 0.977 | 0.864 | 0.998 | CT | PV | ||
| EUS | 0.33 | 0.017 | 0.874 | --- | --- | --- | EUS | ||||
| IOG | 0.33 | 0.017 | 0.874 | --- | --- | --- | IOG | ||||
| CT+EUS | 0.200 | 0.010 | 0.701 | 0.988 | 0.927 | 0.999 | CT+EUS | ||||
| Chemotherapy Only | SMA | CT | 0.33 | 0.013 | 0.874 | --- | --- | --- | CT | SMA | Chemotherapy Only |
| EUS | --- | --- | --- | 0.960 | 0.776 | 0.997 | EUS | ||||
| IOG | --- | --- | --- | 0.956 | 0.760 | 0.997 | IOG | ||||
| CT+EUS | 0.250 | 0.013 | 0.78 | 0.979 | 0.875 | 0.998 | CT+EUS | ||||
| SMV | CT | 0.16 | 0.041 | 0.404 | --- | --- | --- | CT | SMV | ||
| EUS | 0.38 | 0.102 | 0.741 | --- | --- | --- | EUS | ||||
| IOG | 0.29 | 0.051 | 0.697 | 0.947 | 0.718 | 0.997 | IOG | ||||
| CT+EUS | 0.22 | 0.093 | 0.427 | --- | --- | --- | CT+EUS | ||||
| PV | CT | 0.083 | 0.004 | 0.402 | 0.785 | 0.488 | 0.942 | CT | PV | ||
| EUS | 0.166 | 0.029 | 0.491 | 0.857 | 0.156 | 0.974 | EUS | ||||
| IOG | 0.500 | 0.174 | 0.825 | --- | --- | --- | IOG | ||||
| CT+EUS | 0.13 | 0.032 | 0.334 | 0.821 | 0.624 | 0.932 | CT+EUS | ||||
| Chemotherapy + Radiation | SMA | CT | 0.428 | 0.118 | 0.797 | 0.750 | 0.219 | 0.986 | CT | SMA | Chemotherapy + Radiation |
| EUS | --- | --- | --- | 0.600 | 0.273 | 0.863 | EUS | ||||
| IOG | 0.400 | 0.072 | 0.829 | 0.666 | 0.241 | 0.940 | IOG | ||||
| CT+EUS | 0.375 | 0.102 | 0.742 | 0.642 | 0.356 | 0.860 | CT+EUS | ||||
| SMV | CT | 0.36 | 0.123 | 0.683 | --- | --- | --- | CT | SMV | ||
| EUS | 0.400 | 0.072 | 0.829 | 0.666 | 0.241 | 0.940 | EUS | ||||
| IOG | 0.500 | 0.139 | 0.86 | 0.800 | 0.298 | 0.989 | IOG | ||||
| CT+EUS | 0.375 | 0.162 | 0.641 | 0.666 | 0.241 | 0.940 | CT+EUS | ||||
| PV | CT | --- | --- | --- | --- | --- | --- | CT | PV | ||
| EUS | --- | --- | --- | --- | --- | --- | EUS | ||||
| IOG | --- | --- | --- | --- | --- | --- | IOG | ||||
| CT+EUS | --- | --- | --- | --- | --- | --- | CT+EUS |
Table 3: Positive predictive value (PPV) and negative predictive value (NPV) of each imaging modality per vessel involved per tre
| PPV | NPV | ||
|---|---|---|---|
| No Treatment | SMA | CT | CT |
| No Treatment | SMV | EUS | EUS |
| No Treatment | PV | EUS or IOG | UND |
| Chemo Only | SMA | UND | EUS or CT+EUS |
| Chemo Only | SMV | EUS | UND |
| Chemo Only | PV | IOG | CT+EUS |
| Chemo + Rad | SMA | CT | CT |
| Chemo + Rad | SMV | IOG | IOG |
| Chemo + Rad | PV | UND | UND |
Table 4: ** Summery of positive predictive value (PPV) and negative predictive value (NPV) of each imaging modality per vessel in
where UND = unable to be determined due to either low or zero value crosstab cell counts following stratification of the sample data. Table 4: Summery of positive predictive value (PPV) and negative predictive value (NPV) of each imaging modality per vessel involved per treatment. [L Mesropyan].
FPR and FNR
In reviewing Table 5, CT provides the best modality in predicting SMA resectability with a FNR of 16% and 25% in the settings of no treatment and neoadjuvant chemotherapy with radiation, respectively. EUS has the lowest FNR in the setting of no treatment in predicting SMV resectability with a FNR of 4%.
Furthermore, in the settings of no treatment and chemotherapy, EUS has the lowest FPR in evaluating SMV with a FPR of 66% and 62% respectively; whereas intra- operative evaluation provides the lowest FPR in evaluating SMV involvement in the setting of chemotherapy with radiation.
| Pathology | |||||||||||||||||||
|---|---|---|---|---|---|---|---|---|---|---|---|---|---|---|---|---|---|---|---|
| No Treatment | Chemotherapy Only | Chemotherapy + Radiation | |||||||||||||||||
| SMA | False Negative | LL, 95CI | UL, 95CI | False Positive | LL, 95CI | UL, 95CI | False Negative | LL, 95CI | UL, 95CI | False Positive | LL, 95CI | UL, 95CI | False Negative | LL, 95CI | UL, 95CI | False Positive | LL, 95CI | UL, 95CI | |
| CT | 0.166 | 0.075 | 0.319 | 0.5 | 0.091 | 0.908 | UND | 0.666 | 0.125 | 0.982 | 0.25 | 0.013 | 0.78 | 0.571 | 0.202 | 0.881 | |||
| EUS | 0.2 | 0.1 | 0.35 | UND | 0.04 | 0.002 | 0.223 | UND | 0.4 | 0.136 | 0.726 | UND | |||||||
| IntraOP | 0.19 | 0.091 | 0.346 | 0.75 | 0.219 | 0.986 | 0.043 | 0.002 | 0.239 | UND | 0.333 | 0.059 | 0.758 | 0.6 | 0.17 | 0.927 | |||
| SMV | CT | 0.064 | 0.011 | 0.228 | 0.937 | 0.677 | 0.996 | UND | 0.842 | 0.595 | 0.958 | UND | 0.636 | 0.316 | 0.876 | ||||
| EUS | 0.046 | 0.008 | 0.17 | 0.666 | 0.125 | 0.982 | UND | 0.625 | 0.258 | 0.897 | 0.333 | 0.059 | 0.758 | 0.6 | 0.17 | 0.927 | |||
| IntraOP | 0.051 | 0.008 | 0.186 | 0.875 | 0.466 | 0.993 | 0.052 | 0.002 | 0.281 | 0.714 | 0.302 | 0.948 | 0.2 | 0.01 | 0.701 | 0.5 | 0.139 | 0.86 | |
| PV | CT | 0.022 | 0.001 | 0.135 | UND | 0.214 | 0.057 | 0.511 | 0.916 | 0.597 | 0.995 | UND | UND | ||||||
| EUS | UND | 0.666 | 0.125 | 0.982 | 0.142 | 0.025 | 0.438 | 0.833 | 0.508 | 0.97 | UND | UND | |||||||
| IntraOP | UND | 0.666 | 0.125 | 0.982 | UND | 0.5 | 0.174 | 0.825 | UND | UND |
Table 5: False negative (FN) and false positive (FP) rates stratified per vessel involved, imaging modality and treatment type. [
CA 19-9 Level and Vessel Resectability
CA 19-9 level was also used to evaluate vessel resectability. A statistically significant positive correlation was found between CA 19-9 level and tumor involvement of SMV, r = 0.331 (P = 0.005, at the 0.017 level, two-tailed). Higher levels of CA 19-9 were associated with greater tumor involvement of SMV (Figure 1 and Table 6). No statistically significant correlation was noted between CA 19-9 level and SMA or PV. A receiver operator characteristic (ROC) and area under the curve (AUC) analyses did not show a statistically significant CA 19-9 threshold value for predicting degree of vessel involvement by tumor. Additionally, a correlation of involvement was found between the following vessels: SMA and SMV, r = 0.501 (P < 0.0005, at the 0.017 level, two- tailed); SMA and PV, r = 0.399 (P < 0.0005, at the 0.017 level, two- tailed); SMV and PV, r = 0.389 (P < 0.0005, at the 0.017 level, two- tailed).
| CT_SMV_involmt_deg_num | |||||
|---|---|---|---|---|---|
| Frequency | Percent | Valid Percent | Cumulative Percent | ||
| Valid | 0 | 38 | 44.7 | 44.7 | 44.7 |
| 25 | 12 | 14.1 | 14.1 | 58.8 | |
| 50 | 7 | 8.2 | 8.2 | 67.1 | |
| 75 | 2 | 2.4 | 2.4 | 69.4 | |
| 80 | 1 | 1.2 | 1.2 | 70.6 | |
| 150 | 2 | 2.4 | 2.4 | 72.9 | |
| 180 | 20 | 23.5 | 23.5 | 96.5 | |
| 270 | 1 | 1.2 | 1.2 | 97.6 | |
| 360 | 2 | 2.4 | 2.4 | 100.0 | |
| Total | 85 | 100.0 | 100.0 |
Table 6: CT_SMV_involmt_deg_num.
Discussion
Accurate evaluation of vascular invasion in patients with pancreatic adenocarcinoma is very important in determining respectability of disease, which ultimately determines prognosis.
MDCT has been regarded as the modality with the highest diagnostic accuracy for radiographically assessing overall respectability with sensitivity as high as 100%, specificity of 94%, PPV of 98%, and NPV of 100% [15]. In the evaluation of vascular invasion, MDCT has a sensitivity of 73% and a specificity of 95% [6]. Furthermore, in the evaluation of vascular invasion, EUS has a sensitivity and specificity of 66% and 94% respectively [6]. EUS has a sensitivity and specificity of 89% and 92% respectively in the evaluation of major veins (SMA, PV, SPV), and 83% and 94% respectively in the evaluation of major arteries (SMA, SPA) [7].
Our study is unique in that it stratified the analysis by vessel type, imaging modality, and treatment setting. To our knowledge, there is no study to date that looks at sensitivity, specificity, PPV, NPV, FNR and FPR of CT and/or EUS with respect to vessel involvement (SMV, PV, SMA) in a given treatment setting (no treatment, neoadjuvant chemotherapy, neoadjuvant chemotherapy + radiation).
Our study suggests that in the setting of no treatment, CT has the highest sensitivity, specificity, PPV, NPV and the lowest FNR and FPR in the evaluation of SMA invasion by tumor: 22%, 94%, 50%, 83%, 16% and 50% respectively. Furthermore, in the setting of no treatment, EUS has the highest sensitivity, specificity, PPV, NPV and lowest FNR and FPR in the evaluation of SMV invasion by tumor: 33%, 95%, 33%, 95%, 4%, and 66% respectively. This data is in accordance with previous publications demonstrating higher sensitivity of CT for arterial evaluation and higher sensitivity of EUS for venous evaluation [6].
Our data shows that the modality with the highest specificity in the assessment of portal vein involvement is intra-operative evaluation regardless of treatment setting (95% for no treatment, 81% for chemotherapy only and 81% for chemotherapy + radiation). It is difficult to discern portal vein involvement radiographically given the close relationship of the portal vein with the normal pancreatic parenchyma without intervening fat along its right lateral and anterior margins. On anatomical grounds, it is therefore compelling to find that intra-operative evaluation is the ideal modality to ascertain portal vein invasion. One should therefore accept with caution the results of alternative modalities when it comes to the portal vein. Given an inadequate sample size, we cannot however comment on the ideal modality for evaluating PV involvement when it comes to sensitivity, PPV, NPV, FNR and FPR.
In the setting of neoadjuvant chemotherapy, or chemotherapy with radiation, our data suggests that either EUS or intra-operative evaluation is preferred over MDCT for the evaluation of SMA, SMV and PV involvement. This data is supported by previous studies demonstrating the limited role of CT in distinguishing between fibrosis and viable cancer post neoadjuvant therapy [5]. Diagnostic accuracy of CT for predicting resectability after neoadjuvant therapy has been documented in the range of 58% to 83% [13, 16]. It has been recognized that neoadjuvant therapy-induced tumor cell injury in pancreatic adenocarcinoma is mainly reflected by isovolumetric tissue replacement through fibrosis, rather than volume loss [10]. It is the lack of clear fat planes around critical vascular structures on post-neoadjuvant MDCT which can lead to an overestimation of unresectability.
The observed Pearson correlation between SMV and CA 19-9 may provide additional actionable information to the surgeon regarding resectability of disease where a higher level of CA 19-9 is moderately associated with greater degree of involvement of SMV by tumor. Furthermore, our study suggests a greater likelihood of SMV and PV involvement when SMA is involved by tumor. This information can be used by the surgeon in operative candidate selection by minimizing operative finding of unresectability [17].
In conclusion, our results imply that CT is the preferred modality for evaluation of SMA for tumor involvement, EUS is the preferred modality for evaluation of SMV, and the Portal Vein is best evaluated intra-operatively. Furthermore, EUS and intra-operative analysis are the preferred modalities over MDCT for re-evaluation of vessel involvement post- neoadjuvant therapy. We must use caution in applying our conclusions given the limited sample size. Our results do imply value in repeating the study with greater sample size.
References
-
Hosein P, Macintyre J, Kawamura C, Maldonado JC, Ernani V, et al. (2012) A retrospective study of neoadjuvant FOLFIRINOX in unresectable or borderline-resectable locally advanced pancreatic adenocarcinoma. BMC cancer 12: 199-205.
-
Alemi F, Alseidi A, Scott HW, Rocha FG (2015) Multidisciplinary management of locally advanced pancreatic ductal adenocarcinoma. Current problems in surgery 52(9): 362-398.
-
Lopez NE, Prendergast C, and Lowy AM (2014) Borderline resectable pancreatic cancer: definitions and management. World journal of gastroenterology 20(31): 10740-10751.
-
Al-Hawary MM, Francis IR, Chari ST, Fishman EK, Hough DM, et al. (2014) Pancreatic ductal adenocarcinoma radiology reporting template: consensus statement of the Society of Abdominal Radiology and the American Pancreatic Association. Radiology 270(1): 248-260.
-
Ferrone CR, Marchegiani G, Hong TS, Ryan DP, Deshpande EM, et al. (2015) Radiological and surgical implications of neoadjuvant treatment with FOLFIRINOX for locally advanced and borderline resectable pancreatic cancer. Annals of surgery 261(1): 12-17.
-
Li AE, Li BT, Ng BH, McCormack S, Vedelago J, et al. (2013) Diagnostic accuracy of imaging modalities in the evaluation of vascular invasion in pancreatic adenocarcinoma: a meta-analysis. World journal of oncology 4(2): 74-82.
-
Fujii, Y, Matsumoto K, Kato H, Saragai Y, Takada S, et al. (2019) Diagnostic Ability of Convex-Arrayed Endoscopic Ultrasonography for Major Vascular Invasion in Pancreatic Cancer. Clinical Endoscopy 52(5): 479-485.
-
Lee JK, Kim AY, Kim PNK, Lee MG, Ha HK (2008) Prediction of vascular involvement and resectability by multidetector-row CT versus MR imaging with MR angiography in patients who underwent surgery for resection of pancreatic ductal adenocarcinoma. European Journal of Radiology 73(2): 310-316.
-
DeWitt J, Devereaux B, Chriswell M, McGreevy K, Howard T, et al. (2004) Comparison of endoscopic ultrasonography and multidetector computer tomography for detecting and staging pancreatic cancer. Ann Intern Med. 141(10): 753-763.
-
Gassner EM, Poskaite P (2019) Imaging response evaluation after novel neoadjuvant treatments of pancreatic cancer. European Surgery 51: 146-152.
-
Nawaz H, Yi-Fan C, Kloke J, Khalid A, McGrath K, et al. (2013) Performance characteristics of endoscopic ultrasound in the staging of pancreatic cancer: a meta- analysis. Journal of the Pancreas 14(5): 484-497.
-
Zaky AM, Wolfgang CL, Weiss MJ, Javed AA, Fishman EK, et al. (2017) Tumor-V\vessel relationships in pancreatic ductal adenocarcinoma at multidetector CT: different classification systems and their influence on treatment planning. Radiographics 37(1): 93-112.
-
Kim YE, Park MS, Hong HS, Kang CM, Choi JY, et al. (2009) Effects of neoadjuvant combined chemotherapy and radiation therapy on the CT evaluation of resectability and staging in patients with pancreatic head cancer. Radiology 250(3): 758-765.
-
Lee ES, Lee JM (2014) Imaging diagnosis of pancreatic cancer: a state of the art review. World Journal of Gastroenterology 20(24): 7864-7877.
-
Zamboni GA, Kruskal JB, Vollmer CM, Baptista J, Callery MP, et al. (2007) pancreatic adenocarcinoma: value of multidetector CT angiography in preoperative evaluation. Radiology 245(3): 770-778.
-
Cassinotto C, Cortade J, Belleannee G, Lapuyade B, Terrebonne E, et al. (2013) An evaluation of the accuracy of CT when determining resectability of pancreatic head adenocarcinoma after neoadjuvant treatment. Eur J Radiol. 82(4): 589-593.
-
Clinical calculator 1. VassarStats.
- Management of Chronic Insertional Achilles Tendinopathy Using Flexor Hallucis Longus Tendon Transfer in Patients Over 50 Years of Age: A Four-Case Series Following the CARE Guidelines
- Application of Induced Pluripotent Stem Cells in Bone Tissue Engineering: Current Status and Prospects
- Surgical Management of Upper Thoracic Esophageal Squamous Cell Carcinoma with Concomitant Hypersplenism: Integration of Chai's Supra-Thoracic Apex Technique with Laparoscopic Splenectomy - A Technical Innovation Case Study with Systematic Review
- Evaluation of Masticatory Functional Efficiency of Stomatognathic System in Patients Undergoing Open Reduction Internal Fixation for Treatment of Pan-Facial Trauma: A Prospective Study
- Hepatic Abscess Secondary to Appendiceal Phlegmon an Unusual Complication of Appendiceal Phlegmon
- Report of Lumboperitoneal (LP) Shunt Procedure in Over Decades Experiences, Systematic Narrative Review