Trend of Changes in Annual Forest Cover of South West Bengal, India
With 21% of India's area under forests, and regular biennial satellite remote monitoring, there is an urgent need for rapid automated detection of forest loss locations. There have been numerous studies monitoring forest health but no single source of reporting data is completely adequate. Currently many state and private forestry agencies and government are implementing Geographic Information Systems (GIS) and Remote Sensing (RS) for monitoring the changing pattern of vegetation. The area of focus in this paper is south West Bengal covering 6 districts: Bankura, Burdwan, Birbhum, Midnapore (East and West) and Puruliya during 2001-2007. The study reveals that differential change in forest cover of the said districts ranged from unchanged to gradual increase. A substantial forest prevailing in this region vouches for sufficient shelter for the inhabiting animals too.
Introduction
The importance of forests cannot be underestimated. We depend on forests for our survival, from the air we breathe to the wood we use. Besides providing habitats for animals and livelihoods for humans, forests also offer watershed protection, prevent soil erosion and mitigate climate change. Forests cover a third of all land on earth, and nearly half of all known species live in forests, including 80 percent of biodiversity on land. They support 1.6 billion human livelihoods, yet humans hold responsibility for 32 million acres of deforestation every year [1]. Well managed forests have tremendous potential to contribute to sustainable development and to a greener economy. With 21% of India's area under forests, and regular biennial satellite remote monitoring, there is an urgent need for rapid automated detection of forest loss locations. This is essential if effective response to forest loss is to be put in place. Forest conversion was identified as a contributor to global climate change. Forest management is now part of global mitigation strategies [2].
Review of Literature
In 1923, the world first learnt about global forest resources; FAO began monitoring forest resource change in 1948. There have been numerous studies monitoring forest health but no single source of reporting data is completely adequate. The international literature is preoccupied with structural attributes associated with the trees in a stand, such as canopy layering, tree size variation, tree species richness, and the spatial arrangement of trees [3]. In 2009, FAO and the EC Joint Research Centre began analysis of Landsat data to assess forest land use change. Remote sensing was proven as a tool for monitoring forest resources leading to some 100 earth observing satellites [2]. SOFO, [4] addressed a crucial knowledge gap by systematically gathering and analyzing available data on the socioeconomic benefits of forests.
Forest cover monitoring was initially carried out in 1980s by NRSA and technology was transferred to Forest Survey of India (FSI) and 11 biennial assessments are carried out so far. As per the recent reports, there are some hot spots of deforestation occurring across the year over the entire country. Recently, spectral and spatial pattern of forest cover are being studied in long term IRS AWiFS data sets by NRSC, [5]. Analysis of deforestation and associated environmental hazards has been also kept in track by various activities of NRDM, [6].
Manoj, et al. [7] assessed the current status of forests in three northern districts of the state. Remote sensing techniques have been used to segregate different forest types and three density classes in the Darjeeling, Jalpaiguri and Cooch Behar districts of North Bengal, West Bengal, India using IRS-1A LISS II data relating to November 1991 [8]. Though some study on joint forest management of south West Bengal was undertaken by Pattnaik, et al. [9] but the coverage has not been compared before. Halder, [10] performed mapping study in Binpur block of Paschim Medinipur district recently.
Application of Geospatial Technology in Forestry
GIS and RS technology is important in forest cover mapping. Natural resource management involves forestry sector. Currently many state and private forestry agencies and government are implementing Geographic Information Systems (GIS) and Remote Sensing (RS) for various applications, mainly supporting analysis, assessment, and management of our forests. Nations state forestry organizations are also using geospatial data for their operations. Geographic data with spatial dimensions is useful for understanding ground conditions, as well as useful for strategic decisions. Spatial data is very important to foresters for conservation and prevention planning of the forest, its management and for global forests future conditions [11, 12].
Identification of deforestation using different RS data is being used. Also different temporal satellite image data can provides statistical analysis of forest cover and information about deforestation using GIS maps. GIS is significantly useful for representation of forests in the form of graphs, maps and other GIS statistical modeling functionalities. DEM (Digital Elevation modeling) data of forest cover useful for GIS analysis. And it is useful for various terrain attributes examination, movement of soil and nutrients influence from it, as well as the resulting outcome on wildlife productivity, forest, plant distribution [12].
The use of remote sensing data in recent times has been of immense help in monitoring the changing pattern of vegetation. Remote Sensing and GIS systems have the capability for repetitive coverage, which is very helpful in change detection studies [13].
Study Area
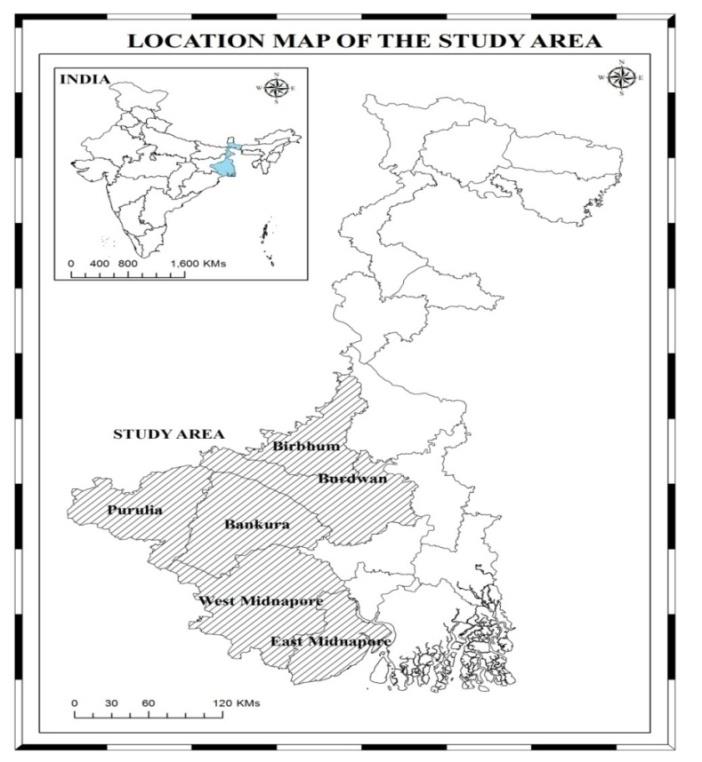
The area of focus in this paper is south West Bengal covering 6 districts: Bankura, Burdwan, Birbhum, Medinipur (East and West) and Puruliya (Figure 1). There are two natural divisions of East and West Medinipur: the eastern portion of the district having alluvial soil and the western part undulating. Much of this area is waterlogged especially the tract bounded by the Kasai river on the south and the Silai river on the north. The district Bankura consists of two distinct tracts; the western portion marks the rolling uplands and isolated hills, whereas, the deltaic tract of river Ganga is present in the east. Along with natural lakes or riverine wetlands many excavated tanks are also found. The district of Puruliya forms the connector between the hills of central India and the Chotanagpur plateau to the plain of Damodar in West Bengal. The topography of the district is gently undulating with occasional hillocks made up of hard rock. Geographically the forest area under this Division is lying between latitude: 22°42′35” N - 23°43’18” N; longitude: 85°48’47” E - 86°54’13” E. and covers an area of forest land in an around 62 thousands hectares. The lower Damodar valley in Barddhaman being a prematurely reclaimed deltaic tract, there are numerous debased pockets with rivers Bhagirathi and Ajay. In major part of the Birbhum district the surface is covered by a succession of undulations, the general trend of which is from north-west to south-east. In the northern most part of Birbhum there are several swamps.
Materials and Methods
Data was obtained from State Forest Report, [14] District official websites (http://www.purulia.nic.in) and interrogation from Divisional Forest Officers of respective districts. Topographical sheets for the years 2001-2007 were collected from Survey of India (SOI). Remote sensing provides clues to what is happening with the world’s forests, which is complemented by ground- based data [2]. While computing the forest cover of the state, the protocol developed by RRSC and NRSA in earlier studies was followed. The principle that forests are darkest vegetated pixels in the peak green season is used for forest identification. The forest peak detection is followed in Red Band Histogram on a 5 km local moving window basis [5]. The map was processed using Google Earth, ERDAS Imagine (2013) and ArcGIS Map (10.2) software’s and finally exported as jpeg files for presentation.
Results and Discussion
Global forest area is decreasing at a steady rate, but gains are occurring in some regions or forest types. Forest conversion continues in the tropics, primarily due to demand for agriculture [2]. The vegetation cover of the state is around 27% of the geographical area. Total recorded forest land in the state West Bengal is 11,879 sq km of which 7,054 sq km is Reserved Forest, 3,772 sq km is Protected Forest and 1,053 sq km is Unclassed State Forest, thus constituting 13.38% of the geographical area of the state.
The forest cover including the forests created outside the recorded forest area is 15.52% of the geographical area as assessed by the GIS on the basis of Satellite Imagery procured from NRSA [14]. As per classification, the forest under Purulia Forest Division falls under Northern tropical Dry Deciduous Forest (5B/C 1c) (http://www.purulia.nic.in).
Undivided Medinipur district has the largest geographical area of 14,081 sq km among the selected study sites (Table 1), followed by Bankura (6,882 sq km) and the smallest area belonging to Birbhum (4,545 sq km). Recorded forest areas, also follow this trend as particularly West Midnapore has 170 sq km of forest area, Bankura has around 148 sq km and Birbhum has the least area under forest, being 159 sq Km (Table 2). Figure 1 demonstrates the pattern of forest cover changes for the selected years, indicating that Burdwan and Birbhum have increased forest cover in the recent year (Figures 2 & 3) whereas Purulia has underwent a small deforestation phenomenon currently. The remaining districts show more or less constant forest coverage.
| Geographical Area | |||||||||||
|---|---|---|---|---|---|---|---|---|---|---|---|
| Districts | Recorded Forest Area (sq. km.) | % of Recorded Forest Area | |||||||||
| (sq. km.) | |||||||||||
| Darjeeling | 3,149 | 1,204 | 38.23% | ||||||||
| Jalpaiguri | 6,227 | 1,790 | 28.75% | ||||||||
| Cooch Behar | 3,387 | 57 | 1.68% | ||||||||
| Bankura | 6,882 | 1,482 | 21.53% | ||||||||
| Medinipur (E & W) | 14,081 | 1,709 | 12.14% | ||||||||
| Burdwan | 7,024 | 277 | 3.94% | ||||||||
| Purulia | 6,259 | 876 | 14.00% |
Table 1: District-wise Area under Forests by Legal Status in West Bengal (2007).
| Birbhum | 4,545 | 159 | 3.50% |
|---|---|---|---|
| Hooghly | 3,149 | 3 | 0.10% |
| Nadia | 3,927 | 12 | 0.30% |
| Mushidabad | 5,324 | 8 | 0.15% |
| Malda | 3,733 | 20 | 0.54% |
| Uttar Dinajpur | 3,140 | 10 | 0.32% |
| Dakshin Dinajpur | 2,219 | 8 | 0.36% |
| Kolkata | 104 | - | 0.00% |
| Howrah | 1,467 | - | 0.00% |
| 24-Parganas (S) | 10,159 | 4,221 | 41.54% |
| 24-Parganas (N) | 3,997 | 43 | 1.08% |
| Total | 88,752 | 11,879 | 13.38% |
Table 2: District-wise Area under Forests by Legal Status in West Bengal (2007).
| District | 2001 | 2003 | 2004 | 2005 | 2006 | 2007 | |||||||||||||
|---|---|---|---|---|---|---|---|---|---|---|---|---|---|---|---|---|---|---|---|
| Burdwan | 28.78 | 22.51 | 22.24 | 22.26 | 22.27 | 70.24 | |||||||||||||
| Birbhum | 16.03 | 16.03 | 15.85 | 15.85 | 15.85 | 45.45 | |||||||||||||
| Bankura | 148.35 | 148.35 | 147.29 | 147.69 | 148.93 | 148.2 | |||||||||||||
| Midnapore East | 1.22 | 1.22 | 0.9 | 0.9 | 0.9 | 0.9 | |||||||||||||
| Midnapore West | 169.61 | 169.61 | 180.72 | 169.69 | 171.93 | 170 | |||||||||||||
| Purulia | 87.6 | 87.6 | 87.17 | 75.05 | 75.05 | 62.59 |
Table 3: District-wise Area (in thousand hectares) of Forests in South West Bengal (2001-2007).
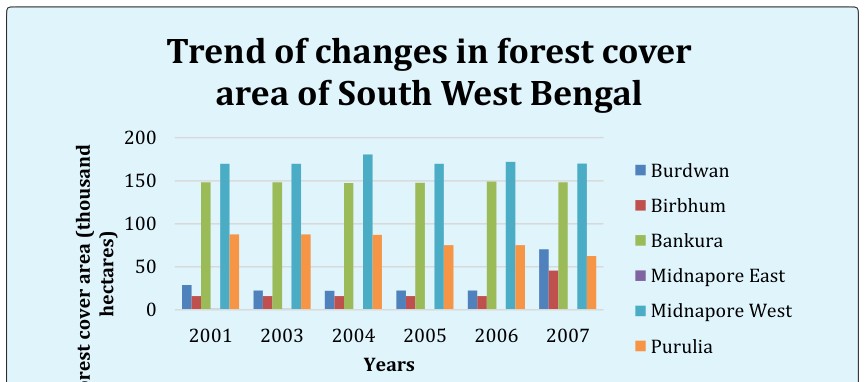
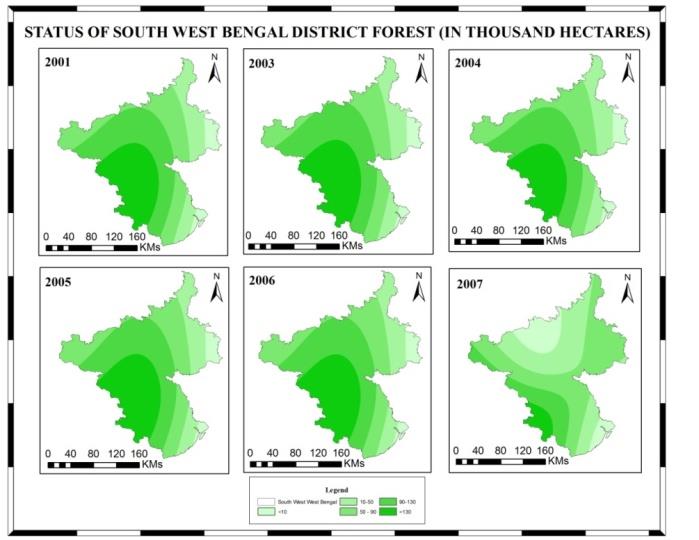
Figure 3(a,b): Year-wise Status of forest cover of south West Bengal districts.
Alluvial soil is present in parts of Burdwan, Midnapore and, Bankura districts but the forest resources are mainly confined to lateritic and red soils. An inventory of the forest resources in these districts has been carried out in specific intervals such as during 1981-82 , 1991-92 and so on, with the objective of evaluating the present status of forest resources in these districts and estimating the distribution, composition, density, growing stock and growth of the forest crop [14].
The recorded forest area of these districts totals to 4503 sq.km, which is about 11.60% of the geographic area. The total forest cover in these districts has been estimated to be in the region of 2400 sq.km. This lower estimate may have resulted partly from the scattered nature of these forests and the composition of the crop comprising, in the main, coppice forests and young plantations, much of which are not detectable during interpretation of satellite imageries due to limitations of resolution of sensors [14].
The results of study by Sudhakar, et al. [8] demonstrated the capability of satellite remote sensing to delineate pure sal, bamboo/mixed, riverine, coniferous and alpine forest types along with plantations through normal/stratified classification approaches. The forest cover of North Bengal was 26.2% and the accuracy estimation by different methods demonstrated an overall accuracy of more than 85% in segregating forest classes. National Forest Policy of India states 33% of its total geographical area should be under forest cover, which under current scenario stands well short at 23.38% [7].
Conclusion
The analysis of data of 2001-2007 on forest cover of south West Bengal reveal that cover of Medinipur (E & W) has been unchanged in the period of study but that of Burdwan and Birbhum has increased over the recent years, whereas that of Purulia is seen to decrease slightly. The study reveals that such differential change might be due to natural and anthropogenic activities (i.e. hill erosion, Illegal forest cutting, changed pattern of cultivation, forest fire, etc). A substantial forest prevailing in this region vouches for sufficient shelter for the inhabiting animals too.
It may be concluded that short term study in such area is not sufficient to analyze detailed features of degradation pattern. Also, study of multiple influencing factors is needed for proper monitoring, management and conservation of forests, in this belt of the state.
Acknowledgements
First of all, I am thankful to the Vice-Chancellor of Vidyasagar University- Prof. Ranjan Chakrabarti, who not only provided infrastructural facilities for the study but also encouraged me to get trained on geospatial technology from the support of organizations - NRDMS, DST and Government of India. I also wish to thank Prof. S. K. De, Prof. B. C. Patra and Dr. R.K. Maiti of Vidyasagar University for their support and valuable suggestions. I would like to express my sincere thanks to research scholars– Mr. Srikanta Parua and Mr. Manojit Bhattacharya who contributed in shaping of the paper. I
thank all the people for their help directly and indirectly to complete this work.
References
-
WWF Global (2017) We need to safeguard our forests.
-
FAO (2007) Global forest resources assessment 2010- terms and definitions. FAO Forest Resources Assessment Working Paper, Rome, Italy.
-
McElhinny C, Gibbons P, Brack C, Bauhus J (2005) Forest and woodland stand structural complexity: its definition and measurement. Forest Ecology and Management 218(1): 1-24.
-
State of the World’s Forests report (2014) Enhancing the Socioeconomic Benefits from Forests, FAO.
-
National Remote Sensing Centre (2018) Indian Forest Cover Change Alert System using IRS Multi Sensor Data.
-
Natural Resource Data Management Centre (NRDMS) (2016) Department of Planning, Statistics and Monitoring, Government of West Bengal.
-
Manoj K, Bhattacharyya R, Padhy PK (2013) Forest and Wildlife Scenarios of Northern West Bengal, India: A Review. International Research Journal of Biological Sciences 2(7): 70-79.
-
Sudhakar S, Sengupta S, Venkata RI, Raha AK, Bardhan RBK (1996) Forest cover mapping of West Bengal with special reference to North Bengal using IRS-1B satellite LISS II data. International Journal of Remote Sensing 17(1): 190-196.
-
Pattnaik BK, Dutta S (1997) JFM in South-West Bengal: A Study in Participatory Development. Economic and Political Weekly 32(50): 3225-3232.
-
Halder JC (2013) Land Use/Land Cover and Change Detection Mapping in Binpur II Block, Paschim Medinipur District, West Bengal: A Remote Sensing and GIS Perspective. IOSR Journal of Humanities and Social Science 8(5): 20-31.
-
Nath B, Acharjee S (2013) Forest Cover Change Detection using Normalized Difference Vegetation Index (NDVI): A Study of Reingkhyongkine Lake’s Adjoining Areas, Rangamati, Bangladesh. Journal of the Indian National Cartographic Association 33: 348- 353.
-
Pore M (2013) GIS & RS Applications in Forestry.
-
Saxena AS, Agrawal R (2008) Change Detection of Land Use and Land Cover Patterns: A Case Study of Mandideep and Obedullaganj in Madhya Pradesh. ITPI Journal 5(4): 65-72.
-
State Forest Report (1996) Forest Survey of India.
- Mitochondrial Bio-Logistics: Steering Co-Enzyme Q10 and Lycopene Synergies within the Science 4.0 Bio-OS Framework
- Hymenoptera Specimens from the Caño Negro Wetland, of the National Museum Collection, Costa Rica
- Science 4.0: Comprehensive Architecture of the Biological Operating System (Bio-OS) A Framework for Systemic Resilience and Industrialized Bio-Governance
- Rabbit on, or Hare Back? Understanding Climate Change
- Clinical Validation of Science 4.0: Flow Steering and Epigenetic Drift Inversion on a 76-Year-Old Hybrid System
- Seeds Planted by another Mind