Quantitative Analysis of Eugenol in Different Parts of Clove
Eugenol is the key active constituent of clove. The aim of this study was to analyse the concentration of Eugenol in different parts of dried Clove (tail, mid body and flower) by IR Spectroscopy and graphical comparison of the concentration. In this experiment the different part of dried clove was used to perform the quantitative analysis. Two methods were followed for the IR Spectroscopy, Attenuated Total Reflectance (ATR) sampling method and KBr Pellet method. KBr Pellets were prepared at 1:99 (Clove part: KBr) and IR spectrum drawn between IR reason (650 to 4000). Total 5 samples were analysed [Sample 01- Clove flower, Sample 02- just below of flower, Sample 03- mid body, Sample 4 -mid Body 2nd and Sample 05 -tail part]. Two wavelengths were target 1513 cm-1 and 1431 cm-1. The quantitative analysis was performed for % transmittance and % absorbance. Plotted Spectra was compared with the Spectral Database for Organic Compounds (SDBS) and spectra-base at Wiley. Sample 03 mid body shows higher area comparatively remaining four samples at both peaks (1513 cm-1 as well as 1431 cm-1). Results shows that the concentration of Eugenol is higher at Ovules than tail and flower.
Introduction
Clove (Syzygium aromaticum) is a precious spice, a member of the Myrtaceae family that has been employed for centuries (around 2000 years) as a food preservative and medicine due to its antimicrobial and antioxidant properties and native to Indonesia [1, 2, 3]. Eugenia caryophyllata Thunb is a tree and Clove is obtained from the dried flower bud of this tree [4]. There have been many investigations and reports by many researchers that a good quality or bad clove contains eugenol (80-85%), volatile oil 12-15% and some other constituents such as acetyl eugenol, gallotenic, methyl furfural, gum, resin and some other components [5, 6, 7, 8, 9, 10]. The exact identity of clove’s active compounds has not yet been established, but the medicinal effect is believed to be mainly due to eugenol [11]. Eugenol - C10H12O2; (Figure 1) a volatile phenolic constituent [12], 2- methoxy-4-(2-propenyl) phenol), is an allyl chain substituted guaiacol; it is slightly soluble in water and soluble in organic solvents [13]. Sample preparation is an important first step in herbicide analysis, as it is necessary to extract desired chemical constituents from herbal material for further separation and characterization example lack of consistency, safety, and efficacy. Same as sample preparation, the operation of Spectrophotometry is very crucial too. IR Spectrophotometry has been applied to determine eugenol in different parts of the clove which is much accurate comparatively TLC method.
![Figure 1: Chemical structure of eugenol (C10H12O2) [14].](/fulltextimages/9164/fig_1.png)
Materials and Methods
Plant Materials: Dried Cloves were purchased from a local supermarket (Reliance Super, Gaurav Path, RIICO Industrial Area, Bhiwadi, Rajasthan 301019. However, the samples originated from Indonesia. Samples were maintained in the dark and cool place at 25°C.
Chemical Reagent
Potassium Bromide for IR Spectroscopy was procured from Merck.
Sample Preparation
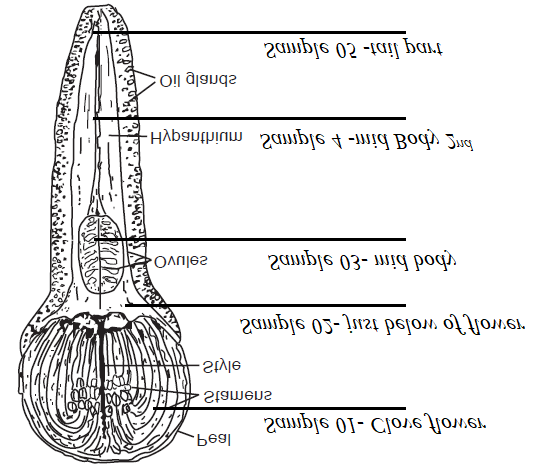
A single Clove bud was divided into five parts and named as Sample 01- Clove flower, Sample 02- just below of flower, Sample 03 -mid body, Sample 4 -mid body 2nd and Sample 05 -tail part (Figure 2) (representing clove and sample area). Individual part was grinded using stone pestle and mortar and then sifted through USA standard test sieve No.# 20 Mesh (ASTM specification, with an 850 mm pore-size) to maximize surface area.
Two methods were followed for IR Spectroscopy - Attenuated Total Reflectance (ATR) sampling method and KBr Pellet method.
- KBr Pellet Method - Ground clove sample (200 mg) and KBr (1.8 gm) were taken into the stone mortal and pastel and mixed well. Approx. 1 gm of this sample was taken in the KBr Pellet die and a pressure of 10 ton was applied. The prepared pellet was carefully removed from the die and placed in the KBr pellets cage of the IR spectrometer. Determination was performed for five separate pellets of each section of the sample, and each sample was analysed within the same parameters.
- Attenuated Total Reflectance is a method based on internal reflection, and the length of the sample path depends on the depth of penetration of infrared energy into the sample [15, 16, 17]. A 50-100 mg and ~10 µm thick solid sample was placed on the ATR unit and the infrared spectrum was recorded.
Chromatographic Conditions
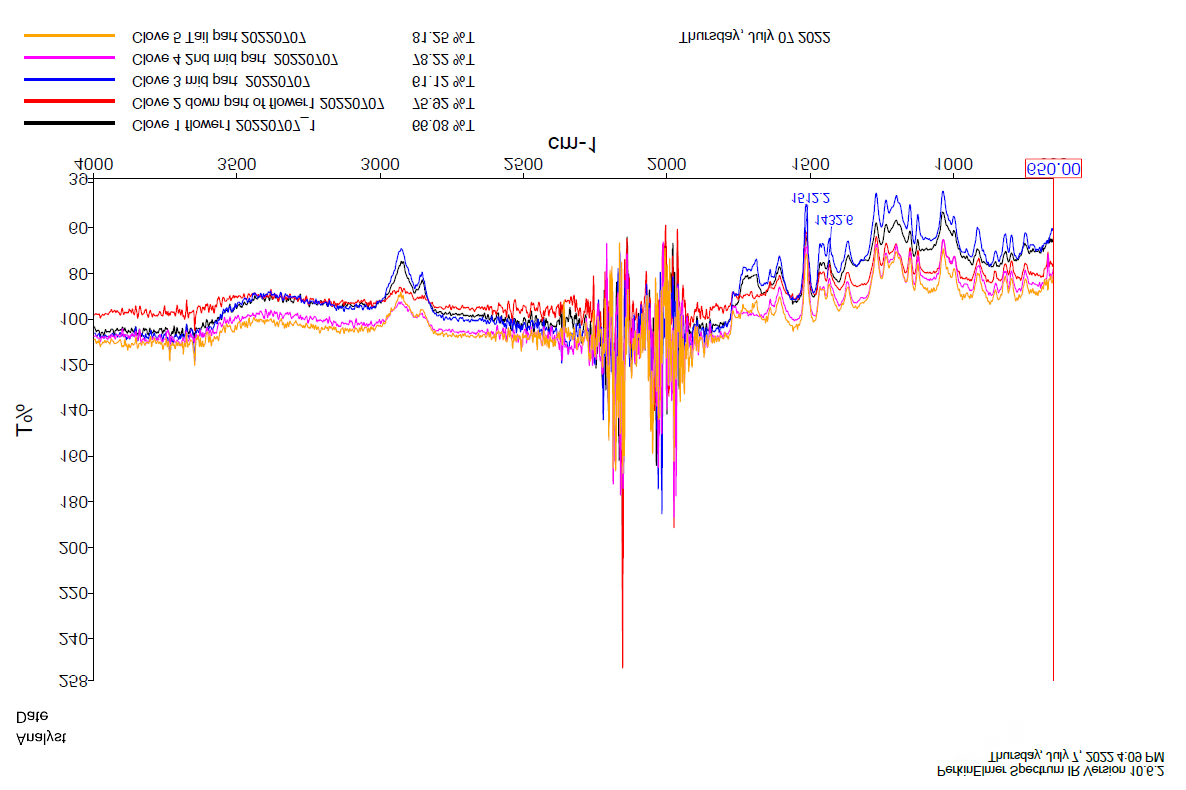
IR Spectroscopy was performed using an FTIR Spectrometer, Model Spectrum one, Sr No 69566 (Manufactured by Perkin Elmer Precisely) at 450-4000 cm-1 for IR and 650 - 4000cm-1 for AT. Eugenol was eluted within a min and quantification was carried out using a calibration curve and peak area measurements.
System Suitability
The system suitability parameters with respect to KBr Pellets, Samples, wavelength between eugenol peak and other constituent peaks were defined and compared with the reference peak.
Results and Discussion
Syzygium Aromaticum is a well-known medicinal herb having various proven therapeutic properties as per the published scientific reports. It is a most commonly used spice and food preservative traditional ayurvedic. Eugenol is the main principal constituent of clove responsible for the restorative property of clove. Thereby, reported biological activities suggest that clove is beneficial for human and animals use.
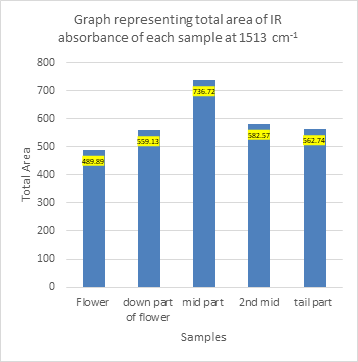
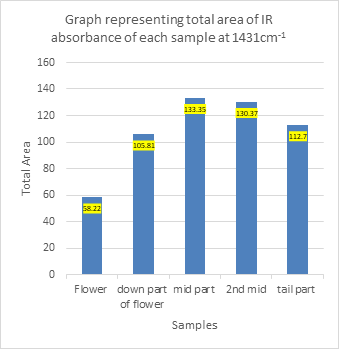
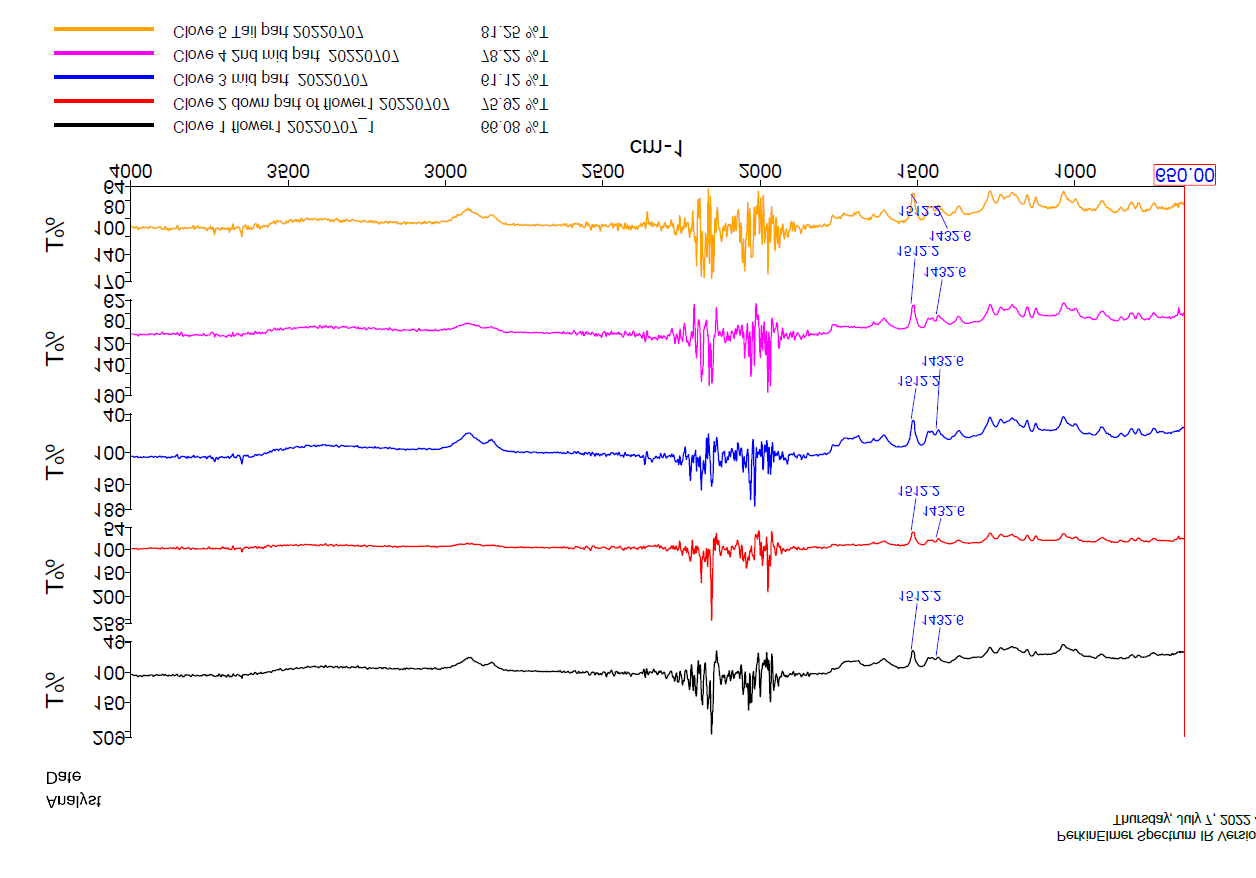
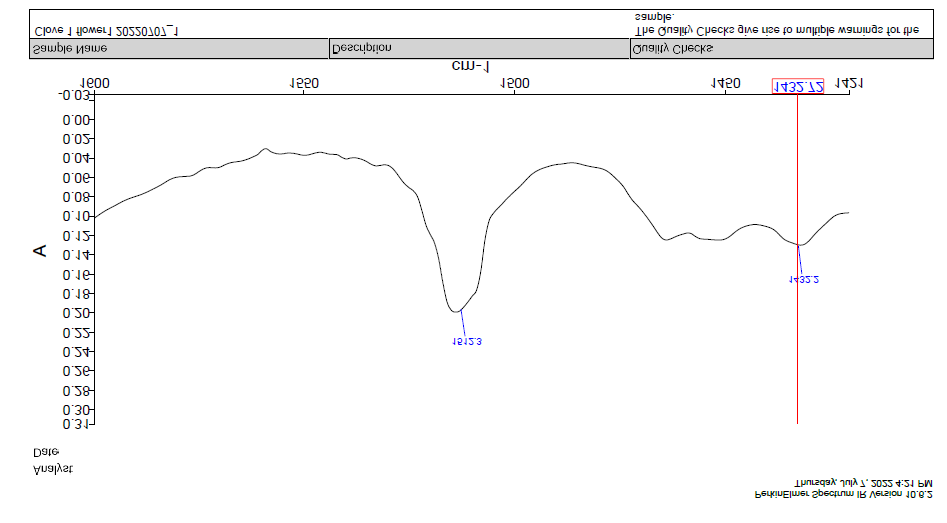
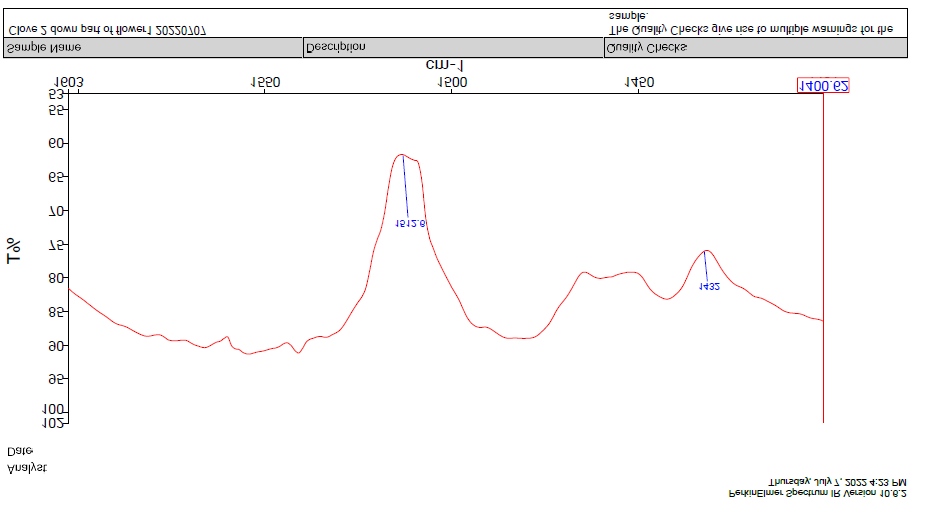
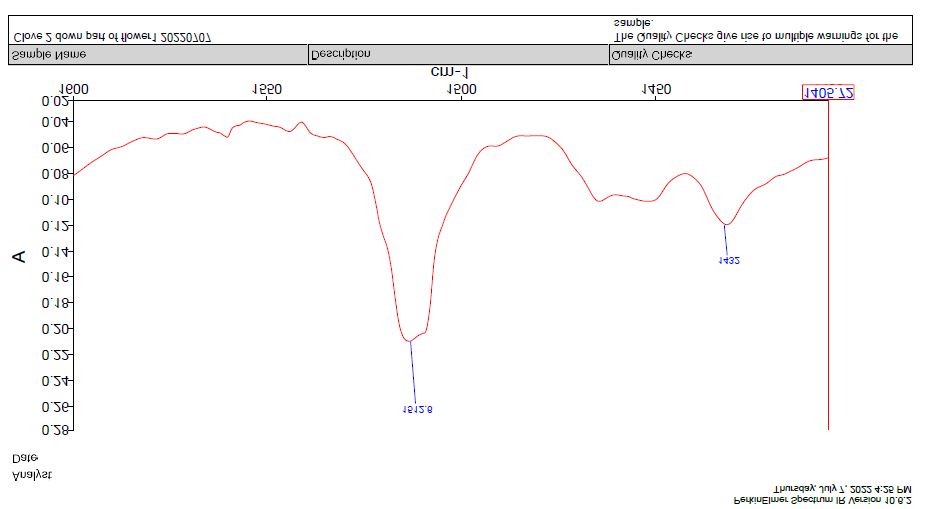
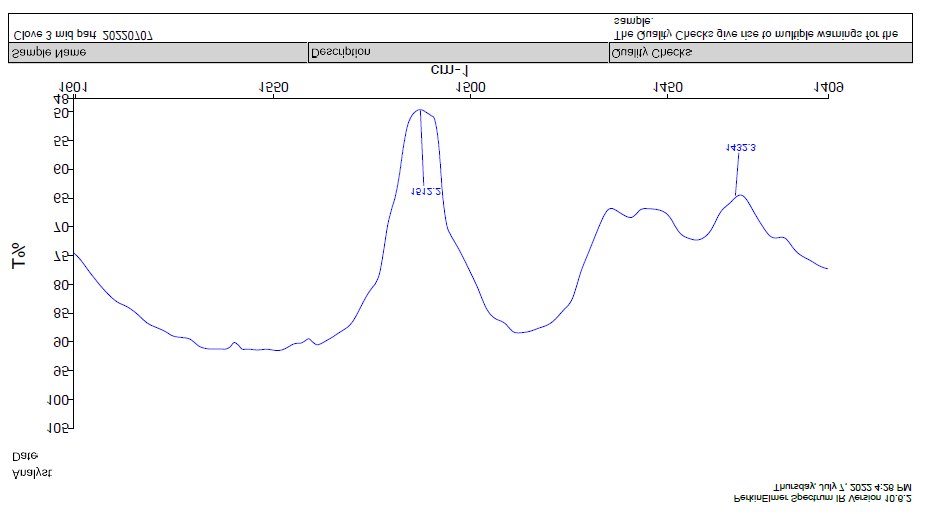
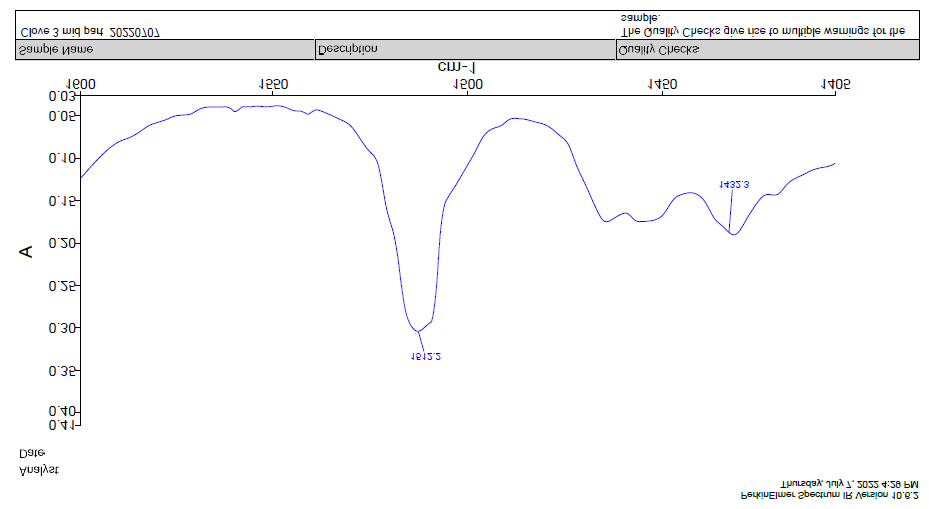
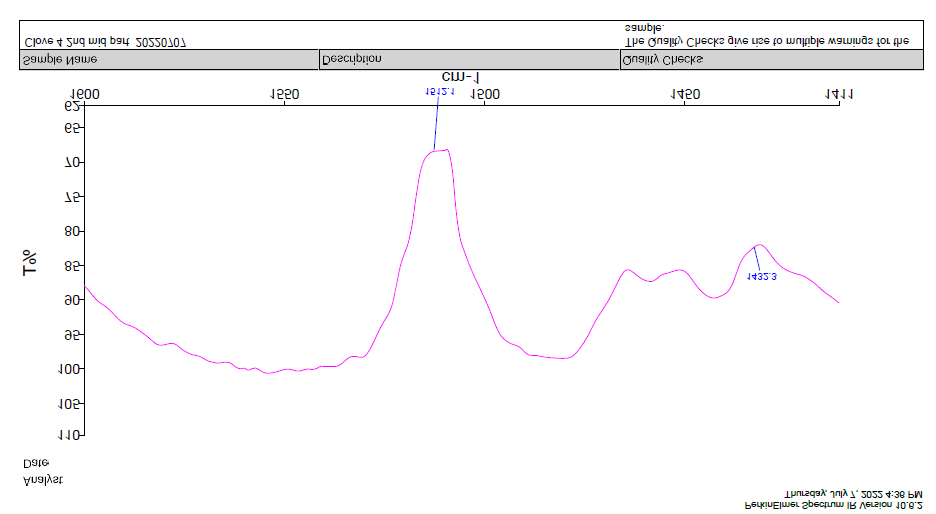
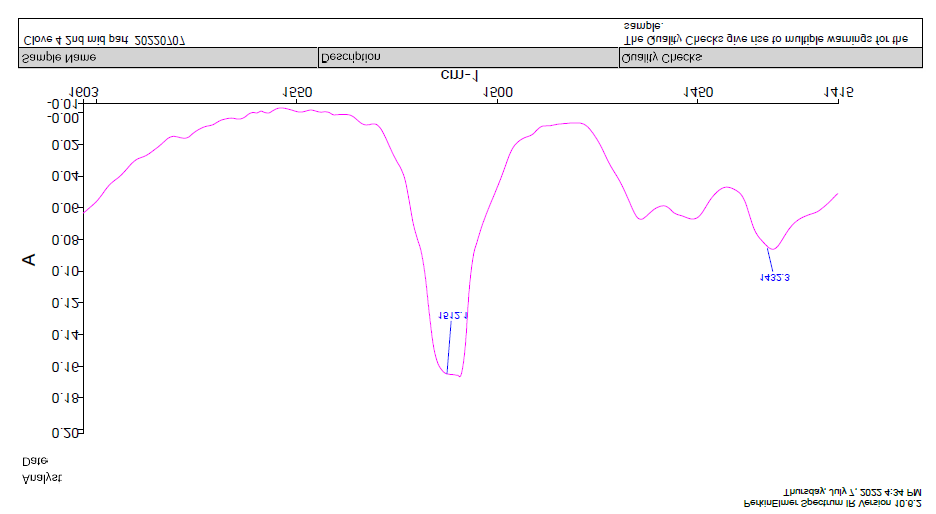
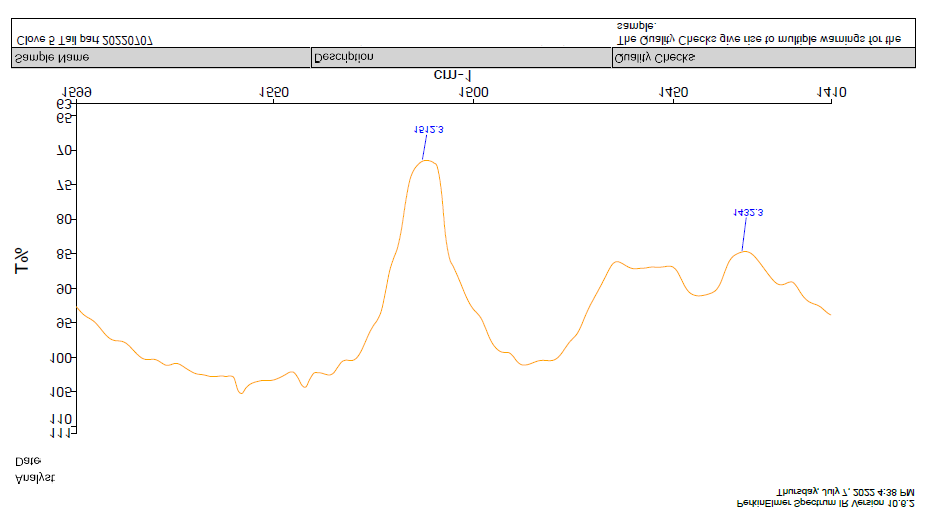
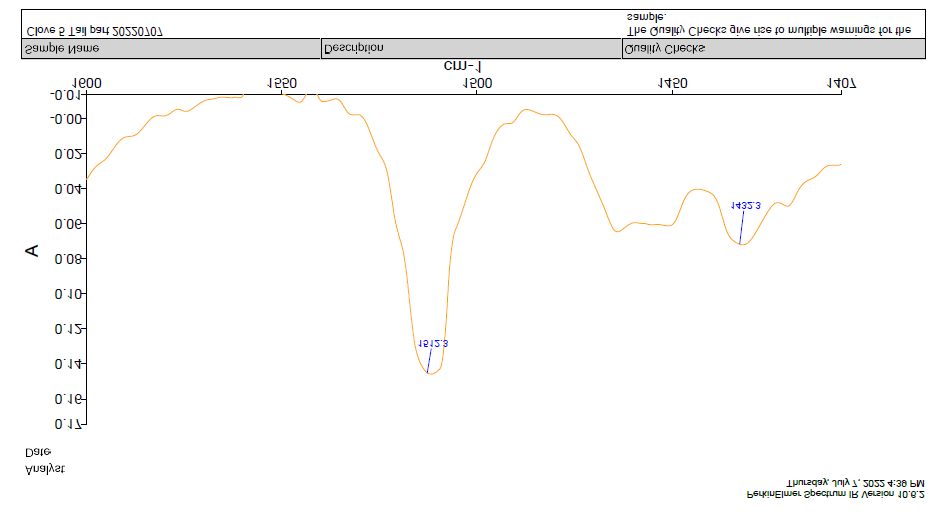
In order to obtain the IR Spectra with better resolution of adjacent peaks within a short time, the Sample, KBr Pellets and detecting wavelength were investigated. Before each pellet preparation the pastel-mortar, spatula, die and sample reader were cleaned with IPA and dried thoroughly. As per the reference IR spectra of eugenol 1600-1420 wavenumber/ cm-1), all samples were analysed for (a) % absorbance Vs wavelength and (b) % transmittance wavenumber/ cm-1. Reference spectra (FigureS 3 & 4) were compared to the spectra of each sample and it was identically same peak in the both way % absorbance as well as %transmittance, which confirmed the presence of eugenol in all the samples. In comparison of all fives samples with respect to the total transmittance area, each sample has different unit of area, which conclude the concertation of eugenol is not same at each section of the clove. At 1513 cm-1 mid part of the clove has highest % transmittance (736.72) and flower have the lowest (489.89) area and same at 1431cm-1 mid part of the clove has highest % transmittance (133.35) and flower have the lowest (58.22) area. Based on total area at two different peaks it can be proved that the middle part of the clove has the highest concentration of the clove.
![Figure 3: Reference Infrared (IR) Spectrum of Eugenol; % absorbance vs wavenumber [18].](/fulltextimages/9164/fig_3.png)
![Figure 4: Reference IR Spectra of Eugenol; % transmittance vs wavenumber [19].](/fulltextimages/9164/fig_4.png)
Conclusion
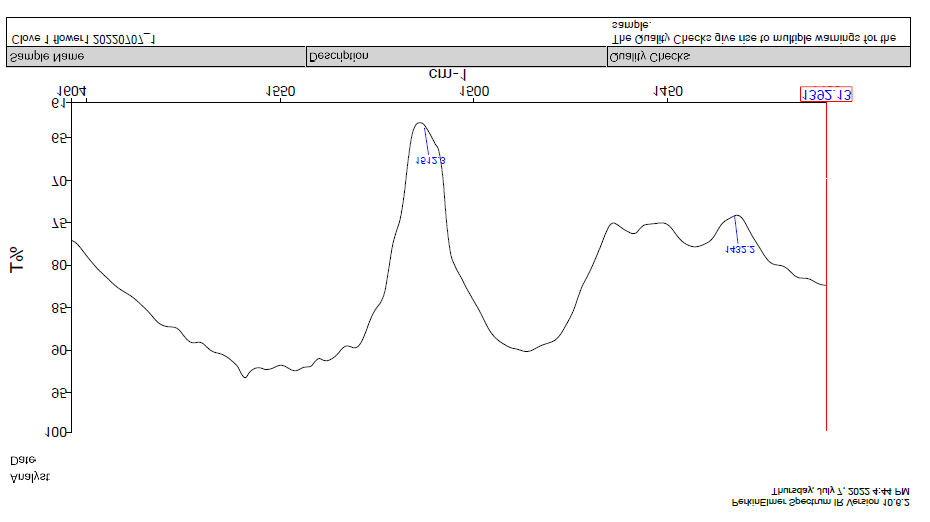
According to ayurveda, clove is a best home remedy for treating several ailments and disorders. The established analytical method was applied to quantitatively analyse eugenol within 10 samples collected from different location of a single clove. The content of eugenol in different locations of a clove is represented in the total area of transmittance in (Figures 5-18). Results shows that the content of eugenol in Ovules (Mid of the clove) was significantly different in comparative of other location of clove. Therefore, this quantitative analysis can provide a scientific and technical data as prove that Ovules is the richest source of Eugenol.
Funding Sources
This research did not receive any specific grant from funding agencies in the public, commercial, or not-for-profit sectors.
References
-
Hussain S, Rahman R, Mushtaq A, Zerey Belaskri A (2017) Clove: A review of a precious species with multiple uses, International Journal of Chemical and Biochemical Sciences 11(2017): 129-133.
-
Agrawal M, Agrawal S, Rastogi R, Singh P, Adyanthaya BR, et al. (2014) A review on uses of clove in oral and general health. Indian Journal of Research in Pharmacy and Biotechnology 2(4): 1321-1324.
-
Mbaveng AT, Kuete V (2017) Zingiber officinale. In: Kuete V (Ed.), Medicinal Spices and Vegetables from Africa. Elsevier, Amsterdam, pp: 627-639.
-
Zheng GQ, Kenney PM, Lam LK (1992) Sesquiterpenes from clove (Eugenia caryophyllata). J Nat Prod 55(7): 999-1003.
-
Gaydou EM, Randriamiharisoa R (2016) Multidimensional analysis of gas chromatographic data, application to the differentiation of clove bud and clove stem essential oils from Madagascar. Perfumer and Flavorist.
-
Gopalakrishnan N, Narayanan CS (1988) Composition of clover leaf oil during leaf growth. Indian Perfumers.
-
Mittal M, Gupta N, Parashar P, Mehra V, Khatri M (2014) Phytochemical evaluation and pharmacological activity of Syzygium aromaticum: a comprehensive review. Int J Pharm Pharm Sci 6(8): 67-72.
-
Gopalakrishnan N, Narayanan CS, Mathew AG (1988) Chemical composition of Indian clove bud, stem and leaf oils. Indian Perfumers.
-
Chaieb K, Hajlaoui H, Zmantar T, Kahla Nakbi AB, Rouabhia M, (2007) The chemical composition and biological activity of clove essential oil, Eugenia caryophyllata (Syzigium aromaticum L. Myrtaceae): a short review. Phytother Res 21(6): 501-506.
-
Pino JA, Marbot R, Agüero J, Fuentes V (2001) Essential oil from buds and leaves of clove (Syzygium aromaticum (L.) Merr. et Perry) grown in Cuba. Journal of Essential Oil Research 13(4): 278-279.
-
Smiley PM, Miles WH (2002) Modeling the Drug Discovery Process: The Isolation and Biological Testing of Eugenol from Clove Oil. J Chem Educ 79(1): 90.
-
Barceloux DG (2008) Medical Toxicology of Natural Substances: Foods, Fungi, Medicinal Herbs, Plants and Venomous Animals. Wiley, Hoboken, New Jersey.
-
Rapp C (2007) Clove oil as effective as topical anesthetic. Herbal Gram 74: 26.
-
Mohammadi Nejad S, Özgüneş H, Başaran N (2017) Pharmacological and Toxicological Properties of Eugenol. Turk J Pharm Sci 14(2): 201-206.
-
Wang, Z, Gérardy R, Gauron G, Damblon C, Monbaliu JC, et al. (2019) Solvent-Free Organocatalytic Preparation of Cyclic Organic Carbonates under Scalable Continuous Flow Conditions. React Chem Eng 4(1): 17-26.
-
Dunn A, Leitch D, Journet M, Martin M, Tabet E, et al. (2019) Selective Continuous Flow Iodination Guided by Direct Spectroscopic Observation of Equilibrating Aryl Lithium Regioisomers. Organometallics 38(1): 129-137.
-
Grignard Clagg K, Hold S, Kumar A, Koenig S, Angelaud R, et al. (2019) A telescoped Knochel-Hauser Kumada- Corriu Coupling Strategy to Functionalized Aromatic Heterocycles. Tetrahedron Letters. 60(1): 5-7.
-
SpectraBase, Eugenol.
-
(2022) Spectral Database for Organic Compounds (SDBS), Compound Name: eugenol.
- Management of Ear Keloid with Ksharsutra: A Case Study
- Yoga and Global Sustainability: A Holistic Path to One Earth, One Health
- Autoimmune Diseases in Ayurveda: A Narrative Review with Classical and Modern Perspectives
- Management of Cluster Headache Associated with Pituitary Apophysitis by CERT (Chakrasiddh Energy Release Technique): A Case Report on Energy Rebalancing
- Zygophyllum Geslini Coss : Biochemicals and Antioxidant Activity
- Observations of a Beginner Vaidya