Determination of Mixderm Cream: A Comparative Study Applied on Quaternary Mixture
A comparative study for the validation of two analytical approaches applied for the simultaneous determination of betamethasone valerate (BV), tolnaftate (TF), gentamicin (GM), and clioquinol (CQ) formulated in mixderm® cream. The first approach was TLC-spectrodensitometric method, which was advanced by separating the four components on TLC aluminum plates using chloroform-methanol-acetic acid-formic acid (6:1:0.15:0.25, v/v/v/v) as a mobile phase, then scanned at 254 nm. The detection limit is in the range 0.07–0.48 mg mL−1. The second approach was the chemometric method using two models: partial least squares (PLS) and principle component regression model (PCR). The proposed approacheswere validated according to ICH guidelines were applied for the determination of the quaternary mixtures in their analytical mixtures and pharmaceutical preparations.
Introduction
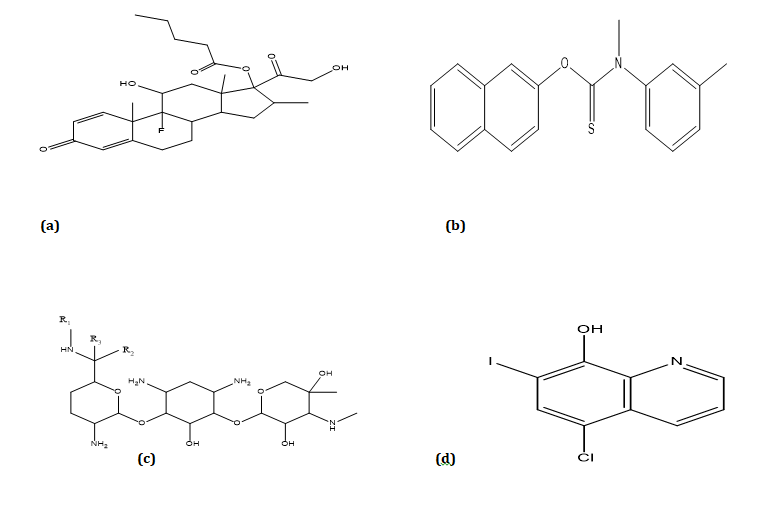
Betamethasone valerate (BV) is a glucocorticoid used for the management of various disorders. Its lack of mineralocorticoid properties makes betamethasone particularly suitable for treating cerebral edema and congenital adrenal hyperplasia [1]. A review of the literature showed that methods reported for the determination of (BV) alone or in combinations were spectrophotometry [2], HPLC [3] and electrochemical methods [4]. Tolnaftate (TF) is a synthetic over-the-counter anti-fungal agent. It is used to treat jock itch, athlete’s foot and ringworm [1]. Several methods were reported for (TF) alone or in combinations as spectrophotometry [5], spectrofluorometry [6], HPLC and HPTLC [7]. Gentamicin (GM) is a broad-spectrum antibiotics, but may cause ear and kidney damage [1]. GM was determined alone or in combinations by variety of methods as electrochemical methods [8], spectrophotometry [9] and HPLC [10]. Clioquinol (CQ) is an antifungal drug and antiprotozoal drug. The drug have been found to have activity against both viral and protozoal infections [1], determined alone or in combinations by methods such as spectrophotometry [11], spectrofluorometry [18], electrochemical methods [12], LC [13] and HPLC [14]. There is no reported method for the determination of the four drugs together either in their quaternary mixture or in the presence of their degradation products. Therefore, the objective of this work was to develop a validated and simple TLC-spectrodensitometric and chemometric methods for the determination of BV, TF, GM and CQ in bulk powders, laboratory prepared mixtures and pharmaceutical dosage form. The chemical structures of the cited drugs were displayed in Figure 1.
Materials and Methods
Apparatus and Software
- The TLC-spectrodensitometric system: CAMAG TLC scanner 3 S/ N 130319 operated with winCATS software, Linomat 5 autosampler (CAMAG, Muttenz, Switzerland), CAMAG microsyringe (100 µL). TLC aluminum sheets (20x20 cm) pre-coated with silica gel 60 F254 (Merck KgaA, Darmstad, Germany) were used. Calculations were performed using the Excel program.
- Ultraviolet/Visible spectrophotometer (Spectronic Genesys® with WINPEC® application software) with1 cm quartz cell, Spectronic, (USA).
- All calculations and statistics were carried out on computer using MATLAB® program version 7.9.
Chemicals and Reagents
• Pure Samples Standard (BV), (TF), (GM), and (CQ) were kindly donated bySIGMA Pharma Co., Quesna, Egypt. Their purity was found to be 100.13±0.84, 99.30±0.55, 100.02±0.30 and 99.80±0.50 %, respectively.
• Market Sample Mixderm® cream (SIGMA pharmaceutical industries Co., Quesna city, Egypt), labeled to contain 0.6 mg (BV), 10 mg (TF), 1 mg (GM) and 10 mg (CQ) per one gm cream (batch No. 61688) were purchased from the Egyptian local market.
• Solvents Methanol and chloroform (Analar grade), formic acid and acetic acid solutions were supplied from (Adwic, El Nasr pharmaceutical Chemicals Co., Egypt).
Standard Solutions
• Stock Solutions Solutions were prepared in methanol of concentrations: 2 mg mL−1 BV, 2 mg mL−1 TF, and 1 mg mL−1 of CQ; and in methanol and water of concentration 4 mg mL−1 GM.
• Working Solutions Working solutions were freshly prepared by further dilution of suitable volumes from each stock solutions with methanol to get solutions of final concentration for TLC- spectrodensitometric method, 0.5 mg mL −1 BV, 0.5 mg mL−1 TF, 2 mg mL−1 GM, and 0.6 mg mL−1 of CQ; for chemometric method, 100 μg mL−1 BM, 100 μg mL−1 TF, 2000 μg mL−1 GM, and 6 μg mL−1 of CQ.
Procedure
• For TLC–Densitometric Method
• Chromatographic Conditions TLC aluminum sheets 20 x 20 cm pre-coated with 0.25 mm silica gel 60 F254were used. The prepared samples were tested as bands (bandwidth: 6 mm, bands were dispersed 1 cm apart from each other and 1.5 cm from the bottom of the plate). The developing system used was chloroform-methanol-acetic acid-formic acid (6:1:0.15:0.25, v/v/v/v) as a mobile phase of total volume approximately 10 milliliters. Linear ascending expansion was completed in a chromatographic tank previously saturated with the developing system for 15 min. at room temperature (25 ± 2 °C) to a distance of approximately 8 cm from the lower edge (approximately 10 min). The developed plates were dried in air for approximately 5 min. and scanned at 254 nm. The detection was done using Camage TLC scanner 3 operated in the reflectance-absorbance mode. The slit dimension was kept at 3 mm x 0.45 mm and the scanning speed was 20 mm/s. All measurements were performed by winCATS software.
• Application to Pharmaceutical Preparation A four-grams portion of cream was conveyed to a 50-mL volumetric flask, tending to bypass catching cream to the walls of the volumetric flask. A 30- mL portion of methanol and 10 mL portion of water was added to the flask, and the cream was granted to melt by warming at 60oC in a water bath with shaking. The solution was granted to cool to room temperature. The volume was made up to the mark with methanol and mixed. The solution was centrifuged at 10000 rpm for 10 min, and a clear supernatant solution was obtained. A portion of the supernatant was diluted with methanol to obtain a final concentration 24 μg mL−1 of BV, 400 μg mL−1 of TF, 40 μg mL−1 of GM and 400 μg mL−1 of CQ.
• Linearity and construction of calibration curves Aliquot volumes (1-7), (6-18), (1-6) and (8-18) μg band-1of BV, TF, GM and CQ were separately conveyed from their working solutions into 10 mL volumetric flasks and diluted to volume with methanol. Aliquot of 10 μL of each solution was applied to the TLC plate using a 100 μL syringe. The chromatographic conditions were tested and the chromatograms were recorded. The calibration curves were constructed by plotting the recorded peak area versus the corresponding drug concentrations, from which the regression equations were calculated.The calibration curveswere made from the average of three experiments.
- For Chemometric Method
- Construction of Calibration Set Multilevel partial factorial design [15] was used for the development of the calibration and validation sets. Fifteen mixtures were needed for construction the calibration model. The laboratory-prepared mixtures of BV, TF, GM and CQ were abled in their concentration ranges. The spectra of the abled mixtures were recorded in the range of 200-400 nm and conveyed to Matlab® for subsequent data manipulation.
• Application to Validation Set Into sets of 10-mL volumetric flask, aliquots of each ingredient were conveyed from their working solutions to prepare five mixtures of different ratios of the studied drugs. The absorption spectra of the abled solutions from 200 to 400 nm were recorded and conveyed to Matlab®. The concentration of each ingredient was calculated using the constructed model.
• Application to Pharmaceutical Preparation As described before, then the solution was centrifuged at 10000 rpm for 10 min, and a clear supernatant solution was obtained. Further dilution was done to obtain a final concentration 24 μg mL−1 of BV, 400 μg mL−1 of TF, 40 μg mL−1 of GM and 400 μg mL−1 of CQ. The concentration of each ingredient was calculated using the constructed PLS and PCR models. When applying the standard addition technique, contrasting known concentrations of the standard of each ingredient were added to the dosage form before proceeding in the previously mentioned procedure.
Results and Discussion
This work was aimed to develop, and validate simple, accurate, selective, and precise analytical approaches which were TLC-spectrodensitometric and chemometric methods, for the simultaneous assessment of the quaternary mixture of BV, TF, GM and CQ in their pure form and pharmaceutical dosage form.
TLC–Densitometry
This approach offers a simple manner for quantification directly on TLC plate by calculating the optical density of the separated bands. The amounts of ingredients are detected by the comparison between them and the standard curve from reference materials chromatographed simultaneously under the same conditions.
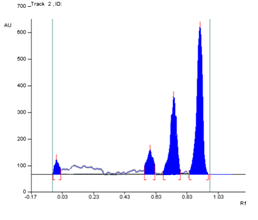
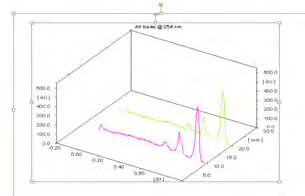
• Optimization of the Method To optimize the approach conditions, it was necessary to check the effect of various variables. To separate the three drugs from each other’s, several ratios of different developing systems were investigated. Certainly, it was established that the best separation of the cited drugs was achieved by applying the developing system using chloroform-methanol- aceticacid-formicacid (6:1:0.15:0.25, v/v/v/v). _R_f for BV, TF, GM and CQ were 0.59± 0.01, 0.91±0.02, 0.05±0.01, and 0.74±0.01, respectively. Different scanning wavelengths were tried; on using 245 nm where the separated peaks were sharp and symmetrical with minimum noise, as shown in Figure 2.
• Method Validation Method validation was completed according to the International Conference on Harmonization (ICH) guidelines [16] regarding linearity, range, precision, accuracy, limit of detection and limit of quantitation.
• Range and Linearity The linearity of the suggested method was assessed by preparing different calibration curves. Analysis was carried out on a series of standard drug solutions, the calibration curves were constructed between AUC and corresponding concentrations of bands. Linear regression analysis was applied and analytical parameters were calculated. The linear concentration ranges and other statistical parameters for the proposed method were listed in Table 1.
• Limits of Detection and Quantitation The limit of detection (LOD) and limit of quantitation (LOQ) of the proposed method were calculated (Table 1).
| BV | TF | GM | CQ | |
|---|---|---|---|---|
| Concentration range (μg mL-1) | 01-Jul | Jun-18 | 01-Jun | Aug-18 |
| Slope | 19.89 | 12.52 | 12.329 | 20.029 |
| Standard deviation of the slope (SDb) | 0.156 | 0.084 | 0.068 | 0.218 |
| Intercept | 100.86 | 224.79 | 87.77 | 379.96 |
| Standard deviation of the intercept (SDa) | 0.6962 | 1.064 | 1.1764 | 2.927 |
| Standard deviation of the residuals (SDy/x) | 0.824 | 0.89 | 0.282 | 1.822 |
| Number of determinations | 7 | 7 | 6 | 6 |
| Correlation coefficient (r) | 0.9998 | 0.9999 | 0.9999 | 0.9997 |
| Determination coefficient (r2) | 0.9997 | 0.9998 | 0.9999 | 0.9995 |
| Limit of detection, LOD (μg mL-1) | 0.1155 | 0.28 | 0.3149 | 0.482 |
| Limit of quantitation, LOQ (μg mL-1) | 0.35 | 0.8498 | 0.9542 | 1.46 |
Table 1: Analytical parameters and method validation sheet obtained by applying the proposed TLC-spectrodensitometric method for
• Accuracy For the study of the accuracy of the suggested method, repeated analysis (three times) of different concentrations of BV, TF, GM and CQ within the linearity range were performed (Table 1). By applying standard addition technique to the pharmaceutical formulation, the conflict of excipients was studied. The acceptable accuracy demonstrated that the excipients in the pharmaceutical formulation did not interferein the analysis of these compounds in the pharmaceutical formulation as shown in Table 2.
| Drug | TLC–densitometry | PLS | ||||
|---|---|---|---|---|---|---|
| Taken µg mL-1 | Found µg mL-1 | Recovery%* ±SD | Taken µg mL-1 | Found µg mL-1 | Recovery%* ±SD | |
| BV | 4 | 4.02 | 100.43±0.93 | 30 | 30.04 | 100.13±0.96 |
| TF | 12 | 12.07 | 100.57±0.91 | 35 | 34.97 | 99.91±0.93 |
| GM | 4 | 4.03 | 100.67±0.88 | 90 | 90 | 100.00±0.85 |
| CQ | 14 | 14.15 | 101.08±1.00 | 4 | 3.99 | 99.75±0.75 |
Table 2: Application of standard addition technique to the analysis of Mixderm® cream by applying the proposed methods.
*Average of three experiments. Table 2: Application of standard addition technique to the analysis of Mixderm® cream by applying the proposed methods.
• Precision The inter-day and intra-day precision of the proposed method were determined. The results expressed as percentage recoveries and RSD are shown in Table 3.
| Drug | Conc. Level (μg mL-1) | % Recovery* ± SD | %RSD | ||
|---|---|---|---|---|---|
| Inter-day | BV | 3 | 98.95±0.50 | 0.51 | |
| Inter-day | BV | 4 | 99.77±0.48 | 0.48 | |
| Inter-day | BV | 5 | 99.06±0.55 | 0.56 | |
| Inter-day | TF | 10 | 100.45±0.60 | 0.6 | |
| Inter-day | TF | 12 | 99.99±0.50 | 0.5 | |
| Inter-day | TF | 14 | 99.05±0.55 | 0.56 | |
| Inter-day | GM | 3 | 99.57±0.39 | 0.39 | |
| Inter-day | GM | 4 | 99.31±0.51 | 0.51 | |
| Inter-day | GM | 5 | 100.23±0.40 | 0.4 | |
| Inter-day | CQ | 12 | 100.35±0.56 | 0.56 | |
| Inter-day | CQ | 14 | 100.09±0.47 | 0.47 | |
| Inter-day | CQ | 15 | 99.89±0.65 | 0.65 | |
| Inter-day | Intra-day | BV | 3 | 100.53±0.64 | 0.64 |
| 4 | Intra-day | BV | 99.75±0.48 | 0.48 | |
| 5 | Intra-day | BV | 99.05±0.63 | 0.64 | |
| TF | Intra-day | 10 | 98.95±0.51 | 0.52 | |
| TF | Intra-day | 12 | 100.43±0.61 | 0.61 | |
| TF | Intra-day | 14 | 99.77±0.44 | 0.44 | |
| GM | Intra-day | 3 | 100.45±0.35 | 0.35 | |
| GM | Intra-day | 4 | 99.84±0.39 | 0.39 | |
| GM | Intra-day | 5 | 98.99±0.40 | 0.4 | |
| CQ | Intra-day | 12 | 100.51±0.65 | 0.65 | |
| CQ | Intra-day | 14 | 100.00±0.57 | 0.57 | |
| CQ | Intra-day | 16 | 100.05±0.49 | 0.49 |
Table 3: Application of Intra-day and Inter-day technique to the analysis of BV, TF, GM and CQ in Mixderm® cream by the proposed
*Average of three experiments Table 3: Application of Intra-day and Inter-day technique to the analysis of BV, TF, GM and CQ in Mixderm® cream by the proposed TLC–spectrodensitometric method.
• Selectivity Selectivity was confirmed by analyzing different mixtures containing drugs in different ratios within the linearity range. Satisfactory results were shown in Table 4.
| %Recovery*±SD* | |||||
|---|---|---|---|---|---|
| Mix ratio, | BV | TF | GM | CQ | |
| 1 | 1:1:1:1 | 98.05±0.43 | 99.75±0.61 | 100.20±0.52 | 99.78±0.49 |
| 2 | 1:16.66:1.66:16.66** | 100.21±0.55 | 100.31±0.591 | 99.81±0.52 | 98.95±0..51 |
| 3 | 1:2:3:1 | 98.99±0.615 | 99.59±0.561 | 99.74±0.65 | 99.77±0.60 |
| 4 | 3:1:2:1 | 99.49±0.505 | 98.76±0.53 | 99.74±0.35 | 99.99±0.45 |
| 5 | 2:1:3:3 | 99.79±0.606 | 99.99±0.555 | 99.89±0.46 | 100.01±0.55 |
| Parameter | GM | BV | CQ | TF | Reference value |
| R value f | 0.05±0.01 | 0.59± 0.01 | 0.74±0.01 | 0.91±0.02 | |
| T (tailing factor) f | 1.1 | 1.13 | 0.85 | 1.05 | T≤ 1.15 - 0.95 & T = 1 for symmetric peak |
| R (chromatographic s resolution) | 3.15 | 2.56 | 1.51 | R> 1.5 s |
Table 4: Determination of BV, TF, GM and CQ in laboratory prepared mixtures by the proposed TLC-spectrodensitometric method.
*Average of three experiments ** Ratio in Mixderm® cream Table 4: Determination of BV, TF, GM and CQ in laboratory prepared mixtures by the proposed TLC-spectrodensitometric method.
• System Suitability System suitability was tested by calculating various parameters as shown in Table 5. The attained values were in the adequate ranges when compared to the reference value.
Chemometric Method
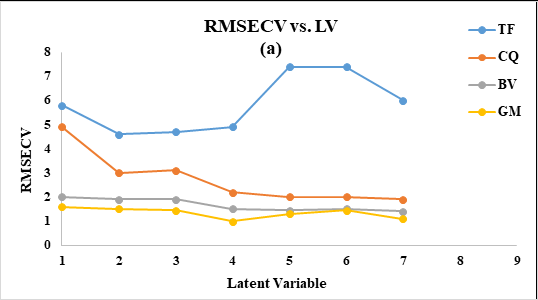
Between the different regression methods current for multivariate calibration, the factor analysis based on partial least squares (PLS) and principal component regression model (PCR) regression have received considerable attention in the chemometrics literature [17]. The calibration set was built using the absorption spectra set of 15 mixtures, as listed in Table 6. The elected model was that with the smallest number of variables such that RMSECV for that model was not naturally larger than RMSECV from the model with additional variable. Four variables were found to be choicest for the mixture, as shown in Figure 3 for PLS and PCR.
- Model Validation
- To check the prediction capability of the proposed models, an external validation set of 15 mixtures was used as shown in
Table 5: The root mean squared errors of prediction (RMSEP)
and the regression equations for the predicted versus actual concentration are shown in Table 7 as diagnostic tools for model validation.
| Experimental No. | Concentration (µg mL-1) | |||
|---|---|---|---|---|
| BV | TF | GM | CQ | |
| 1 | 2 | 34 | 4 | 34 |
| 2 | 3 | 32 | 7 | 34 |
| 3 | 3 | 34 | 2.5 | 32 |
| 4 | 1.5 | 32 | 5.5 | 38 |
| 5 | 2.5 | 38 | 5.5 | 34 |
| 6 | 2 | 38 | 7 | 30 |
| 7 | 3 | 38 | 1 | 36 |
Table 6: Concentration of BV, TF, GM and CQ in the calibration set using PCR and PLS models.
| 8 | 3 | 30 | 5.5 | 30 |
|---|---|---|---|---|
| 9 | 2.5 | 30 | 4 | 36 |
| 10 | 1 | 34 | 5.5 | 36 |
| 11 | 2.5 | 36 | 2.5 | 30 |
| 12 | 2.5 | 32 | 1 | 32 |
| 13 | 1 | 32 | 4 | 30 |
| 14 | 2 | 30 | 1 | 38 |
| 15 | 1 | 30 | 7 | 32 |
Table 7: Concentration of BV, TF, GM and CQ in the calibration set using PCR and PLS models.
| Validation parameters | PCR | PLS | ||||||
|---|---|---|---|---|---|---|---|---|
| BV | TF | GM | CQ | BV | TF | GM | CQ | |
| Slope | 1.0541 | 1.0051 | 0.9992 | 0.9895 | 0.9935 | 0.9751 | 0.9953 | 1.0059 |
| Intercept | 0.1501 | 0.0059 | 0.01591 | 0.0342 | 0.1245 | 0.1151 | 0.0135 | 0.008 |
| Correlation coefficient (r) | 0.999 | 0.9999 | 0.9992 | 0.9997 | 0.9998 | 0.9996 | 0.9994 | 0.9995 |
| RMSEP | 0.1151 | 0.0931 | 0.0357 | 0.224 | 0.2765 | 0.1189 | 0.0974 | 0.0394 |
Table 8: Summary of results obtained by applying the diagnostic tools for model validation of the PCR and PLS models with BV, TF,
Statistical Analysis
Table 8 showed statistical comparison of the results achieved by the suggested methods and reported methods for BV [3], TF, GM [13] and CQ for TLC-spectrodensitometric method and for chemometric method. The calculated t and F values were less than the theoretical ones indicating that there was no significant difference between the proposed and the reported methods with respect to accuracy and precision.
| BV | TF | GM | CQ | |||||||||||||
|---|---|---|---|---|---|---|---|---|---|---|---|---|---|---|---|---|
| Report- ed method | TLC | PLS | PCR | Report- ed method | TLC | PLS | PCR | Report- ed method | TLC | PLS | PCR | Report- ed method | TLC | PLS | PCR | |
| Mean | 100.13 | 99.97 | 99.98 | 100.11 | 99.3 | 99.99 | 100.1 | 99.97 | 100.02 | 100.1 | 100.15 | 99.98 | 99.8 | 100.03 | 100.12 | 100.14 |
| Standard deviation, SD | 0.84 | 0.42 | 0.94 | 1.12 | 0.55 | 0.35 | 0.66 | 0.74 | 0.3 | 0.3 | 0.44 | 0.47 | 0.5 | 0.37 | 0.85 | 0.57 |
| N | 3 | 7 | 7 | 7 | 3 | 7 | 7 | 7 | 3 | 6 | 7 | 7 | 3 | 6 | 7 | 7 |
| Variance | 0.71 | 0.18 | 0.88 | 1.25 | 0.3 | 0.12 | 0.44 | 0.55 | 0.09 | 0.09 | 0.19 | 0.22 | 0.25 | 0.14 | 0.72 | 0.32 |
| Student, t | 0.31 | 0.248 | 0.03 | 2.03 | 2 | 1.58 | 0.38 | 0.54 | 0.16 | 0.72 | 0.75 | 0.96 | ||||
| -2.26 | -2.26 | -2.26 | -2.26 | -2.26 | -2.26 | -2.306 | -2.26 | -2.26 | -2.306 | -2.26 | -2.26 | |||||
| F (19.3) | 3.94 | 1.24 | 1.76 | 2.5 | 1.47 | 1.83 | 1 | 2.11 | 2.44 | 1.79 | 2.88 | 1.28 |
Table 9: Statistical comparison between the results obtained by the proposed TLC-spectrodensitometric, chemometric and the report
Conclusion
This work conferred a comparative study on two analytical approaches based on UV spectrophotometry which were TLC-densitometric method and multivariate chemometric spectrophotometric method (PLS) and (PCR). Both approaches were profitably applied for the simultaneous determination of the quaternary mixture of BV, TF, GM and CQ in their pure form and pharmaceutical formulation. The TLC-densitometric method has the favor over HPLC as it diminishes the management of reagents which backing the eco-friendly behavior of green chemistry, it diminishes the time needed for analysis, and it utilizes the benefit of handling several sample bands on TLC plate, which may be more beneficial for regulatory quality control laboratories. In addition, the method is cheap and does not require special types of stationary phases, but still, the method achieve the same validation parameters and efficiency when correlated to reported HPLC method. Meanwhile, the chemometric method has the merits of being simpler as it does not require certain chemicals or reagents, and it is considered to be cost - and time -saving, but it need special software (Matlab). It was found that PLS preceded PCR in the analysis of such complex mixtures. As a final outcome, the results earned by the two suggested methods were accurate, reliable, and precise. So, both methods can be hired for routine analysis in quality control as different methods to HPLC methods in the laboratories of quality control missing the required facilities for those costly techniques.
References
-
Goodman LS, Gilman AM, Brunton LL (2008) Goodman & Gilman’s manual of pharmacology and therapeutics. McGraw-Hill Medical, New York.
-
Fayed A, Rezk M, Marzouk H, Abbas S (2019) Spectrophotometric Assessment of a Spectrally Overlapping Mixture of Cinchocaine Hydrochloride and Betamethasone Valerate in the Presence of Their Degradation Products. Journal of Applied Spectroscopy 86: 176-186.
-
Qie M, Zhao Y, Yang S, Wang W, Xu Z (2019) Rapid simultaneous determination of 160 drugs in urine and blood of livestock and poultry by ultra-high-performance liquid chromatography-tandem mass spectrometry. Journal of Chromatography A 1608: 460423.
-
Rezk MR, Fayed AS, Marzouk HM, Abbas SS (2017) Green Ion Selective Electrode Potentiometric Application for the Determination of Cinchocaine Hydrochloride in Presence of Its Degradation Products and Betamethasone Valerate: A Comparative Study of Liquid and Solid Inner Contact Ion-Selective Electrode Membranes. Journal of The Electrochemical Society 164(9): H628-H634.
-
Emam RA, Abdelrahman MM, Abdelaleem EA, Ali NW (2019) Novel spectral manipulations for determinations of Tolnaftate along with related toxic compounds: Drug profiling and a comparative study. Spectrochimica Acta Part A: Molecular and Biomolecular Spectroscopy 223: 117290.
-
Alarfaj NA, El-Tohamy MF (2016) Eu(III)-Sensitized Luminescence Probe for Determination of Tolnaftate in Pharmaceuticals and Biological Fluids. Journal of AOAC International 99(2): 380-385.
-
Abdelaleem EA, Abdelrahman MM, Ali NW, Emam RA (2019) Two validated chromatographic determinations of an antifungal drug, its toxic impurities and degradation product: A comparative study. Biomedical Chromatography 33(8): e4547.
-
Almeida JM, Toloza CA, Machado BS, da Silva AR, Aucelio RQ (2019) Determination of gentamicin sulfate by batch- injection amperometry after solid-phase extraction using a kanamycin-template imprinted polymer. Microchemical Journal 145: 187-195.
-
Krzek J, Woltynska H, Hubicka U (2009) Determination of Gentamicin Sulphate in Injection Solutions by Derivative Spectrophotometry. Analytical Letters 42(3): 473-482.
-
Sun X, Yang Y, Tian Q, Shang D, Xing J, Zhai Y (2018) Determination of gentamicin C components in fish tissues through SPE-Hypercarb-HPLC-MS/MS. Journal of Chromatography B 1093-1094: 167-173.
-
Abdel-Aleem EA, Hegazy MA, Sayed NW, Abdelkawy M, Abdelfatah RM (2015) Novel spectrophotometric determination of flumethasone pivalate and clioquinol in their binary mixture and pharmaceutical formulation. Spectrochimica Acta Part A: Molecular and Biomolecular Spectroscopy 136: 707-713.
-
Kokulnathan T, Chen S-M (2019) Rational Design for the Synthesis of Europium Vanadate-Encapsulated Graphene Oxide Nanocomposite: An Excellent and Efficient Catalyst for the Electrochemical Detection of Clioquinol. ACS Sustainable Chemistry & Engineering 7(4): 4136-4146.
-
Ekpenyong O, Cooper C, Ma J, Liang D, Olaleye O, et al. (2018) A simple, sensitive and reliable LC-MS/ MS method for the determination of 7-bromo-5- chloroquinolin-8-ol (CLBQ14), a potent and selective inhibitor of methionine aminopeptidases: Application to pharmacokinetic studies. Journal of Chromatography B 1097-1098: 35-43.
-
Schaber PM, Hobika G (2018) Determining the Antifungal Agent Clioquinol by HPLC, the Not So Pure Preparation: A Laboratory-Based Case Study for an Instrumental Analytical Chemistry Course. Journal of Chemical Education 95(3): 445-450.
-
Berereton RG (2003) Chemometrics: Data Analysis for the Laboratory and Chemical Plant. USA: John Wiley & Sons, Ltd.
-
Guideline IHT (2005) Validation of analytical procedures: text and methodology Q2 (R1). In: International conference on harmonization, Geneva, Switzerland, pp: 11-12.
-
Fayed AS, Shehata MA, Ashour A, Hassan NY, Weshahy SA (2007) Validated stability-indicating methods for determination of cilostazol in the presence of its degradation products according to the ICH guidelines. Journal of pharmaceutical and Biomedical Analysis 45(3): 407-416.
- Spectrophotometric Determination of Lanthanum (III) and Some Rare Earths with Xylenol Orange
- Introduction and Sources of Molluscicides
- Trimetazidine: An Antianginal Drug and Not Only!
- Nature Inspired Discovery and Development of Antibacterials: An Update
- Fungal Biodegradation of Polycyclic Aromatic Hydrocarbons (PAHs)
- Recent Approaches of Impurity Profiling in Pharmaceutical Analysis: A Concise Review