Determination of Selected Heavy Metals from Treated Industrial Waste Discharge in Tea Industries and Sugar Industries
Industrial waste contains organic compounds, sediments, salts, grease, oxygen demanding materials and heavy metals. During treatment not all those components are removed before they are discharged to rivers and other water bodies near the industries. Some harmful compounds remain in the treated industrial waste hence posing a very high health and environmental risk to the human kind using the water bodies near industries. This research specifically targeted lead and copper by ascertaining the concentration in the several samples collected from the treated industrial waste discharge down the stream from the point of discharge and the upstream of the river from the point of discharge. This study mainly focused on copper and lead due to their serious potential health hazards such as brain damages, premature birth, cardiovascular effects, kidney failure and reproductive problems to people living around these industries.
Introduction
In this study, wastewater samples were collected from the two industries in both the downstream part and upstream part. The samples were collected in January and some in March to cover both dry and rainy season. For the solubility of the metals to be achieved from the collected samples, a wet digestion procedure was and will be done. This involved spiking of the samples with a specific standard solution of each metal having percentage purity range of 98% to 99.9%. Quantitative analysis was performed by Atomic Absorption Spectrophotometer. The concentration of the heavy metal cautions in the waste water varied from <DL (below detection limit) to 0.0001mg/L for Cu and <DL to 0.089 for Pb in both the two industries. The concentrations of the heavy metals in the wastewater were below the recommended limit of World Health Organization and National Environment Management Authority.
Chapter 1
Introduction
Background of the Study: Sewage discharge contains residues of polycyclic aromatic hydro carbons (PAHs) and organochlorine pesticides (OCPs). The residues are accumulated in the soils and transferred through food chains and consequently cause adverse health effects on humans and biological effects on fauna and flora [1]. According to Fernandez LG [2] the air soil and water pollution by industrial effluent are associated with various diseases and could be the reason for current shorter life expectancy. (WHO) [3, 4] the sewage effluents from industries contain moderate amounts of metallic cations. When toxic substances enter into the water bodies they get dissolved or le suspended in water or get deposits on the bed this results in the pollution of water whereby the quality of the water deteriorates, affecting aquatic ecosystems. Polluted water is inappropriate for domestic use recreational activities, agriculture and industrial application. In industries polluted water can cause problems such as corrosion, reduced heat transfer in heat exchangers, reduced water flow and product contamination. Industries suffer a big disease where improper treatment of water cause reduced equipment performance or equipment failure. Ghosh M [5] incidence of heavy metals accumulation in fish, oysters sediments and other components of aquatic ecosystem has been reported globally. These toxic heavy metals entering the aquatic environment are adsorbed onto particulate matters, although they can form free metal ions and soluble complexes that are available for uptake by biological organisms. The metals associated with particulate materials are also available for biological uptake and are deposited in estuarine sediments. Significance of the Study: Industrial effluents contribute to water pollution. Kaizer AN [6] industrial effluents usually contains specific and readily identifiable chemical compounds. In Kenya most of big industries have effluent treatment plant facilities but many small industries do not have adequate effluent treatment facilities.to ensure that there is no contamination in local water bodies there is need to develop multidisciplinary approach beyond boundaries for serious health hazards that may arise due to this negligence. Statement of the Problem: The effects of water pollution are not only devastating to people but also to animals, fish and birds. Polluted water is unsuitable for drinking, recreation, agriculture and industry. It diminishes the aesthetic quality of lakes, rivers and ground water supplies. Volesky [7] more seriously contaminated water destroys aquatic life and reduces its reproductive ability. In this study there is need to create the best approach that industries will use in ensuring that they don’t contaminate water that may lead to stunted growth in plants, respiratory problems in human being and even death of some aquatic ecosystem.
Objectives
General objective: To assess specific heavy metals in treated industrial waste from various industries. Specific objective: To compare quantitatively the level of heavy metals in the treated industrial wastes and water bodies. Justification: The main intention for this research is to show and create a clear consciousness about the effects of heavy metals on water bodies for the people living around industries that discharge their wastes in rivers lakes and streams.
Hypothesis of the Study
There is high contamination of water bodies by industrial effluents due to negligence hence posing chronic risks to aquatic ecosystem.
Scope of the Study
This study will be conducted in University of Eastern Africa, Baraton and the samples will be obtained from Kaptel tea factory in Nandi county and west Kenya Sugar Company in Kakamega County.
Chapter 2
Literature Review
Introduction: In definition heavy metals are always defined as metallic elements that have a relatively high density compared to the density of water. Heavy metals like arsenic(As), copper(cu), chromium(cr), cadium(cd), mercury(hg), iron(fe), lead(pb), nickel(ni) thallium(ti) and zinc(Zn) are very hazardous in their combination or particular elemental forms. The release of high amounts of heavy metals into water bodies creates serious health and environmental problems and may lead to an upsurge in waste water treatment cost. Heavy metals also occur in small amounts naturally and may enter into aquatic system through leaching of rocks airborne dust, forest fires and vegetation [2]. Their occurrence and accumulation in the environment is a result of direct or indirect human activities, such as rapid industrialization, urbanization and anthropogenic sources. With continuous contamination from human activities, fresh water ecosystem has been degraded on the planet thus worsening the quality of water being consumed. This degradation of the fresh water ecosystem has not only endangered the marine life, but also created health challenges to human population [8]. In aquatic ecosystems, [9] heavy metals greatly depress the number of living organisms. Heavy metals have negative effects on the growth of aquatic organisms and can cause serious upsets in biological waste water treatment plants. The presence of heavy metals pollutants serve as great threats to soils and plants growing on such soils, with the consumption of such plants by animals and humans due to their entry into the food chain through bio magnification and bioaccumulation, leading to severe detrimental effects. The density of heavy metals generally exceeds 5g/cm2 and many metals as listed above fall in this category. An element such as arsenic is hazardous but it is semi-metal. At higher doses, heavy metals can cause irreversible brain damage. Children may receive high doses of metals from food and adults since they consume more food for their body weight than adults [10]. Heavy metals such as cadmium, zinc, lead, chromium, nickel, copper, vanadium, platinum, silver and titanium are generated in electroplating, electrolysis deposition, conversion coating and anodizing cleaning, milling and etching industries. Significant amount of heavy metals wastes like Tin, lead and nickel results from printed circuit board (PCB) manufacturing [11]. Industries that have not yet managed to treat their waste; they can achieve it by as many technologies as possible for example adsorption, chemical precipitation and oxidation, electro dialysis and reverse osmosis. Among these technologies adsorption has many advantages compared.
Composition of Industrial Effluents
Industrial effluents consist of both organic and inorganic materials such as dyes, algae nutrients, surfactants, sediments, oxygen demanding materials, heavy metals and minerals. This waste from industrial processing poses a high risk to aquatic biota and ecosystem.
The major sources of both direct and continuous input of pollutants in aquatic biota are the effluents from industries. Depending on the amount and composition of effluents textile waste is the most damaging contaminant among all the industrial wastes. Conventional monitories effluents are based on physicochemical measurement to determine the total concentration of a particular analyte in the effluent (Tables 1&2).
| Grease, scum, humus | |
|---|---|
| Inorganic compounds | Grit, metal particles, sand and ceramics |
| Heavy metals | Copper, silver, zinc, cadmium, gold, mercury, lead, chromium, iron, nickel, tin, arsenic, selenium, molybdenum, cobalt, manganese and aluminium |
| Soluble inorganic materials | Thiosulfate, cyanide, thiocyanates, hydrogen sulphide |
| Soluble organic material | Drugs, urea, sugars and soluble proteins |
| Toxins | Fungicides, pesticides, herbicides, germicides |
| Microplastics | Polyethene, polypropylene, polyamide and polyester |
| Gases | Carbon(iv) oxide, methane |
| Emulsions | Emulsified oils, adhesive, mayonnaise. |
Table 2: Physical pollutants in industrial effluents.
| Bacteria | Salmonella typhosa, vibrio cherae, shigella |
|---|---|
| Viruses | Hepatitis A, enteroviruses |
| Protozoa | Entamoeba, giardia lamblia, histolytica |
| Parasites | Helmiths |
Table 1: Biological pollutants in industrial effluents.
Sources of Heavy Metals
There are many sources of heavy metals, both natural sources and artificial sources. Naturally heavy metals occur from volcanicity, run off water in urban areas, soil erosion, and aerosals. Artificially, human activities such as industrialization, agriculture, negligence dumping, uncontrolled disposal, nuclear power, electroplating processes, metal finishing can be the source of heavy metals.
It is very difficult to control natural sources of heavy metals while artificial sources of heavy metals are easy to control because they occur due to human activities. Human activities that can produce heavy metals can be regulated to prevent the heavy metals to the environment. With rapid industrialization and consumerist lifestyles sources of environmental pollution have increased. The pollution occurs both at the level of industrial production as well as end use of the products and runoff. The toxic elements enter the human body mostly through food and water and to a lesser extent through inhalation of polluted air, use of cosmetics, drugs, poor quality herbal formulations and “Unani” formulations and even items like toys which have paits containing lead.
Anthropogenic processes of heavy metals have been noted to go beyond the natural fluxes for some metals. Metals naturally emitted in wind. Blown dusts and waste water are mostly from industrial areas. Some imported anthropogenic sources which significantly contribute to the heavy metal contamination in the environment include sugar plants, tea factories, automobile exhaust, smelting etc. human activities have been found to contribute more to environmental pollution due to the everyday manufacturing of goods to meet the demands of the large population.
Sources of Heavy Metals in Tea Industries
In tea plantations, use of pesticides and fertilizers lead to accumulation of very toxic heavy metals like lead (Pb), Arsenic (As), Copper (Cu), Nickel (Ni) and Cadmium (Cd) in the tea leaves and bud. Machineries present in the industries and the lubricants used are always made of heavy metals and during the industrial processing many losses occur hence end up mixing with either the products or the effluent that is to be discharged. For instance from the tea plantations the tea leaves or bud are directly transported to the industries for processing without elimination of heavy metals which makes it a serious problem to the consumers or the people living around the river of discharge.
Sources of Heavy Metals in Sugar Industries
The significant variations in heavy metals concentrations in soil of different areas as well as sugarcane plant cause variations in heavy metals concentrations in molasses.
Cane molasses is a by-product of sugar industry as widely known.
The irrigation of sugarcane and high input of different phosphatic fertilizers contain some amounts of heavy metals which is absorbed by the sugarcane during uptake from the soil. During production of sugar some additives are added in production stages and they tend to contain some significant amounts of heavy metals hence increasing the amounts of heavy metals present during production. There can also be sources of heavy metals during production where there are corrosion effects on the containers due to passage of CO2 and SO2.
Effects of Heavy Metals on Aquatic Ecosystem
Due to many sources of heavy metals in the environment, great effects are impacted in either aquatic ecosystem or environmental areas. Heavy metals are transported by runoff water, waste water discharge from industries or other human activities to the water bodies. Large amount of their metals end up accumulating in the soil and sediments of the water bodies.
According to heavy metals can be found in traces in water sources and still be very toxic and improve. Serious health problems to humans and other ecosystem. This is because the toxicity level of a metal depends on factors such as the organisms which are exposed to it, its nature, its biological role and the period of which the organism are exposed to the metal. Food chains and food webs symbolize the relationships amongst organisms. Therefore, the contamination of water by heavy metals actually affects all organisms. Humans, an example of organisms feeding at the highest level, are more prone to serious health problems because the concentration of heavy metals increases in the food chain.
Aquatic ecosystems are highly complex, dynamic and subject to many internal and external relationships that are subject to change over time. The pollutants that enter the inshore waters and estuaries create serious problems causing extensive damage to the life and activities of the living aquatic organisms and even to mass mortality. Among the pollutants, accumulation of heavy metals in aquatic ecosystem is of global importance.
Heavy metals become toxic when they are not metabolized by the body and accumulate in the soft tissues. Heavy metals may enter the human body through food, water, air or absorption through the skin when they come in contact with humans in agriculture and in manufacturing, pharmaceutical, industrial or residential settings. Industrial exposure accounts for a common route of contamination for adults. Ingestion is the most common route of exposure in children [10]. Heavy metals are non-biodegradable hence they are dangerous because they accumulate in a biological organism over time. When such compounds are taken up, they tend to be stored faster in the body than they are broken down.
Control and Prevention of Heavy Metals to the Natural Environment
Most of the industrial scale remediation involving, physical, chemical and biological methods are employed as single methods remediation strategies. Despite the success of these problems, they do face certain disadvantages like low efficiency, high cost and toxic sludge generation. However, this can be overcome by upgrading them as integrated process, which has exhibited more efficiency for heavy metals remediation.
Creating a wide awareness on the dangerous effects of discharging untreated waste to the rivers and negligence of dumping waste to the rivers is one of the control measures that can be put in pace. Protecting the water bodies is necessitated for the long- term survival of aquatic ecosystem. Prevention and control of heavy metals also should start with the source of pollution. Moreso artificial sources need to be controlled now that natural sources like aerosals and volcanicity cannot be controlled. Controlling the treated and untreated industrial effluents from industries is also an effective measure for preventing and governing heavy metal pollution of water bodies. In addition, treating and retreating the industrial waste should be done to ensure minimal or no amount heavy metals is discharged to the water bodies.
Toxicity of Lead and Its Health Risks
Lead as an element and its compounds are very toxic and accumulate in the body of human beings. Common sources of lead are waste water, batteries, paint, hair dyes, cosmetics, cutleries, coal etc. lead accumulate in internal body organs through respiratory tract, digestive tract and the skin. Children and the elderly are more affected by lead. The level of lead in water is at 0.16mg/l and should not exceed that. The human intake of lead should not exceed 0.1mg/l.
Heath risks
- Anaemia
- kidney damage
- Brain damage
- Death
- Placental barrier
- Exposure of the unborn in the uterus
- Damage developing baby nervous system
Toxicity of Copper and Its Health Risks
Copper metal should not be taken in high quantities hence can cause serious health problems. Intake of copper should not exceed 0.2mg/l in human beings. Health risk
- Abdominal pain
- Nausea
- Vomiting
- Stomach cramps
- Diarrhoea
- Liver damage
- Kidney damage
- Death
- Cancer
Chapter 3
Materials and Methods
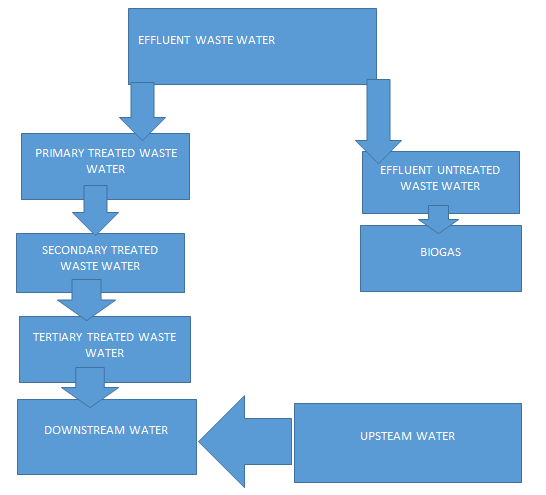
Conceptual Framework
Sources of Raw Materials
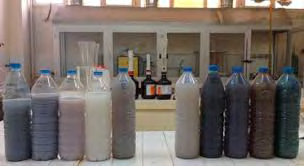
Waste water samples that was used in this research was collected from effluent water of Kapkoros Tea factory in Bomet County and West Kenya Sugar company in kakamega county; from the discharged river, both upstream and downstream. Effluent samples were stored in polythene containers that were cleaned by washing in non-ionic detergent, rinsed with tap water and later soaked in 10% HNO3 for about 12 hours and finally rinsed with deionised water prior to usage.
Preparation of Samples
The samples were prepared by digesting 50ml samples of waste water with 10ml of concentrated HNO3. The samples were heated and the small quantity of samples of HNO3 was added until the solution appears light coloured and clear. The samples were then allowed to cool and were diluted with distilled water up to the mark of 100ml volumetric flask before filtering into 250ml volumetric flask. The samples were then labelled and used for analysis (Figure 2).
Chemical Reagents 1) Waste water samples prepared 2) HNO3 3) Standard solutions of mercury, copper, lead and arsenic 4) Deionized water Equipments and Apparatus 1) Atomic absorption spectrophotometer 2) 250ml volumetric flask 3) 100ml volumetric flask 4) 50ml volumetric flask 5) Beakers 6) Plastic container 7) Filter paper
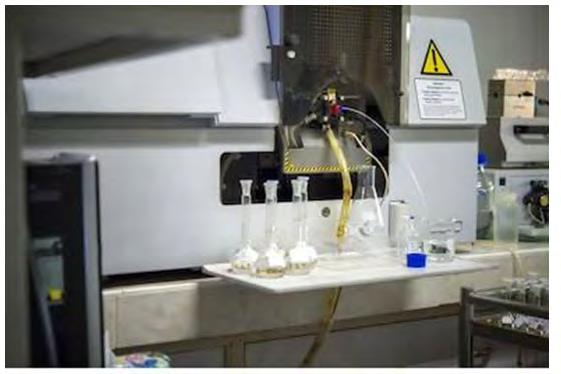
Instrumentation
Digital analytical balance was used for all measurement of samples and chemicals. Atomic absorption spectrophotometer was used to determine the concentration of Pb, and Cu. A potentiometric digital Ph meter was used to determine the Ph of water samples. The hollow cathode lamps for Cu and Pb was used as radiation source and fuel was air acetylene. All the samples and standard were run in duplicate.
Procedure
The purity of all metals to be analysed was checked because all the metals purity needed to range from 98%- 99.9% before they are analysed.
Preparation of Solutions
In metal analysis procedure, atomic absorption spectrophotometer standard solution containing 100mg/l was used for preparing intermediate standards and writing standard. 1000mg of every metal was dissolved in a volume of 1:1 HNO3 and then diluted to 1 litre mark.
Standard Procedure
Cu and Pb, were analysed with atomic absorption spectrometer using calibration curves after the parameters (lamp alignment, wavelength and slit width adjustment and burner alignment) were optimized for maximum signal intensity and sensitivity of the instrument. The desired wavelength of between 300nm to 500nm and slit width was selected and adjusted at the beginning of every analysis and was constant up to the end of each analysis. This condition and procedure was performed and reported in all the two metals that were analysed in this study (Figure 3).
Results
Sample 001: waste water from the downstream part Sample 002: waste water from the upstream part Sample 003: treated effluents Sample 004: untreated effluents Analyst: MARGARET Date started 11 March 2021, 11:24 Worksheet: MAKWATA DANIEL ANDERE Comment: WATER Methods: Copper, Lead.
Sugar Industry Samples
Methods: Cu WATER (Flame)
| Instrument Mode | Absorbance |
|---|---|
| Sampling mode | Manual |
| Calibration mode | Concentration |
| Measurement mode | Integrate |
| Replicates standards | 3 |
|---|---|
| Replicates samples | 1 |
| Expansion factor | 1 |
| Minimum reading | Disabled |
| Smoothing | 6 points |
| Conc. Units | mg/l |
| Conc. Decimal places | 4 |
| Wavelength | 217.0 nm |
| Slit width | 1.0 nm |
| EHT | 318 volts |
| Lamp current | 9.0 mA |
| Lamp position | 1 |
| Background correction | BC off |
| STANDARD 1 | 0.8639 mg/l |
| STANDARD 2 | 0.94821 mg/l |
| STANDARD 3 | 1.4916 mg/l |
| Samples | Conc. Mg/l |
|---|---|
| Sample 001 | <0.0001 |
| Sample 002 | <0.0001 |
| Sample 003 | <0.0001 |
| Sample 004 | <0.0001 |
| Background correction | BC off |
| STANDARD 1 | 0.5000 mg/l |
| STANDARD 2 | 2.0000 mg/l |
| STANDARD 3 | 3.0000 mg/l |
Methods: Pb WATER (Flame)
| Instrument Mode | Absorbance |
|---|---|
| Sampling mode | Manual |
| Calibration mode | Concentration |
| Measurement mode | Integrate |
| Replicates standards | 3 |
|---|---|
| Replicates samples | 1 |
| Expansion factor | 1 |
| Minimum reading | Disabled |
| Smoothing | 6 points |
| Conc. Units | mg/l |
| Conc. Decimal places | 4 |
| Wavelength | 327.4 nm |
| Slit width | 0.1 nm |
| EHT | 318 volts |
| Lamp current | 9.0 mA |
| Lamp position | 1 |
| Background correction | BC off |
| STANDARD 1 | 1.0000 mg/l |
| STANDARD 2 | 3.0000 mg/l |
| STANDARD 3 | 6.0000 mg/l |
| Samples | Conc. Mg/l |
|---|---|
| Sample 001 | 0.0582 mg/l |
| Sample 002 | 0.0499 mg/l |
| Sample 003 | 0.0113 mg/l |
| Sample 004 | 0.0856 mg/l |
Tea Industry Samples
Methods: Cu WATER (Flame)
| Instrument Mode | Absorbance |
|---|---|
| Sampling mode | Manual |
| Calibration mode | Concentration |
| Measurement mode | Integrate |
| Replicates standards | 3 |
|---|---|
| Replicates samples | 1 |
| Expansion factor | 1 |
| Minimum reading | Disabled |
| Smoothing | 6 points |
| Conc. Units | mg/l |
| Conc. Decimal places | 4 |
| Wavelength | 217.0 nm |
| Slit width | 1.0 nm |
| EHT | 318 volts |
| Lamp current | 9.0 mA |
| Lamp position | 1 |
| Samples | Conc. Mg/l |
|---|---|
| Sample 001 | <0.0001 |
| Sample 002 | <0.0001 |
| Sample 003 | <0.0001 |
| Sample 004 | <0.0001 |
Methods: Pb WATER (Flame)
| Instrument Mode | Absorbance |
|---|---|
| Sampling mode | Manual |
| Calibration mode | Concentration |
| Measurement mode | Integrate |
| Replicates standards | 3 |
|---|---|
| Replicates samples | 1 |
| Expansion factor | 1 |
| Minimum reading | Disabled |
| Smoothing | 6 points |
| Conc. Units | mg/l |
| Conc. Decimal places | 4 |
| Wavelength | 221.0 nm |
| Slit width | 1.0 nm |
| EHT | 318 volts |
| Lamp current | 9.0 mA |
| Lamp position | 1 |
| Background correction | BC off |
| STANDARD 1 | 2.0000 mg/l |
| STANDARD 2 | 7.0000 mg/l |
| STANDARD 3 | 9.0000 mg/l |
| Samples | Conc. Mg/l |
|---|---|
| Sample 001 | <0.0001 |
| Sample 002 | <0.0001 |
| Sample 003 | <0.0001 |
| Sample 004 | <0.0001 |
Discussion
The concentrations of the two heavy metals, Cu and Pb, recorded in the waste water were below the detection limit in both the industries except Pb which gave values below the recommended limit. These results were unexpected because many individuals staying around these industries complain of untreated industrial effluents in the rivers. The levels of Lead in the sugar industry seem to be a bit higher due to use of sugar additives or application of fertilizers that have high amounts of lead.
During production, movable machines can cause presence of lead in wastewater due to friction of the machines. Some machines are made up of lead hence ‘eat’ each other producing tiny pieces of lead. However, some industries might have high levels of lead thus the treatment facility reduces the levels lower than the recommended limit if not eliminating below the detection limit. In the tea industry, the levels of the two heavy metals were below the detection limit which suggests that the plant has a great treatment facility or the industry doesn’t produce high levels of Pb and Cu in their wastewater during production. From the results above the levels of heavy metals in the tea industry cannot be compared quantitatively because the levels were below the detection limit. The concentration on the upstream part is equal to the concentration in the downstream part.
Nevertheless, according to the results the rainy or dry seasons affect the levels of the heavy metals minimally. If maybe the levels of heavy metals could have been high in the dry season these may have shown the great effect of the seasons.
Conclusion
The study was conducted to determine quantitatively the levels of heavy metals in the treated waste water of the rivers of discharge and assess their conformity with standards set by national and international regulatory agencies i.e World Health Organization and National Environment Management Authority. This research disclosed that the two industries have well equipped waste treatment facilities and that their waste water is safe for discharge in the rivers. The results suggest that the water in the rivers is safe for domestic purposes and can be used for irrigation in the nearby farms. The sugar industry should relook at the elimination of Pb in the waste water so that the levels don’t increase in the river of discharge. Otherwise there is no negligence of mishandling industrial effluents in both the two companies.
Recommendations
There should be contribution of efforts to ensure that the concentrations of these contaminants don’t go beyond the limits for human safety and the safety of aquatic biota.
Heavy metals are harmful to the environment hence the industries should ensure complete elimination to avoid serious health effects to human beings and survival of aquatic ecosystem.
According to my conceptual framework;
- To eliminate a metal such as Pb fully there should be treatment and retreatment of the industrial effluents eg primary, secondary and tertiary treatment.
- There should be recycling of the industrial wastewater eg being used in biogas processes.
References
-
Akp OB, Muchie M (2010) Remediation of heavy metals in drinking water and wastewater treatment system: processes and application. International journal of the physical sciences 5(12): 1807-1817.
-
Fernandez LG, Olalla HY (2000) Toxicity and bioaccumulation of lead and cadmium in marine protozoan communities. Ecotoxicology and Environmental safety 47(3): 266-276.
-
Ghosh M, Singh SP (2005) A review on phytoremediation of heavy metals and utilization of its by-products. Applied ecology and environmental research 3(1) : 1-18
-
Kaizer AN, Osakwe SA (2010) Physiochemical characteristics and heavy metal levels in water samples from five river systems in delta state, Nigeria. Journal of application of science and Environmental management 14(1): 83-87.
-
Ogoyi DO, Muita CJ, Nguu EK, Shiundu PM (2011) Determination of heavy metal content in water, sediment and microalgae from lake Victoria, East Africa. The open environmental Engineering Journal 4: 156-161.
-
Robert DS, David ES, Ilya R (1997) Phytoremediation of metals: using plants to remove pollutants from the environment. Current opinion in biotechnology 8(2): 221-226.
-
Saidi M (2010) Experimental studies on effect of heavy metals presence in industrial wastewater on biological treatment. International journal of Environmental sciences 1(4): 666-676.
-
Volesky B (2000) Detoxification of metal-bearing effluent: biosorption for the next century. Hydrometallurgy 59(2- 3): 203-216.
-
World health organization (WHO) (2016) Guideline for drinking water Quality. 4th (Edn.), WHO press Geneva, Switzerland.
-
World health organization (WHO) (2002) World health report: reducing risks, promoting health life: overview.
-
Zinabu GM, Pearce NJG (2003) concentration of heavy metals and related Trace elements in some Ethiopian Rift valley lakes and their inflows. Hydrobiologic 492: 171-178.
- Spectrophotometric Determination of Lanthanum (III) and Some Rare Earths with Xylenol Orange
- Introduction and Sources of Molluscicides
- Trimetazidine: An Antianginal Drug and Not Only!
- Nature Inspired Discovery and Development of Antibacterials: An Update
- Fungal Biodegradation of Polycyclic Aromatic Hydrocarbons (PAHs)
- Recent Approaches of Impurity Profiling in Pharmaceutical Analysis: A Concise Review