The Precision of Research in Three Top Medical Journals
Background: Given widespread agreement about the importance of evidence-based medicine, it is crucial to know the precision of the data in top medical journals. Such research has been performed in psychology with pessimistic findings; but not in medicine. Methods: 30 articles in each of three top medical journals (90 totals) were randomly selected from all articles featuring sample means, using between-participants analyses, and published in 2017. The journals were The New England Journal of Medicine (NEJM), The Journal of the American Medical Association (JAMA), and The Lancet (L). Though not a criterion for selection, most of the articles included an Experiment 1 and an Experiment 2. Results: Article-wise sample means analyses indicate superior precision for medical journals relative to previously published findings from psychology journals (Md < .1 for all medical journals but Md > .2 for all psychology journals). However, NEJM outperformed JAMA and L for more focused experiment-wise analyses involving sample means in Experiment 1 (Md = .12, .17, and .20, respectively) and Experiment 2 (Md = .12, .17, and .21, respectively). Similar results occurred for differences between experimental and control group means (as opposed to the means themselves) in Experiment 1 (Md = .06, 21, and 23, respectively) and Experiment 2 (Md = .06, 21, and 27, respectively). Conclusion: Top medical journals perform well with respect to precision relative to top psychology journals. But there is room for improvement in medical journals too, particularly in JAMA and L.
Introduction
A major trend in the last few decades has been in the direction of evidence-based medicine (EBM), with a strong focus on the quality of evidence [1, 2]. Consider the following quotation by Masic, et al. [2]: The key difference between evidence-based medicine and traditional medicine is not that EBM considers the evidence while the latter does not. Both take evidence into account; however, EBM demands better evidence than has traditionally been used [2].
Although some aspects of “better evidence” are open to interpretation, other aspects are not. An example of the latter is that medical findings should be as precise as possible; hence, the present focus on precision.
Medical researchers often employ experimental methods where sample means or differences between sample means are the main statistic of interest. Under the usual statistical assumptions, larger samples imply that researchers can have increased confidence that sample means are close to corresponding population means. Thus, much experimental medical research includes large sample sizes. But are these sample sizes large enough to engender impressive precision in top medical journals? Based on recently published equations designed specifically to address the precision issue, our goal was to analyze research articles in top medical journals to answer this question.
A typical approach to determining sample sizes is for researchers to perform power analyses. Researchers specify the sizes of the effects they wish to be able to detect and power analyses provide the necessary sample sizes. Although power analyses are helpful for researchers who wish to perform null hypothesis significance tests, power analyses are insufficient for providing researchers with information about how close the sample means to be obtained are to corresponding population means. An alternative approach that serves this latter purpose has been developed recently. It is termed the a priori procedure (APP) [3, 4, 5].
The APP can be used in two ways. First, the researcher can specify the fraction of a standard deviation within which she wishes the sample means to be of the corresponding population means, and the APP provides the necessary sample sizes. Second, the APP can be used in a posteriori fashion. Specifically, for already published articles, where the sample sizes are fixed, the APP can determine the precision with which the sample means estimate corresponding population means. It is this second use of the APP that will be featured here to draw conclusions about the precision of medical research in top journals.
To gain an intuitive understanding of how the APP works, consider a researcher who wishes to use a sample of participants to estimate the mean blood pressure in a population [3]. Suppose that the researcher wishes to have a 95% probability of obtaining a sample mean within one-tenth of a standard deviation of the population value. Equation 1 shows the sample size needed to reach any level of precision , based on the z-score that corresponds to the specified level of probability :
√ . (1) or ( )
Applying Equation 1 to the example, where 95% confidence implies a z-score of 1.96 based on random and independent selection from a normally distributed population, entails that ( . Rounding up to the nearest whole number indicates that the researcher needs to collect 385 participants. Alternatively, suppose that an experiment already has been published with 200 participants. Equation 1 can be used to determine the precision at 95% confidence:
) √ .
The APP can be used with any number of groups, though the mathematics become more complex, as Equation 2 shows [2]. In Equation 2, denotes the number of groups and is the inverse of the cumulative distribution function:
( √ ( ) ) or (
) ( √ ( ) )
( √ ). (2) Despite the increased complexity, Equation 2 can be used to determine the sample size needed in an experiment yet to be performed, but it also can be used to determine the precision of an experiment that has already been published. In this conceptual sense, Equation 2 resembles Equation 1.
Finally, the APP can be applied to differences between means. For example, a researcher might wish to compare the means of treatment and control conditions to determine how well the treatment works. In this case, let designate the number of participants in the smaller group and designate the number of participants in the larger group, where . Numerical integration can be used with Inequation 3 to determine the smallest sample size needed to reach a desired level of precision (i.e., the smallest sample size where Inequation 3 is true):
, (3) √ where is the critical t-score that corresponds to the level of confidence level and degrees of freedom ( ) . Alternatively, Equation 3 can be rearranged to render precision based on the level of confidence one wishes to have and the reported samples sizes of the two conditions.
Methods
The selection included 30 articles from each of the following journals, for a total of 90 articles. These were the New England Journal of Medicine (NEJM), the Journal of the American Medical Association (JAMA), and The Lancet (L), and they were chosen because they are top journals in medicine. All articles analyzed fit the following criteria: they had to use between-participants designs, report means, and have been published in 2017. Article selection from those that met the criteria was random.
Results
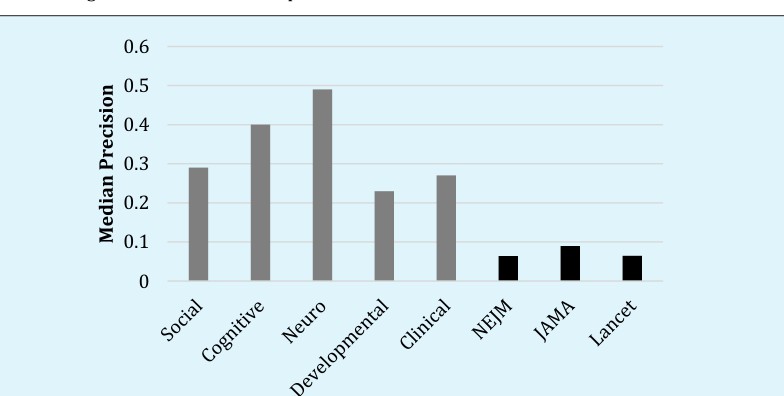
We report three types of precision analyses. First, we report median article-wise precision including all groups in all experiments, making use of the total sample size across all groups in all experiments. The reason for using medians is that precision values tend to be skewed.6 An advantage of article-wise analyses, using Equation 2, is that they facilitate direct comparisons between top medical journals and top psychology journals, the latter being the only scientific field where precision analyses have been conducted.6 Similar to previous research, all analyses performed here assumed a goal of 95% confidence [6].
Relative to the top three psychology journals in social, cognitive, neuro, developmental, and clinical psychology areas, Figure 1 shows that all three medical journals performed well. The median article-wise precision in medical journals was under .1, which is below the arbitrary designation of “excellent” precision (lower values indicate better precision) [7]. A caveat, however, is that the analyses presented in Figure 1 simplify by collapsing across experiments [6].
medical journals. Second, we applied Equation 3 only to experiments with two conditions, to calculate the precision of differences in means, e.g., when researchers compare experimental and control conditions. Using both types of precision analyses, Figure 2 presents median precision values for Experiment 1 and Figure 3 presents median precision values for Experiment 2. Few articles contained more than two experiments so there was no point in going further.
Figure 2 shows how analyses more focused than those performed for Figure 1 differentiate the medical journals. In Experiment 1, where all 30 articles were included for the overall experiment-wise (all means) analyses, NEJM (Md = .12) clearly outperformed JAMA (Md = .17) and L (Md = .20). A similar picture emerged for analyses of differences in means, where NEJM (Md = .06) again outperformed JAMA (Md = .21) and L (Md = .23). The sample size of studies that fit this latter set of analyses was slightly decreased from the 30 total articles from each journal because not all articles employed only two groups where the main comparison was a difference between two crucial means. The number of articles was 24, 26, and 22 from NEJM, JAMA, and L, respectively.
Moving to Experiment 2 and Figure 3, because some researchers only performed one experiment, there were fewer articles for all analyses than for Experiment 1 and Figure 2. For the overall analyses, there were 12, 28, and 17 articles from NEJM, JAMA, and L, respectively. For the analyses of differences between means, there were 10, 23, and 14 articles from NEJM, JAMA, and L, respectively. Like the Experiment 1 findings, NEJM (Md = .12) outperformed JAMA (Md = .17) and L (Md = .21) for the overall experiment-wise analyses. Moving to analyses of differences between means, NEJM (Md = .06) again outperformed JAMA (Md = .21) and L (Md = .27).
Discussion
Figure 1 shows that when article-wise precision is computed, top medical journals are much more precise than top psychology journals. However, the computation of article-wise precision necessitates simplifying assumptions that arguably paint too optimistic a picture of precision in top medical journals (less than .1). Consequently, Figures 2-3 provide more focused analyses. Figure 2 supplies the most trustworthy of the more focused analyses because it included all the articles for experiment-wise precision, and even the analyses of the precision of differences between means contained reasonable article counts. Although NEJM continued to perform well with respect to experiment-wise precision, and perform excellently with respect to the precision of differences between means; the same cannot be said for JAMA, and especially not L. In fact, the expected distances between sample differences in means and population differences in means is 167% more in L than in NEJM. More generally, purely from the standpoint of the precision with which sample means estimate corresponding population means, NEJM can be trusted more than JAMA which, in turn, can be trusted more than L. This conclusion is further supported by Figure 3. And Figures 2-3 both show that the contrast between journals is greater for differences in means than for the means themselves.
Because of the superior precision of NEJM articles relative to JAMA and L, it is tempting to conclude that NEJM is a better journal than JAMA and L. But this is not our goal. Rather, there are many ways to evaluate journals, and the precision of the data is only one criterion. Therefore, we urge researchers to take a nuanced approach to the issue of journal quality, where the precision of the data is only one of the relevant considerations.
In conclusion, although top medical journals are clearly superior to top psychology journals with respect to article-wise precision, JAMA and L perform less well than NEJM when it comes to experiment-wise precision, and especially precision with respect to differences between means. Researchers, reviewers, and journal editors should consider demanding improvements in experiment-wise precision and the precision of differences between means as vehicles to improve medical science, and thereby similarly improve the human condition.
References
-
Evidence-based medicine working group (1992) Evidence based medicine. A new approach to teaching the practice of medicine. JAMA 268: 2420-2425.
-
Masic I, Miokovic M, Muhamedagic B (2008) Evidence based medicine-new approaches and challenges. Acta Inform Med 16(4): 219-225.
-
Trafimow D (2017) Using the coefficient of confidence to make the philosophical switch from a posteriori to a priori inferential statistics. Educ Psychol Meas 77(5): 831-854.
-
Trafimow D, MacDonald JA (2017) Performing inferential statistics prior to data collection. Educ Psychol Meas 77(2): 204-219.
-
Trafimow D, Wang T, Wang C (2019) From a sampling precision perspective, skewness is a friend and not an enemy! Educ Psychol Meas in press 79(1): 129-150.
-
Trafimow D, Myüz HA (2018) The sampling precision of research in five major areas of psychology. Beh Res Methods in press.
-
Trafimow D (2018) An a priori solution to the replication crisis. Phil Psychol 31(8): 1188-1214.
- Systematic Review and Meta-analysis Investigating the Prevalence of Depression, Anxiety, Loneliness and Help seeking among International Students
- Family Experiences and their Interpretations as a Source of Adaptive Behaviour in Young Adults: A Qualitative Model of Adaptive Behaviour
- The Development of Responsibility in Teenage Mothers: A Qualitative Model
- Post-Truth Reality: Worldwide Infodemia and Mental Health Concerns during and Post COVID-19 Pandemic Scenarios
- Psycho-Emotional Rehabilitating Means of Overcoming Extreme and Stressful Impact
- The Paradox of Humbleness, Arrogance and the Concept of Fluid Individuality