Walking Versus Jogging in Patients with Cardiac Problems Including Congestive Heart Failure by Rosalie Roberta Garcia
<p style="text-align: justify;">Congestive heart failure (CHF) is a growing epidemic that affects more than 50% of the world’s population. CHF is a preventable disease, but prevention requires a healthy lifestyle from a young age. Most patients already diagnosed with CHF receive advice and strict instructions for care to prevent further cardiac injury. This quantitative descriptive research study was designed to address walking and jogging as the best exercises for patients diagnosed with CHF and in patients diagnosed with other cardiac problems. The results revealed that walking is the best exercise to improve patients’ resting heart rate and overall cardiac function. This study also indicated that cardiac rehabilitation (CR) improved both blood pressure and heart rate, but the findings showed that CR improved heart rate most effectively. The Levine conservation model served as the foundation of the research. The Levine conservation model ensures the safety and the wholeness of a patient by protecting the interaction and adaptations of the patient’s health care plan and environment through conserving and balancing energy. The social change plan for this research study is to give health care teams who care for patients with CHF or cardiac problems guidance to educate patients about CR. Increasing CR education among all health care teams could help improve many patients’ quality of life, and the autonomy and empowerment given to patients may subsequently increase patients’ cooperation with the treatment plan.</p>
Introduction
Congestive heart failure (CHF) is the largest health disparity in the United States [1]. A health disparity is an incidence, prevalence, mortality or morbidity rate, or burden of disease in a population [1, 2]. CHF is an epidemic and the largest health disparity worldwide [3]. A new diagnosis occurs every 34 seconds and kills more people than all other diagnoses combined [4]. More than half of all patients diagnosed with CHF die within 5 years [4]. CHF is the leading cause of hospital admissions and readmissions and the leading cause of health care debt [1]. CHF occurs when the heart muscles weaken and cannot pump adequate amounts of blood throughout the body [5]. This research study was a quantitative descriptive research study in which the researcher used archival data from patients’ charts. The design is suitable for exploring variable relationships that researchers cannot actively manipulate or control [6]. The study involved conducting a retrospective review of patients’ charts to identify a connection between walking versus jogging and the heart rate (HR), blood pressure (BP), and cardiac output among Nursing & Healthcare International Journal
cardiac rehabilitation (CR) patients. The focus of this study was CHF and prevention, along with methods for CHF diagnosis and the methodology of the research. The research provided more information about CR and exercises that will best improve cardiac function.
Background
Health care for patients with CHF includes a variety of interventions such as medications, in-patient and outpatient hospital care, CR, diet changes and evaluations, weight monitoring, fluid restrictions, and social support. Researchers for the World Health Organization, NHLBI, American Heart Association (AHA), and Healthy People 2020 developed methods for improving the outcomes of CHF and have tried to develop additional preventative measures. Some of the interventions under development include obesity prevention, BP management, smoking cessation, cholesterol management, and diabetes management. CHF affects approximately 24% of African American and Caucasians, 22% of Asians and Pacific Islanders, 20% of Hispanics, and 18% of American Indians and Alaskan Natives [1]. Health care providers recognize CHF as preventable and manageable with compliance and lifestyle changes. Patients, who are physically active, watch their diets, and exercise regularly has a low chance of being diagnosed with CHF [7]. Prevention of the disease is the first goal for improving patients’ health. Patients diagnosed with CHF are at a greater risk of death and complications; however, the disease can be maintained. Patients can prevent further injury to the heart with diet changes, weight loss if indicated, exercising regularly, medications, and CR. CR is an expression that refers to exercising the heart to improve its strength and function. The heart is a muscle that needs exercise to strengthen it, but CR for patients with CHF is difficult and limiting. CHF patients are weaker than patients with a normal functioning heart are. They are usually on multiple medications that make it difficult for them to reach the targeted HR during exercise. CHF patients receive less oxygen perfusion to the muscles throughout their body, which makes the patients weak, and they struggle with breathing because of the extra fluid within their lungs [5]. Most CHF patients are obese, which makes it difficult for them to perform any of the exercises [5]. Many other reasons make it difficult for patient with CHF to perform and comply with CR; however, maintaining and improving their cardiac function is most important for their treatment [8]. Available research has focused on increasing exercise in patients diagnosed with CHF, but few specify the type of exercise [8]. Some research studies include a focus on aerobic versus anaerobic exercises and how they affect patients diagnosed with CHF but few researchers have looked directly at specific types of exercises such as walking, elliptical training, running, and hiking [8].
Purpose of the Study
The purpose of this research was to determine what form of exercise is most beneficial in CR for patients diagnosed with cardiac problems including CHF. Researchers have provided information about CR and its significance in improving cardiac function, but no research has addressed the best types of exercise. I explored walking versus jogging to determine whether a correlation exists between length of time and type of exercise performed. The HR and the length of time the patient exercises were the independent variables, and the EF was the factor for determining cardiac function improvement or lack thereof. HR was the measuring factor used to determine whether the patient was walking or jogging. Walking and jogging are subjective; HR served as the measurement for describing the type of exercise.
Research Design and Approach
The design of this quantitative descriptive study was to correlate the difference in patients’ cardiac function when they walked versus jogged as a form of exercise. The dependent variables included patients diagnosed with CHF, patients diagnosed with other cardiac problems, and cardiac function measured by evaluating the EF. The independent variables were HR, BP, and length of time the patient exercised. HR was the measuring factor to determine if the patient was walking or jogging. Walking and jogging are subjective; the researcher used HR as the method for measurement in describing the type of exercise. HR was used to determine the speed at which the patient was walking or jogging as a set standard of numbers for safety of the patient. The ranges were <120 bpm for walking and ≥120 bpm for the jogging pace. For example, patients who had a HR of 130 bpm were considered to be jogging. The research methods directly aligned to the research questions within this study. For example, patients who had been walking for 30 min a day and who kept the HR at 115 bpm while walking showed either improvement or lack thereof within the EF during reevaluation. This method of evaluating patients was consistent whether patients had a higher or a lower HR while exercising for Nursing & Healthcare International Journal
more than 30 min daily. The categories for patients were HR (<120 bpm and ≥120 bpm), time spent exercising (30- 45 min and 45-90 min), and times a week the patients exercised (1-3 times and 3-7 times). In a patient with a normal heart, jogging for a long period is most beneficial because jogging maintains a higher cardiac output and helps build the cardiac muscle. During exercise, the HR and the BP naturally increase, which improves cardiac output and the cardiac muscle. This study determined if the results were the same in patients with CHF. The research design included archival data to evaluate BP, HR, and EF in relation to the time the patients exercised and how high they maintained their HR during exercise. The purpose of this research design choice was to compare how different exercises (walking versus jogging) could affect a heart in heart failure by comparing the time patients exercised with the intensity (HR and BP) and the ways it played a role in the EF of the heart muscle. Multivariate analysis in IBM SPSS was suitable for interpreting the data to give measures of the relationship between the categorical dependent variables and the independent variables [9]. Multivariate data analysis refers to the evaluation of multiple variable analysis [9]. The multivariate analysis of variance (MANOVA) through SPSS generates case processing summary, dependent variable encoding, categorical variable codes, classification table, variables not in the equation, an omnibus test of model coefficients, model summary, variables in the equation, and ANOVA tables [9]. The study included both MANOVA and multivariate analysis of covariance (MANCOVA) to test the hypotheses, which helped ensure the adequate evaluation of the data with the correct number of samples [10]. To ensure a research study is accurate and reliable, researchers can evaluate the validity and reliability of the data frequently [11]. Internal validity is a measure that ensures a researcher’s experimental design closely follows the principle of cause and effect [11]. In contrast, external validity usually includes two distinct types: population validity and ecological validity. The population and ecologoical validity are both essential elements in judging the strength of an experimental design [11]. G*Power analysis was suitable for calculating the necessary sample size based on a number of participant assumptions. The G*Power analysis indicated a sample size of 721 participants would give the best results for the study. In previous research studies, the average sample size was 150-200; however, the facility that the researcher obtained the archival data from has only been open since 2013. Thus, only 50 patient charts met the criteria of patients diagnosed with CHF. Due to the low number of participants, this research study was changed to a quantitative descriptive research study with two comparison dependent variables added for an increased N value. The original comparison dependent variable was the patient diagnosed with CHF and the other variable was patients diagnosed with other cardiac problems; however, there were not enough CHF patient retrospective data to give a valid analysis, so the analysis was evaluated as a combination of patients diagnosed with other cardiac problems including CHF. The study included multiple dependent variables and independent variables to achieve a more in-depth analysis to answer the research questions. The MANOVA and MANCOVA analysis allowed all dependent and independent variables to be grouped, compared, and separated for further analysis. MANOVA analysis accentuates the “mean differences and statistical significance of differences among groups” [12] and MANCOVA reveals if there are “statistically significant mean differences among groups after adjusting the newly created dependent variables (DV) for differences on one or more covariates” [12]. MANOVA was more suitable than analysis of variance (ANOVA) because of the multiple dependent variables used to prevent Type I errors related to running multiple tests correlated to dependent variables [12]. MANOVA can potentially reveal differences not exposed in an ANOVA [12]. MANOVA has one or more independent variables and two or more dependent variables, with two or more levels for each topic within the different combinations of independent variables [12]. An example might include evaluating patients diagnosed with CHF, other cardiac problems, and pre-CR EF as the dependent variables and HR, EF, and BP as the independent variables pre-CR and again post-CR. Running the MANOVA and MANCOVA analysis decreased any probability of error and gave the best results to the research questions. The first objective when gathering the participants was to find individuals diagnosed with CHF. They could have experienced some form of acute myocardial infarction, multiple vessel disease, 50% vessel occlusion, or cardiac bypass. The second objective was the subjects were physically able to walk or jog. The third objective was subjects were over the age of 18. The fourth objective was subjects had participated in or were participating in a CR program. The objectives listed served to ensure the safety of the participants and the validity of the research.
Nursing & Healthcare International Journal
Appendix B includes further review of the facility consent letter that allowed me to gather archival data for research purposes. All the data were archival but it was still important to follow procedures so that the health care provider continued to ensure the safety of the participants. The guidelines also helped to narrow the large amount of data provided to ensure the participants selected for this research were correct.
RQ1 was as follows: Does less intensive exercise (HR < 120 bpm) produce greater improvement in BP, HR, and EF than more intensive exercise (HR ≥ 120 bpm)? The first step was to divide the data into two groups based on the spreadsheet variable HR during exercise (post). The groups consisted of those with less intensive exercise (HR < 120 bpm; N = 166) and those with more intensive exercise (HR ≥ 120 bpm; N = 62). Table 1 includes a description of all participants’ mean scores and standard deviations.
- Results
- Research Question 1
- No. with
- No. other
- Number completing
- CR sessions
- Treadmill time
- Treadmill time
- (min) initial
- (min) (post) exercising
- CHF cardiac program
- M
- SD
- M
- SD
- M
- SD
- M
- SD
- M
- SD
- 113
- 228
- 138
- 13.6 8.74 14.1
- 11.43
- 27.8
- 6.04
- 30.2
- 2.25
- 3.3
- 0.79
Table 1: Description of Sample.
| HR < 120 bpm | HR ≥ 120 bpm | Total | |||||||||||||||||||||||||
|---|---|---|---|---|---|---|---|---|---|---|---|---|---|---|---|---|---|---|---|---|---|---|---|---|---|---|---|
| M | N | SD | M | N | SD | M | N | SD | |||||||||||||||||||
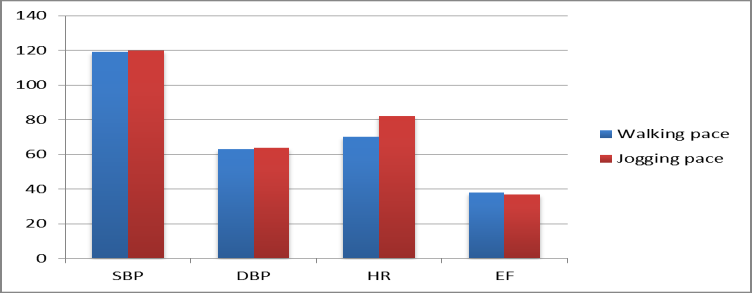
| Post-CR resting systolic BP | 118.63 | 166 | 18.671 | 119.27 | 62 | 14.125 | 118.8 | 228 | 17.524 | ||||||||||||||||||
| Post-CR resting diastolic BP | 64.38 | 166 | 9.63 | 665.4 | 62 | 8.838 | 64.66 | 228 | 9.413 | ||||||||||||||||||
| Post resting HR | 72.34 | 166 | 10.906 | 82.87 | 62 | 12.337 | 75.21 | 228 | 12.223 | ||||||||||||||||||
| Post-CR EF | 37.33 | 39 | 13.56 | 36.25 | 8 | 13.296 | 37.14 | 47 | 13.378 |
Table 2: Comparison of Post-Cardiac Rehabilitation Means by Dependent Variable and Group. Note: HR, heart rate; CR, cardiac rehab
Table 2: Comparison of Post-Cardiac Rehabilitation Means by Dependent Variable and Group. Note: HR, heart rate; CR, cardiac rehabilitation; BP, blood pressure; EF, ejection fraction Rather than perform four separate t tests (one for each dependent variable), which would increase the probability of Type-I error, a problem called experiment wise error or per-comparison error, the best approach was to perform a MANOVA to examine differences across the two groups for all four dependent variables simultaneously, thereby holding Type I error constant [12].
Nursing & Healthcare International Journal
Table 3 shows results of the MANOVA that involved comparing the difference between the two groups (low versus high intensity) across the four dependent
| Effect | Value | F | Hypothesis df | Error df | Sig. | ||||||||||||
|---|---|---|---|---|---|---|---|---|---|---|---|---|---|---|---|---|---|
| Intercept | |||||||||||||||||
| Pillai's trace | 0.991 | 1162.017 | 4 | 42 | 0 | ||||||||||||
| Wilks' lambda | 0.009 | 1162.017 | 4 | 42 | 0 | ||||||||||||
| Hotelling's trace | 110.668 | 1162.017 | 4 | 42 | 0 | ||||||||||||
| Roy's largest root | 110.668 | 1162.017 | 4 | 42 | 0 | ||||||||||||
| Group | |||||||||||||||||
| Pillai's trace | 0.322 | 4.986 | 4 | 42 | 0.002 | ||||||||||||
| Wilks' lambda | 0.678 | 4.986 | 4 | 42 | 0.002 | ||||||||||||
| Hotelling's trace | 0.475 | 4.986 | 4 | 42 | 0.002 | ||||||||||||
| Roy's largest root | 0.475 | 4.986 | 4 | 42 | 0.002 |
Table 3: Multivariate Results—Comparison of Systolic Blood Pressure, Diastolic Blood Pressure, Heart Rate, and Ejection Function
Table 3: Multivariate Results—Comparison of Systolic Blood Pressure, Diastolic Blood Pressure, Heart Rate, and Ejection Function by Group. Table 4 shows the results of group comparisons for each of the four dependent variables. As shown, the results for group were significant (p < .05) for two of the four dependent variables: diastolic blood pressure (DBP) and HR. Thus, the mean DBP and HR values for the low- intensity group were significantly lower than those for the high-intensity group, as indicated by the mean values shown in Table 2. The R-squared values for these two significant effects were .073 and .211, respectively. Thus, the effect of exercise on HR was greater than that of DBP. A summary of the results is as follows: Systolic blood pressure (SBP): F (1, 45) = 3.31, p > .05; R_2 = .048 DBP: _F (1, 45) = 4.60, p < .05; R_2 = .073 HR: _F (1, 45) = 13.33, p < .01; R_2 = .211 EF: _F (1, 45) = 0.04, p > .05; _R_2 = .001
Research Question 2
RQ2 was as follows: Does CR improves HR, BP, and EF? Solving this research question involved assessing the benefits of CR on three variables: BP (SBP, DBP), HR, and EF. The general analytic approach was to compare baseline levels of each variable (pre-CR) with levels derived after CR (post-CR) using MANCOVA [12]. For each of the variables entered into the model (BP, HR and EF), the dependent variable was the post-CR value for each, and the pre-CR was a covariate. Thus, any change in the dependent variable beyond that of the pre-CR levels would show up as a significant effect of group.
| Source and dependent variable | Type III sum of squares | df | Mean square | F | Sig. | ||||||||||||
| Corrected model | |||||||||||||||||
| Post-CR resting SBP | 733.213a | 1 | 733.213 | 3.313 | 0.075 | ||||||||||||
| Post-CR resting DBP | 337.604b | 1 | 337.604 | 4.603 | 0.037 | ||||||||||||
| Post-resting HR | 1412.411c | 1 | 1412.411 | 13.334 | 0.001 | ||||||||||||
| Post-CR EF | 7.717d | 1 | 7.717 | 0.042 | 0.838 | ||||||||||||
| Intercept | |||||||||||||||||
| Post-CR resting SBP | 381539.171 | 1 | 381539.171 | 1723.803 | 0 | ||||||||||||
| Post-CR resting DBP | 113257.434 | 1 | 113257.434 | 1544.274 | 0 | ||||||||||||
| Post-resting HR | 177811.645 | 1 | 177811.645 | 1678.676 | 0 | ||||||||||||
| Post-CR EF | 35938.1 | 1 | 35938.1 | 196.628 | 0 | ||||||||||||
| Group | |||||||||||||||||
| Post-CR resting SBP | 733.213 | 1 | 733.213 | 3.313 | 0.075 | ||||||||||||
| Post-CR resting DBP | 337.604 | 1 | 337.604 | 4.603 | 0.037 | ||||||||||||
| Post-resting HR | 1412.411 | 1 | 1412.411 | 13.334 | 0.001 | ||||||||||||
| Post-CR EF | 7.717 | 1 | 7.717 | 0.042 | 0.838 | ||||||||||||
| Error | |||||||||||||||||
| Post-CR resting SBP | 9960.106 | 45 | 221.336 | ||||||||||||||
| Post-CR resting DBP | 3300.311 | 45 | 73.34 | ||||||||||||||
| Post-resting HR | 4766.567 | 45 | 105.924 | ||||||||||||||
| Post-CR EF | 8224.739 | 45 | 182.772 | ||||||||||||||
| Total | |||||||||||||||||
| Post-CR resting SBP | 647541 | 47 | |||||||||||||||
| Post-CR resting DBP | 189929 | 47 | |||||||||||||||
| Post-resting HR | 284996 | 47 | |||||||||||||||
| Post-CR EF | 73079.64 | 47 | |||||||||||||||
| Corrected total | |||||||||||||||||
| Post-CR resting SBP | 10693.319 | 46 | |||||||||||||||
| Post-CR resting DBP | 3637.915 | 46 | |||||||||||||||
| Post-resting HR | 6178.979 | 46 | |||||||||||||||
| Post-CR EF | 8232.456 | 46 | |||||||||||||||
Table 4: Tests of Between-Subjects Effects. a_R_-squared = .069 (adjusted _R_-squared = .048). b_R_-squared = .093 (adjusted _R_-
Nursing & Healthcare International Journal
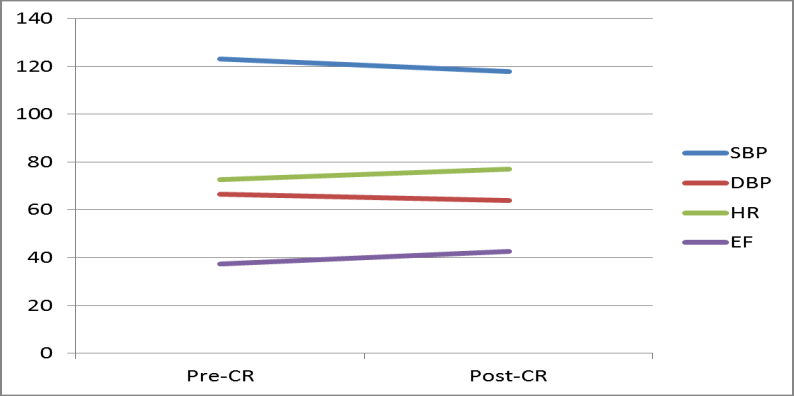
Table 4: Tests of Between-Subjects Effects. a_R_-squared = .069 (adjusted R-squared = .048). b_R_-squared = .093 (adjusted R-squared = .073). c_R_-squared = .229 (adjusted R-squared = .211. d_R_-squared = .001 (adjusted R-squared = -.021). Table 5 shows means from pre- to post-CR phases for each of the four dependent variables. SBP, DBP and EF showed favorable change, whereas HR showed an increase. A discussion on the statistical significance of these changes appears below. Information about how the exercise intervention affected the dependent variables pre- and post-CR appears in Figure 2.
| Pre-CR | Post-CR | |||||||||||||
|---|---|---|---|---|---|---|---|---|---|---|---|---|---|---|
| Variable | M | SD | M | SD | ||||||||||
| Systolic blood pressure (SBP) | 122.8 | 19.78 | 118.8 | 17.52 | ||||||||||
| Diastolic blood pressure (DBP) | 66.2 | 10.41 | 64.7 | 9.41 | ||||||||||
| Heart rate (HR) | 72.9 | 13.12 | 75.2 | 12.22 | ||||||||||
| Efficiency function (EF) | 33.8 | 10.4 | 37.5 | 13.68 |
Table 5: Pre-Cardiac Rehabilitation and Post-Cardiac Rehabilitation for All Four Dependent Variables _Note. N_ = 228.
Nursing & Healthcare International Journal
Multivariate results (Table 6) indicated significance (p < .05) for all variables except DBP. The results of pre-CR and post-CR comparisons appear in Table 7. Again, all but DBP indicated significant and favorable change, with HR showing significant increase, which does not seem favorable.
| Effect | Value | F | Hypothesis df | Error df | Sig. | ||||||||||||
| Intercept | |||||||||||||||||
| Pillai's trace | 0.375 | 5.251 | 4 | 35 | 0.002 | ||||||||||||
| Wilks' lambda | 0.625 | 5.251 | 4 | 35 | 0.002 | ||||||||||||
| Hotelling's trace | 0.6 | 5.251 | 4 | 35 | 0.002 | ||||||||||||
| Roy's largest root | 0.6 | 5.251 | 4 | 35 | 0.002 | ||||||||||||
| Pre CR Resting SBP | |||||||||||||||||
| Pillai's trace | 0.43 | 6.606 | 4 | 35 | 0 | ||||||||||||
| Wilks' lambda | 0.57 | 6.606 | 4 | 35 | 0 | ||||||||||||
| Hotelling's trace | 0.755 | 6.606 | 4 | 35 | 0 | ||||||||||||
| Roy's largest root | 0.755 | 6.606 | 4 | 35 | 0 | ||||||||||||
| Pre CR Resting DBP | |||||||||||||||||
| Pillai's trace | 0.217 | 2.425 | 4 | 35 | 0.066 | ||||||||||||
| Wilks' lambda | 0.783 | 2.425 | 4 | 35 | 0.066 | ||||||||||||
| Hotelling's trace | 0.277 | 2.425 | 4 | 35 | 0.066 | ||||||||||||
| Roy's largest root | 0.277 | 2.425 | 4 | 35 | 0.066 | ||||||||||||
| Pre CR Resting HR | |||||||||||||||||
| Pillai's trace | 0.55 | 10.697 | 4 | 35 | 0 | ||||||||||||
| Wilks' lambda | 0.45 | 10.697 | 4 | 35 | 0 | ||||||||||||
| Hotelling's trace | 1.222 | 10.697 | 4 | 35 | 0 | ||||||||||||
| Roy's largest root | 1.222 | 10.697 | 4 | 35 | 0 | ||||||||||||
| PreCREF | |||||||||||||||||
| Pillai's trace | 0.31 | 3.935 | 4 | 35 | 0.01 | ||||||||||||
| Wilks' lambda | 0.69 | 3.935 | 4 | 35 | 0.01 | ||||||||||||
| Hotelling's trace | 0.45 | 3.935 | 4 | 35 | 0.01 | ||||||||||||
| Roy's largest root | 0.45 | 3.935 | 4 | 35 | 0.01 |
Table 6: Multivariate Results for Pre- Versus Post-Cardiac Rehabilitation Comparison on Systolic Blood Pressure, Diastolic Blood
Table 6: Multivariate Results for Pre- Versus Post-Cardiac Rehabilitation Comparison on Systolic Blood Pressure, Diastolic Blood Pressure, Heart Rate, and Efficiency Function R-squared values (effect sizes) indicated that EF and HR showed larger effects, with HR largest. Summaries of these data were as follows: SBP: F (1, 38) = 6.83, p < .05; R2 = .075 DBP: F (1, 38) = 2.65, p > .05; R_2 = .023 HR: _F (1, 38) = 44.59, p < .01; R_2 = .540 EF: _F (1, 38) = 13.93, p < .01; _R_2 = .325
Nursing & Healthcare International Journal
| Source | Dependent variable | Type III sum of squares | d | f | Mean square | F | Sig. | |||||||||||||
| Post-CR resting SBP | 1395.519a | 4 | 348.88 | 1 | .849 | 0.14 | ||||||||||||||
| Post-CR resting DBP | 378.238b | 4 | 94.56 | 1 | .243 | 0 | .30 | 9 | ||||||||||||
| Corrected model | ||||||||||||||||||||
| Post-resting HR | 3456.961c | 4 | 864.24 | 1 | 3.31 | 0 | ||||||||||||||
| Post-CR EF | 3062.869d | 4 | 765.717 | 6 | .061 | 0 | .00 | 1 | ||||||||||||
| Post-CR resting SBP | 3705.011 | 1 | 3705.011 | 1 | 9.63 | 0 | ||||||||||||||
| Post-CR resting DBP | 948.876 | 1 | 948.876 | 1 | 2.47 | 0 | .00 | 1 | ||||||||||||
| Intercept | ||||||||||||||||||||
| Post-resting HR | 294.459 | 1 | 294.459 | 4 | .535 | 0.04 | ||||||||||||||
| Post-CR EF | 48.785 | 1 | 48.785 | 0 | .386 | 0 | .53 | 8 | ||||||||||||
| Pre CR resting SBP | Post-CR resting SBP | 1289.239 | 1 | 1289.239 | 6 | .831 | 0 | .01 | 3 | |||||||||||
| Pre CR resting DBP | Post-CR resting DBP | 201.977 | 1 | 201.977 | 2 | .654 | 0 | .11 | 2 | |||||||||||
| Pre CR resting HR | Post-resting HR | 2895.144 | 1 | 2895.144 | 4 | 4.59 | 0 | |||||||||||||
| Pre CR EF | Post-CR EF | 1759.722 | 1 | 1759.722 | 1 | 3.93 | 0 | .00 | 1 | |||||||||||
| Post-CR resting SBP | 7171.922 | 3 | 8 | 188.735 | ||||||||||||||||
| Post-CR resting DBP | 2891.529 | 3 | 8 | 76.093 | ||||||||||||||||
| Error | ||||||||||||||||||||
| Post-resting HR | 2467.086 | 3 | 8 | 64.923 | ||||||||||||||||
| Post-CR EF | 4800.454 | 3 | 8 | 126.328 | ||||||||||||||||
| Post-CR resting SBP | 583932 | 4 | 3 | |||||||||||||||||
| Post-CR resting DBP | 172052 | 4 | 3 | |||||||||||||||||
| Total | ||||||||||||||||||||
| Post-resting HR | 265046 | 4 | 3 | |||||||||||||||||
| Post-CR EF | 68204.64 | 4 | 3 | |||||||||||||||||
| Post-CR resting SBP | 8567.442 | 4 | 2 | |||||||||||||||||
| Post-CR resting DBP | 3269.767 | 4 | 2 | |||||||||||||||||
| Corrected total | ||||||||||||||||||||
| Post-resting HR | 5924.047 | 4 | 2 | |||||||||||||||||
| Post-CR EF | 7863.323 | 4 | 2 |
Table 7: Results of Pre- and Post-Cardiac Rehabilitation Comparisons. aR-squared = .163 (adjusted R-squared = .075). bR-squared =
Interpretation of the Findings
| CR had was improving the resting HR. Ulbrich et al. (2016) [13] noted that they based their exercise intensity | Ulbrich et al. | ||
|---|---|---|---|
| (2016) | noted that they based their exercise intensity | ||
| on HR acquired by the ergometric test, which aligned well | |||
| with the findings of this research study. |
kept the HR < 120 bpm, which provided greater improvement in cardiac function than keeping the HR at ≥120 bpm. The theory behind this finding was that maintaining the cardiac output at a moderate rate improves cardiac perfusion, which improves cardiac muscle function. Improved cardiac muscle function will increase cardiac output into the body so patients generate and conserve energy for maintaining the aerobic exercise and the time needed for completion. The analysis led to the conclusion that walking leads to greater improvement in cardiac function. In a similar research study, Ulbrich, et al. (2016) [13] revealed that high-intensity exercises are an option for patients diagnosed with CHF and that there Nursing & Healthcare International Journal
are still loopholes regarding the protocol for which exercises are optimal. Ulbrich, et al. [13] revealed three components of quality of life as having the most influence on CR: performing physical and social activities, maintaining happiness, and engaging in fulfilling relationships.
Limitations of the Study
The limitations to CR are patient participation and following the treatment plan. The lifestyle changes can be dramatic, depending on how the patient is currently living life. Another limitation is the medications that patients take and patients’ ability to maintain a moderate HR level during exercise. Many of the medications given to decrease BP also decrease HR as a side effect.
Conclusion
In summary, keeping the HR <120 bpm (walking pace) during exercise will give the greatest improvement in patients diagnosed with CHF or other cardiac problems. HR emerged as the best method for defining the intensity of exercise. CR is important for improving cardiac function, as shown in many research studies. One of the major complications in CR is ensuring patient compliance. With the use of the Levine conservation model, patient compliance could increase because it will help patients actively participate while maintaining their dignity. The Levine conservation model is designed to promote adaptation and maintain wholeness by involving four principles of conservation: conservation of energy, conservation of structural integrity, conservation of personal integrity, and conservation of social integrity [14]. This research study concludes with the knowledge that walking for 30 minutes 3 times a week while keeping the HR <120 bpm gives greater improvement to overall cardiac function in patients diagnosed with cardiac problems, including CHF. This research study also included discussions on the importance of patient compliance and cooperation and on the meaning of exercising for improving and maintaining cardiac health.
References
-
Centers for Disease Control and Prevention (2014a) Heart failure fact sheet.
-
National Heart, Lung, and Blood Institute (2014) Morbidity and mortality: 1998 chart- book on cardiovascular, lung, and blood diseases. Bethesda, MD: Public Health Service.
-
World Health Organization (2013) Cardiovascular diseases.
-
Go AS, Mozaffarian D, Roger VL, Benjamin EJ, Berry JD, et al. (2013) Heart disease and stroke statistics— 2013 update: A report from the American Heart Association. Circulation 127(1): e6-e245.
-
Lewis S (2014) Medical-surgical nursing: Assessment and management of clinical problems 9th (Edn.), Maryland Heights, MO: Elsevier/Mosby.
-
Creswell J (2014) Qualitative, quantitative, and mixed methods approaches 4th (Edn.), Thousand Oaks, CA: Sage.
-
American Heart Association (2014a) Heart Disease and Stroke Statistics—2009 Update A Report From the American Heart Association Statistics Committee and Stroke Statistics Subcommittee Circulation 119.
-
American Heart Association (2014d) What is cardiac rehabilitation.
-
PASW Statistics (2015) Graduate pack. San Ramon, CA: PASW, Inc.
-
Fox N, Hunn A, Mathers N (2009) Sampling and sample size calculation. Nottingham, England: National Institute for Health Research pp: 1-4.
-
Frankfort Nachmias C, Nachmias D (2008) Research methods in the social sciences 7th (Edn.), New York, NY: Worth.
-
Tabachnick BG, Fidell LS (2013) Using multivariate statistics 6th (Edn.), Boston MA: Pearson, pp: 983.
-
Ulbrich AZ, Angarten VG, Netto AS, Sties SW, Bündchen DC, et al. (2016) Comparative effects of high intensity interval training versus moderate intensity continuous training on quality of life in patients with heart failure: Study protocol for a randomized controlled trial. Clinical Trials and Regulatory Science in Cardiology 13: 21-28.
-
Fawcett J (2014) Thoughts about conceptual models, theories and quality improvement projects. Nurs Sci Q 27(4): 336-339.
- Teaching Cognitive Behavioral Therapy to Graduate Psychiatric Mental Health Nurse Practitioner Students: Utilizing A Mixed Methods Course Evaluation
- The Role of Pharmacogenetic Testing in Clinical Practice: A Path toward more Effective, Personalized and Cost-effective Care
- Implementing Screening with the GAD-7 in an Outpatient Mental Health Setting: A Quality Improvement Project
- Social Media and Health Promotion
- Impact of Covid-19 Pandemic on the Academic Performance and Attitude of Nursing Students towards E-Learning
- A Study to Assess the Knowledge Regarding Ill Effects of Tobacco Consumption on Health among Adolescents in Selected Higher Secondary School in Nadiad City