Construct Validity of the Two Safety Culture Questionnaires
Objective: The aim of the study was to validate the construct of two culture assessment instruments adapted and validated for the Portuguese language, the Safety Attitudes Questionnaire (SAQ) and the Hospital on Patient Safety Culture (HSOPSC). Material and Methods: Cross-sectional, exploratory-descriptive study with quantitative approach. The two instruments were applied at the same time to all professionals working in intensive care units that met the inclusion criteria: working at least 20 hours per week and at least one month in the sector. Results: 170 questionnaires were distributed and 127 were considered valid for the research. The professionals that participated in the study, 60 (75%) were female, most had between 1 and 5 years of time in unit 40 (50%), with institution 39 (49%) and workload between 20 and 39 hours per week 32 (40%). Still, 69 (86.3%) reported having direct contact with the patient. Regarding the validation results, we observed positive and statistically significant correlations between SAQ domains with four HSOPSC domains. In the regression analysis, all domains of the SAQ, except for Stress Perception, explained all the variables resulting from HSOPSC. Conclusion: Based on this study it was concluded that both instruments are valid and reliable for the evaluation of safety culture. However, it is worth emphasizing that the two instruments present factors that facilitate and hinder the application of the same.
Introduction
Safety culture is increasingly recognized as an important strategy and precursor needed to improve patient safety. According to the United States Institute of Medicine, safety culture can be defined as an individual and organizational behavior that continually seeks to establish a commitment to the safety and quality of services provided [1]. The first step in implementing an institution's safety culture is to evaluate it. Assessing safety culture in health facilities can reveal conditions in a work environment that lead to adverse events. This evaluation can be performed soon after interventions aimed at patient safety and as a method of monitoring the effectiveness of these interventions, in addition to increasing the awareness of professionals and patients about safety issues.
In Brazil, there are two safety culture assessment instruments translated and adapted for the Portuguese language, the Safety Attitude Questionnaire (SAQ) and the Hospital on Patient Safety Culture (HSOPSC). These two instruments are the most applied in the world for this purpose, as well as being the only safety culture evaluation instruments translated and adapted to the Portuguese language [2, 3, 4]. SAQ was built in the United States by researchers at the University of Texas, Center of Excellence for Patient Safety and has been applied in more than 500 hospitals in the United States, United Kingdom and New Zealand. This instrument has 41 items distributed on a single page and measures the perception of health professionals through six domains: Team Work Climate, Safety Climate, Job Satisfaction, Stress Perception, Management Perception, Working Conditions [2]. HSOPSC was developed and made available by the US Agency for Research and Quality of Health (AHRQ) in 2004 [5] and translated and validated for Brazil in 2013 [4], and organizational norms, reporting of adverse events, communication, supervision and management. The HSOPSC contains 50 items distributed in 12 points in item scale [5]. Since the items were written in both directions as positive and negative, the written items were partially reversed. The validation process of a validation instrument during cross-cultural adaptation concluded that, unlike the validation process, the evidence was repeated at various times, evidencing the importance of a continuous evaluation of the instruments, since the two are reference tools for assessing safety culture. Construct validity is based on what is really thought about the median measures. The necessary evidence for this type of evaluation can be obtained from the internal analysis of the instrument, through confirmatory factor analysis, internal consistency and its correlations with other testicles, by the preference that they are accepted as construct measures. The higher the correlations are, the more the test will be the measurement sense of the construct in question [6]. Given the availability of two instruments in the Portuguese language that evaluates the same construct, but with different characteristics, which seeks to answer as the main research questions: Is the SAQ domain convergent to the same constructs and evaluated by the HSOPSC domains? As predictive variables (domains) they explained as a result. In this sense, the Safety Study Questionnaire (SAQ) and the Hospital on Patient Safety Culture (HSOPSC).
Materials and Methods
Cross-sectional, exploratory-descriptive study with quantitative measures in intensive care units of two hospitals in Brazil. The hospitals that participated in the study were part of a larger study evaluating the culture of Brazilian hospitals [7]. The construct validation handles, the two instruments were distributed to all individuals working in the intensive care units of the hospitals participating in the study, corresponding to a sample of 170 professionals. However, 127 returned the completed instruments. The study included nurses, physicians, nursing assistants, physiotherapists, nutritionists, psychologists, pharmacists and social workers who met the inclusion criteria: less than 20 hours a week and less than a month in the sector. Data were collected through the Safety Attitude Questionnaire (SAQ) and the Hospital on Patient Safety Culture (HSOPSC), both translated and validated for Brazil, as well as a sociodemographic characterization form. One answer to each question is a 5-point scale, including the final variation of 100, with a cut-off point of 752. The HSOPSC covers 12 dimensions of the safety culture in various sizes. It contains 50 items in total; 44 are related to safety culture and 6 items are related to personal information [4]. The study participants signed and received the Informed Consent Term. The instruments were filled in the working environment available on paper. The study was approved by the Ethics Committee of the institutions and has protocol number 985.564. All participants in the study signed the informed consent form and were guaranteed anonymity. The collected data were inserted into a database and then processed in the R software. Each questionnaire had its results converted into scores according to the value established for each option. To make this comparison possible, the HSOPSC scores were normalized according to the SAQ score. The calculation of the Intraclass Correlation Coefficient (ICC) was applied to evaluate the correlation between the domains, and the mixed two way model was chosen, with a 95% confidence interval. The interpretation of ICC values was based on the scale of values suggested by Menz, et al. [8, 9], which are: greater than 0.75 are considered excellent; values between 0.40-0.75 are moderate and / or satisfactory and values below 0.40 are unsatisfactory. The reliability of the instruments was measured by Cronbach's alpha and was considered 0.69, the lower limit generally accepted in exploratory research. To understand how much each predictive variable (domains) explained the outcome variables, the Regression Analysis was performed. The following variables were considered: Number of events reported in the last 12 months (Section D), Patient Safety Grade (Section E) and Overall Perceptions of Patient Safety (A10, A15, A17 e A18).
Results
For the validation of construct, the two instruments were applied at the same time, being answered by 127 professionals. Of these, 68 (75%) professionals were female, with 1 to 5 years of time in unit 59 (46.5%) and with a workload of 20 to 60 hours per week 99 (60%). Still, 115 (90.6%) professionals reported having direct contact with the patient (Table 1).
| Variable | n | % | |||||||||||||
|---|---|---|---|---|---|---|---|---|---|---|---|---|---|---|---|
| female | 68 | 75 | |||||||||||||
| male | 54 | 22,5 | |||||||||||||
| Gender | |||||||||||||||
| missing data | 5 | 2,5 | |||||||||||||
| Total | 127 | 100 | |||||||||||||
| Less than 1 year | 27 | 21,3 | |||||||||||||
| 1 to 5 years | 59 | 46,5 | |||||||||||||
| 6 to 10 years | 23 | 18,1 | |||||||||||||
| How long have you worked in your current hospital work area/unit | 11 to 15 years | 9 | 7,1 | ||||||||||||
| 16 to 20 years | 4 | 3,1 | |||||||||||||
| 21 years or more | 5 | 3,9 | |||||||||||||
| Total | 127 | 100 | |||||||||||||
| Less than 20 hours per week | 8 | 6,3 | |||||||||||||
| 20 to 39hours per week | 50 | 39,4 | |||||||||||||
| 40 to 59 hours per week | 49 | 38,6 | |||||||||||||
| 60 to 79 hours per week | 13 | 10,2 | |||||||||||||
| Hours per week | |||||||||||||||
| 80 to 99 hours per week | 2 | 1,6 | |||||||||||||
| 100 hours per week or more | 2 | 1,6 | |||||||||||||
| missing data | 3 | 3,8 | |||||||||||||
| Total | 127 | 100 | |||||||||||||
| Yes | 115 | 90,6 | |||||||||||||
| No | 7 | 5,5 | |||||||||||||
| Interaction or contact with patient | |||||||||||||||
| Missing data | 5 | 3,9 | |||||||||||||
| Total | 127 | 100 | |||||||||||||
| As for the general scores of the two instruments, mean | responses, that is, responses above 50% of partially and | ||||||||||||||
| values ranged from 50 to 74.1 (SAQ) and 42.8 to 60.9 | totally agree for each domain. According to this criterion, | ||||||||||||||
| (HSOPS). For the SAQ, it is expected for a positive safety | five of the ten HSOPSC domains presented positive | ||||||||||||||
| culture, scores above 75, thus considering that instrument | responses> 50%, indicating that they are strong factors | ||||||||||||||
| was not observed any domain with scores above this | and are present in the safety culture in the studied unit | ||||||||||||||
| value. However, for the HSOPSC we consider positive | (Table 2). |
| Positive | Cronbach | ||||||||||||||||
|---|---|---|---|---|---|---|---|---|---|---|---|---|---|---|---|---|---|
| Patient Safety Culture Composite | mean | SD* | |||||||||||||||
| porcetagem* | Alfa | ||||||||||||||||
| HSOPSC | Supervisors/managers consider staff suggestions for Actions Promoting Patient Safety | 42.8 | 14.6 | 61 | 0.76 | ||||||||||||
| HSOPSC | Organizational Learning—Continuous Improvement | 60.9 | 17.7 | 57 | 0.51 | ||||||||||||
| HSOPSC | Teamwork within Units | 57.8 | 17.5 | 53 | 0.68 | ||||||||||||
| HSOPSC | Feedback and Communication About Error | 52.8 | 20.3 | 50 | 0.51 | ||||||||||||
| HSOPSC | Communication Openness | 51.2 | 15.8 | 51 | 0.62 | ||||||||||||
| HSOPSC | Nonpunitive Response to Error | 60.5 | 17 | 17 | 0.37 | ||||||||||||
| HSOPSC | Management Support for Patient Safety | 48.8 | 15.6 | 48 | 0.65 | ||||||||||||
| HSOPSC | Handoffs and Transitions | 43.7 | 20.5 | 44 | 0.78 | ||||||||||||
| HSOPSC | Teamwork Across Units | 70 | 17.3 | 36 | 0.71 | ||||||||||||
| HSOPSC | Staffing | 49.3 | 15.6 | 46 | 0.33 | ||||||||||||
| SAQ | Teamwork Climate | 50 | 11.9 | 77 | 0.71 | ||||||||||||
| SAQ | Safety Climate | 62.4 | 17.6 | 56.2 | 0.65 | ||||||||||||
| SAQ | Job satisfaction | 74.1 | 17.9 | 70 | 0.73 | ||||||||||||
| SAQ | Stress recognition | 72.9 | 27.2 | 73 | 0.84 | ||||||||||||
| SAQ | Perceptions of management units | 50.1 | 22 | 31 | 0.8 | ||||||||||||
| SAQ | Perceptions of management hospital | 53.7 | 24 | 40 | 0.74 | ||||||||||||
| SAQ | Working condition | 65.8 | 24.3 | 61 | 0.73 | ||||||||||||
| *The positive responses refer to the sum of I agree totally and agree partially divided by the number of responses | |||||||||||||||||
| (neutral, totally and partially disagree except the absent data). SD: Standard Deviation |
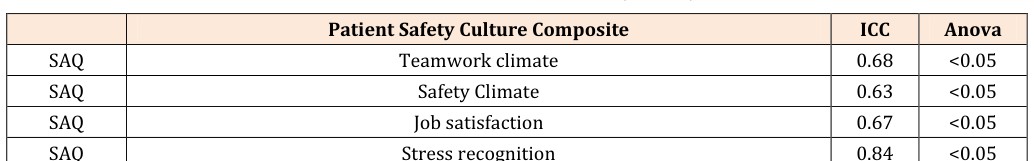
Regarding the Infraclass Correlation Coefficient, SAQ presented significant ICC 0.63 for all domains, considering moderate to excellent reproducibility. The HSOPSC showed ICC ranging from 0.33 to 0.91 significant for six domains and reproducibility ranging from poor to excellent (Table 3).
| Patient Safety Culture Composite | ICC | Anova | |||||||
|---|---|---|---|---|---|---|---|---|---|
| SAQ | Teamwork climate | 0.68 | <0.05 | ||||||
| SAQ | Safety Climate | 0.63 | <0.05 | ||||||
| SAQ | Job satisfaction | 0.67 | <0.05 | ||||||
| SAQ | Stress recognition | 0.84 | <0.05 | ||||||
| SAQ | Perceptions of management units | 0.78 | <0.05 | ||||||
| SAQ | Perceptions of management hospital | 0.76 | <0.05 | ||||||
| SAQ | Working condition | 0.72 | <0.05 | ||||||
| HSOPSC | Supervisors/managers consider staff suggestions for Actions Promoting Patient Safety | 0.75 | <0.05 | ||||||
| HSOPSC | Organizational Learning—Continuous | 0.46 | <0.05 | ||||||
| HSOPSC | Teamwork within Units | 0.59 | <0.05 | ||||||
| HSOPSC | Feedback and Communication About Error | 0.5 | <0.05 | ||||||
| HSOPSC | Communication Openness | 0.59 | <0.05 |
| HSOPSC | Nonpunitive Response to Error | 0.36 | NS* | ||||
|---|---|---|---|---|---|---|---|
| HSOPSC | Management Support for Patient Safety | 0.65 | NS* | ||||
| HSOPSC | Handoffs and Transitions | 0.77 | <0.05 | ||||
| HSOPSC | Teamwork Across Units | 0.53 | <0.05 | ||||
| HSOPSC | Staffing | 0.33 | NS* | ||||
| HSOPSC | Number of Events Reported | 0.91 | NS* | ||||
| HSOPSC | Patient Safety Grade | 0.38 | <0.05 | ||||
| *NS-not significant | |||||||
| For construct validation, we considered the significant | observed that almost all SAQ domains correlated with four domains and with all the variables resulting from HSOPSC (Table 4). The only domain of SAQ that did not correlate with any HSOPSC domain was Stress perception. | observed that almost all SAQ domains correlated with | |||||
| correlations between the domains of the two instruments, | four domains and with all the variables resulting from | ||||||
| that is, the degree to which the measures of two | HSOPSC (Table 4). The only domain of SAQ that did not | ||||||
| instruments are related positively. Thus, when the | correlate with any HSOPSC domain was Stress perception. | ||||||
| domains of the two instruments were correlated, it was |
| Domains SAQ | Domains HSOPSC | Outcome variables | |||||||
| Teamwork climate | Teamwork within Units, Organizational Learning- Continuous, Feedback and Communication About Error | Patient Safety Grade and Number of Events Reported | |||||||
| Safety climate | Organizational Learning-Continuous e Feedback and Communication About Error | Patient Safety Grade, Overall Perceptions of Patient Safety and Number of Events Reported | |||||||
| Job satisfaction | - | Number of Events Reported | |||||||
| Perceptions of management units | Teamwork within Units | Patient Safety Grade | |||||||
| Perceptions of management hospital | Organizational Learning-Continuous e Feedback and Communication about Error e Management Support for Patient Safety | Number of Events Reported | |||||||
| Working condition | Management Support for Patient Safety | Patient Safety Grade | |||||||
| To understand how much each predictive variable | |||||||||
| (domains) explained the outcome variables (Number of | |||||||||
| events reported in the last 12 months, |
| Outcome variable | ||||||||||||||
|---|---|---|---|---|---|---|---|---|---|---|---|---|---|---|
| Number of | Overall | |||||||||||||
| Predictive variable | Patient Safety | |||||||||||||
| Events | Perceptions of | |||||||||||||
| Grade | ||||||||||||||
| Reported | Patient Safety | |||||||||||||
| Teamwork climate | 0.35 (0.01) | 0.34 (<0.01) | ||||||||||||
| Safety climate | 0.46(0.01) | 0.36(<0.01) | ||||||||||||
| Job satisfaction | 0.32(0.01) | |||||||||||||
| Perceptions of management hospital | 0.31(<0.05) | 0.35(<0.05) | ||||||||||||
| Working condition | 0.36 (<0.05) | |||||||||||||
| Organizational Learning— Continuous | - | 0.37 (<0.05) | ||||||||||||
| Nonpunitive Response to Error | - | 0.49(<0.05) | ||||||||||||
| Handoffs and Transitions | - | 0.24(<0.05) | ||||||||||||
| Discussion Health institutions committed to patient safety policies The characterization of the professionals who can improve nurses' job satisfaction by developing the participated in the study is similar to the results of other quality of their work. It is considered that the leadership studies that showed the female gender as the styles of the supervisors and managers can imply in predominant gender [10,11], who have been working for opposite effect, reducing the autonomy and suppressing at least five years in the institution [12], with a weekly the professional satisfaction of the nurses. To avoid this, workload of 20-60 hours and with direct contact with the hospital managers must demonstrate positive attitudes in patient [10,12,13]. Gender is not a factor that can be order to promote patient safety and professional associated with results in the safety culture. However, satisfaction [20,21]. work experience time and the link with the institution indicate that health professionals are very knowledgeable Internal consistency analysis using Cronbach's Alpha about their work and may have positive safety attitudes presented similar results to other studies in relation to [14]. the domains of SAQ and HSOPSC [4,22-24]. The degree of reproducibility of the SAQ (ICC> 0.63) was moderate to The mean scores of the HSOPSC domains ranged from excellent, which means that the variation between the 42.8 to 70 on a scale of 0 to 100. Of note were the professionals' responses to this instrument was small. domains, Teamwork with the highest average and Expectations and actions to promote the safety of For construct validation, we considered the significant supervisors and managers with the lowest average. These correlations between the domains of the two instruments, results diverge, in part, from the data identified in the that is, the degree to which the measures of two report of the American Agency for Quality in Health instruments are related positively [5]. Thus, a positive (AHRQ), which, after applying this instrument to association was observed between six SAQ domains with thousands of health professionals, showed that the four domains and all variables resulting from HSOPSC. teamwork in the units presented a better result and a The only domain of SAQ that showed no correlation was non-punitive response the error was the one that Stress perception. This means that the two instruments presented the worst result [7]. This domain was also the can evaluate similar constructs and can be used before one with the lowest percentage of positive responses in and after interventions that improve outcomes for the other studies emphasizing that the actions of supervisors patient. and managers considering the employees' suggestions for improving patient safety is still a failure in the institutions In general, the ICC of the domains presented studied [15-17]. The results of SAQ are similar to those statistically significant correlations. (SAQ), Work identified in the studies with this instrument in which Conditions (SAQ), Supervisor Safety Promotion they present the domain Satisfaction in the Work as the Expectations and Actions (HSOPSC), Pass on duty best evaluated and the domain Management perception as (HSOPSC) and reported (HSOPSC) presented a statistically the domain of unfavorable evaluation [10,18,19]. | ||||||||||||||
| Health institutions committed to patient safety policies | ||||||||||||||
| The characterization of the professionals who | can improve nurses' job satisfaction by developing the | |||||||||||||
| participated in the study is similar to the results of other | quality of their work. It is considered that the leadership | |||||||||||||
| studies that showed the female gender as the | styles of the supervisors and managers can imply in | |||||||||||||
| predominant gender [10,11], who have been working for | opposite effect, reducing the autonomy and suppressing | |||||||||||||
| at least five years in the institution [12], with a weekly | the professional satisfaction of the nurses. To avoid this, | |||||||||||||
| workload of 20-60 hours and with direct contact with the | hospital managers must demonstrate positive attitudes in | |||||||||||||
| patient [10,12,13]. Gender is not a factor that can be | order to promote patient safety and professional | |||||||||||||
| associated with results in the safety culture. However, | satisfaction [20,21]. | |||||||||||||
| work experience time and the link with the institution | ||||||||||||||
| indicate that health professionals are very knowledgeable | Internal consistency analysis using Cronbach's Alpha | |||||||||||||
| about their work and may have positive safety attitudes | presented similar results to other studies in relation to | |||||||||||||
| [14]. | the domains of SAQ and HSOPSC [4,22-24]. The degree of | |||||||||||||
| reproducibility of the SAQ (ICC> 0.63) was moderate to | ||||||||||||||
| The mean scores of the HSOPSC domains ranged from | excellent, which means that the variation between the | |||||||||||||
| 42.8 to 70 on a scale of 0 to 100. Of note were the | professionals' responses to this instrument was small. | |||||||||||||
| domains, Teamwork with the highest average and | ||||||||||||||
| Expectations and actions to promote the safety of | For construct validation, we considered the significant | |||||||||||||
| supervisors and managers with the lowest average. These | correlations between the domains of the two instruments, | |||||||||||||
| results diverge, in part, from the data identified in the | that is, the degree to which the measures of two | |||||||||||||
| report of the American Agency for Quality in Health | instruments are related positively [5]. Thus, a positive | |||||||||||||
| (AHRQ), which, after applying this instrument to | association was observed between six SAQ domains with | |||||||||||||
| thousands of health professionals, showed that the | four domains and all variables resulting from HSOPSC. | |||||||||||||
| teamwork in the units presented a better result and a | The only domain of SAQ that showed no correlation was | |||||||||||||
| non-punitive response the error was the one that | Stress perception. This means that the two instruments | |||||||||||||
| presented the worst result [7]. This domain was also the | can evaluate similar constructs and can be used before | |||||||||||||
| one with the lowest percentage of positive responses in | and after interventions that improve outcomes for the | |||||||||||||
| other studies emphasizing that the actions of supervisors | patient. | |||||||||||||
| and managers considering the employees' suggestions for | ||||||||||||||
| improving patient safety is still a failure in the institutions | In general, the ICC of the domains presented | |||||||||||||
| studied [15-17]. The results of SAQ are similar to those | statistically significant correlations. (SAQ), Work | |||||||||||||
| identified in the studies with this instrument in which | Conditions (SAQ), Supervisor Safety Promotion | |||||||||||||
| they present the domain Satisfaction in the Work as the | Expectations and Actions (HSOPSC), Pass on duty | |||||||||||||
| best evaluated and the domain Management perception as | (HSOPSC) and reported (HSOPSC) presented a statistically | |||||||||||||
| the domain of unfavorable evaluation [10,18,19]. |
significant association, considered excellent reproducibility. The domain Teamwork Climate (SAQ) was significantly correlated with five HSOPSC domains, namely: Learning, Teamwork of the unit, Feedback, Degree of safety and Frequency of reported events. This correlation makes sense since good quality of the relationship and collaboration among team members occurs when there are positive changes and learning from the reported events, when team members support each other, treat each other with respect and work together as a team. The other HSOPSC domains had positive correlations for one or two SAQ domains. Similar results were identified in the study by Etchegaray and Thomas [25] that demonstrated the predictive reliability and validity in both SAQ and HSOPSC instruments. The regression analysis allowed us to understand how much each predictive variable (domains) explains the outcome variables. The three HSOPSC variables explained all SAQ domains, with emphasis on the domains of Safety, Teamwork Climate, Work Satisfaction and Hospital Management Perception that were explained by all outcome variables. While two variables result General Degree of Security and General Perception of Security, they explained HSOPSC domains. The evaluation of the reliability and validity of the two instruments was consistent with previous studies that evaluated the psychometric characteristics of the two instruments [3, 4, 25]. However, this was the first construct validation survey with the two brazilian instruments that evaluate safety culture, so it is emphasized the need for more research with additional safety culture results to elucidate the strengths and weaknesses of the two instruments. It was observed that almost all domains of SAQ are correlated with some domains of HSOPSC and all variable outcomes. In addition, all variables resulting from the HSOPSC explain the domains of the SAQ.
Conclusion
It was concluded that both instruments are valid and reliable for evaluating the safety culture. It is worth emphasizing that the two instruments present factors that facilitate and hinder their application. The SAQ has a single page and has been evaluated by health professionals as a quick and practical tool to fill out, but does not have outcome evaluation items and suggestions space. The HSOPSC is a long six-page instrument, a characteristic identified as an impeding factor by many professionals, reflecting the low adherence of professionals in this study. It should be highlighted that this instrument presents variables that allow the evaluation of results, indicators that can complement and confirm the evaluated constructs. In addition to possessing a space for the writing of suggestions. The two culture evaluation questionnaires available in the Portuguese language can be useful tools in the initial diagnosis of the institution's safety culture and assist managers in decision making.
References
-
Kohn LT, Corrigan JM, Donaldson MC (2000) To Err is Human: building a safer health system. Committee on Quality of Health Care, Institute of Medicine, National Academy Press Washington (DC).
-
Sexton JB, Helmreich RL, Neilands TB, Rowan K, Vella K, et al. (2006) The Safety Attitudes Questionnaire: psychometric properties, benchmarking data, and emerging research. BMC Health Serv Res 6: 44.
-
Carvalho REFL, Cassiani SHB (2012) Cross-cultural adaptation of the Safety Attitudes Questionnaire- Short Form 2006 for Brazil. Revista Latino-Americana de Enfermagem 20(3): 575-582.
-
Reis CT, Martins M, Laguardia J (2012) Transcultural adaptation of the Brazilian version of the Hospital Survey on Patient Safety Culture: initial stage. Cad Saúde Pública, Rio de Janeiro 28(11): 2199-2210.
-
Agency for Healthcare Research and Quality (2015) Hospital Survey on Patient Safety Culture: 2004. User comparative database Report, AHRQ.
-
Sternick C (2017) Technical characteristics of a measuring instrument. Arquivos Brasileiros de Psicologia Aplicada 28 (1): 48-67.
-
Carvalho RE, Arruda LP, Birth NK, Sampaio RL, Cavalcante ML, et al. (2017 ) Assessment of the safety culture in public hospitals in Brazil. Rev Lat Am Nursing 25: e2849.
-
Menz HB, Latt MD, Tiedemann A, Mun San Kwan M, Lord SR (2004) Reliability of the GAITRite walkway system for the quantification of temporal spatial parameters of gait in young and older people. Gait Posture 20(1): 20-25.
-
Hair JF, William B, Babin B, Anderson RE (2009) Multivariate data analysis 7th (Edn.), Porto Alegre: Bookman, pp: 1-734.
-
Rigobello MCG, Carvalho REFL, Guerreiro JM, Motta APG, Atila E, et al. (2017) The perception of the patient safety climate by professionals of the emergency department. Int Emerg Nurs 33: 1-6.
-
Zimmermann N, Küng K, Sereika SM, Engberg S, Sexton B, et al. (2013) Assessing the safety attitudes questionnaire (SAQ), German language version in Swiss university hospitals-a validation study. BMC Health Serv Res 13: 347.
-
Santiago TH, Turrini RN (2015) Organizational culture and climate for patient safety in Intensive Care Units. Rev Esc Enferm USP 49: 123-130.
-
Najjar S, Hamdan M, Baillien E, Vleugels A, Euwema M, et al. (2013) The Arabic version of the hospital survey on patient safety culture: a psychometric evaluation in a Palestinian sample. BMC Health Serv Res 13: 193.
-
Bodur S, Filiz E (2010) Validity and reliability of Turkish version of Hospital Survey on Patient Safety Culture and perception of patient safety in public hospitals in Turkey. BMC Health Services Research 10: 28.
-
Kings CT (2013) The safety culture of the patient: validation of a measurement instrument for the Brazilian hospital context [thesis]. Rio de Janeiro (RJ): National School of Public Health.
-
Chen IC, Li HH (2010) Measuring patient safety culture in Taiwan using the Hospital Survey on Patient Safety Culture (HSOPSC). BMC Health Serv Res 10: 152.
-
Dolci GF, Suárez JR, Casanova HA, Fernández CR, Torres FH, et al. (2010) Culture about patient safety in health professionals. Cir Cir 78(6): 527-532.
-
Brasaite I, Kaunonen M, Martinkenas A, Suominen T (2016) Health care professionals' attitudes regarding patient safety: cross-sectional survey. BMC Research Notes 9: 177.
-
Nguyen G, Gambashidze N, Ilyas SA, Pascu D (2015) Validation of the safety attitudes questionnaire (short form 2006) in Italian in hospitals in the northeast of Italy. BMC Health Services Research 15: 284.
-
Inoue T, Karima R, Harada K (2017) Bilateral effects of hospital patient-safety procedures on nurses' job satisfaction. Int Nurs Rev 64(3): 437-445.
-
Weng SJ, Kim SH, Wu CL (2017) Underlying influence of perception of management leadership on patient safety climate in healthcare organizations-A mediation analysis approach. Int J Qual Health Care 29(1): 111-116.
-
Carvalho PA, Göttems LB, Pires MR, de Oliveira ML (2015) Safety culture in the operating room of a public hospital in the perception of healthcare professionals. Rev Lat Am Nursing 23(6): 1041-1048.
-
Aymen E, Akbarisari A, Rashidian A, Aljeesh Y, Radwan M, et al. (2017) Psychometric Properties of an Arabic Safety Attitude Questionnaire. Oman Med J 32(2): 115-123.
-
Perneger TV, Staines A, Kundig F (2014) Internal consistency, factor structure and construct validity of the French version of the Hospital Survey on Patient Safety Culture. BMJ Qual Saf 23(5): 389-397.
-
Etchegaray JM, Thomas E (2012) Comparing two safety culture surveys: Safety Attitudes Questionnaire and Hospital Survey on Patient Safety. BMJ Qual Saf 21(6): 490-498.
- Teaching Cognitive Behavioral Therapy to Graduate Psychiatric Mental Health Nurse Practitioner Students: Utilizing A Mixed Methods Course Evaluation
- The Role of Pharmacogenetic Testing in Clinical Practice: A Path toward more Effective, Personalized and Cost-effective Care
- Implementing Screening with the GAD-7 in an Outpatient Mental Health Setting: A Quality Improvement Project
- Social Media and Health Promotion
- Impact of Covid-19 Pandemic on the Academic Performance and Attitude of Nursing Students towards E-Learning
- A Study to Assess the Knowledge Regarding Ill Effects of Tobacco Consumption on Health among Adolescents in Selected Higher Secondary School in Nadiad City