Effect of Chemical Treatment on the Degree of Deacetylation of Chitosan
Chitosan wide range of application is highly dependent mainly on the presence of the reactive amino groups and its degree of deacetylation (DDA) is one of the main parameters characterizing chitosan. Chitosan was produced from deacetylation of chitin using 70% alkali concentration in an autoclave at120oC for 1 hour. The degree of deacetylation (DDA) was determined using the acid-base titration method. A degree of deacetylation (DDA) of 70.67% was achieved from the autoclave synthesized chitosan compared to the conventional synthesized chitosan using a lower alkali concentration and temperature with a degree of deacetylation of 62.36%. In conclusion, the use of autoclave and increasing alkali concentration increased the DDA and may possibly influence other functional and biological properties of chitosan.
Introduction
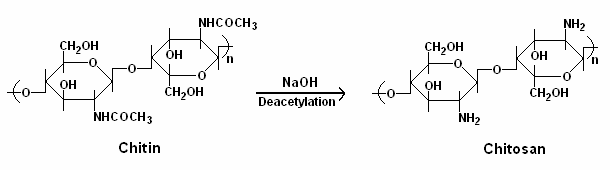
Chitosan is a polysaccharide usually obtained from deacetylation of chitin, which after cellulose is the second most abundant natural biopolymer found in nature. It may be extracted from various sources, particularly from exoskeletons of arthropods of crustaceans, fungi, insects, annelids, mollusks and coelenterate. The structures of chitin and chitosan correspond to those of poly [β (1→4)- 2-acetamide-2-deoxy-d-glucopyranose] and poly [β (1→4)-2-amino-2-deoxy-d-glucopyranose], respectively [1]. The homopolymer is a weak base with a pKa value of the d-glucosamine residue of about 6.2–7.0 and is therefore insoluble at neutral and alkaline pH values. In acidic medium, the amine groups will be positively charged, conferring to the polysaccharide a high charge density. Due to its polycationic nature, chitosan, after being dissolved in aqueous acid solutions, can be easily molded and used as membranes, beads, microparticles and gels [2]. Also, its functional properties such as biodegradability and low toxicity [3, 4] have driven the research and applications of chitosan to medicine [2, 5, 6], food additives and preservatives [7], agriculture including coating of fertilizers, pesticides, herbicides, and insecticides for their controlled release to soil and also coating of seeds and leaves to prevent microbial infections [8] as well as in the paper industry and for the treatment of industrial wastewater [9]. Chitosan is the form of chitin which has been deacetylated to at least 50% of the free amine form, which has a heterogeneous chemical structure made up of both 1-4 linked 2-acetamido-2-deoxy- β-D-glucopyranose as well as 2-amino-2-deoxy-β-Dglucopyranose [10]. The degree of deacetylation controls the amount of free amino groups in the polymer chain. The free amino groups give chitosan its positive charge. The degree of deacetylation (DDA) influences the physical, chemical and biological properties of chitosan, such as acid base and electrostatic characteristics, biodegradability, self- aggregation, sorption properties and the ability to chelate metal ions. In addition, the degree of deacetylation, which determines the content of free amino groups in the polysaccharide [11], can be employed to differentiate between chitin and chitosan. There are various methods available to increase or decrease the degree of deacetylation. An increase in either temperature or strength of sodium hydroxide solution can enhance the removal of acetyl groups from chitin, resulting in a range of chitosan molecules with different properties and hence its applications [12]. Different conditions such as type and concentration of reagents, time and temperature employed throughout the processing can affect the physical characteristics and performance of the final chitosan product [13]. The objective of this study was to synthesize chitosan using an autoclave as a reaction vessel with a higher alkali concentration in order to reduce the deacetylation time and increase the DDA.
Materials and Methods
Reagents
The following chemical were used as received: Sodium hydroxide and hydrochloric acid (BDH, Poole, England); liquid paraffin and acetone (Analar, Essex, England).
Experimental
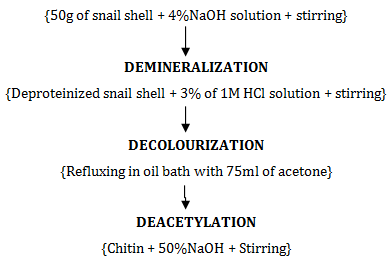
Preparation of Chitosan (A) Snail shells obtained were washed thoroughly with distilled water and air dried for 3 days. 50 g of the finely grinded sample was taken for the deproteinization extraction process involving addition of 10 M sodium hydroxide (40 % w/v) in an autoclave at 120oC for 1 hour at a pressure of 15 pound per square inch. The resulting residue was washed with deionised water to bring the pH to neutral. The neutral residue was then dried at 100oC for 1 hour. The dry residue was demineralised by adding 100cm3 1M hydrochloric acid was placed in an autoclave at 80oC for 45 minutes until no bubbles were observed. It was washed repeatedly with deionised water to a neutral pH and dried at 90oC for 1 hour. The dry powder was decolourised by refluxing in 75 cm3 acetone in a paraffin wax bath at 60oC for 3 hours on a magnetic stirrer to give a near white powder. The near white powder was air dried in ambient condition and screened with 150μm sieve. The powder was finally deacetylated with 100 cm3 17.5 M (70 % w/v) sodium hydroxide solution in an autoclave at 120oC for 1 hour at a pressure of 15 pound per square inch. After deacetylation, the chitosan was then washed thoroughly with deionized water to a neutral pH, dried at 90oC for 1hour and kept inside a polythene container for storage. The synthesized was based on the procedure of [14] Adewuyi_et al_., with modification.
Preparation of Chitosan (B) Snail shells obtained were washed thoroughly with distilled water and air dried for 3 days. 50 g of the finely grinded sample was taken for the deproteinization extraction process involving addition of 10 M sodium hydroxide (40 % w/v) at 80oC for 6 hours on a magnetic stirrer. The resulting residue was washed with deionised water to bring the pH to neutral. The neutral residue was then dried at 100oC for 1 hour. The dry residue was demineralised by adding 100cm3 1M hydrochloric acid. Effervescence occurred due to the liberation of carbon dioxide hours at 30oC for 3 hours on a magnetic stirrer. The sample was then washed with distilled water until a relatively neutral was obtained and then the demineralized shell was dried to constant weight. The demineralized residue was decolourised by refluxing in 75cm3 acetone in a paraffin wax bath at 60oC for 3 h on a magnetic stirrer to give a near white powder. The near white powder was air dried in ambient condition and screened with 150μm sieve. The chitin powder was finally deacetylated with 80 cm3 12.5M sodium hydroxide solution under constant stirring on a magnetic stirrer at 30oC for 4 hours. After deacetylation, the chitosan was then washed thoroughly with deionized water to a neutral pH, dried at 90oC for 1hour and kept inside a polythene container for storage [14].
Characterization of chitosan
Determination of degree of deacetylation: Chitosan of 0.125 g was dissolved in 25 cm3 aqueous solution 0.1 mol per dm3 hydrochloric acid. The content of the flask was stirred for 30 minutes until it dissolved totally. The solution was titrated with 0.1 mol per dm3 sodium hydroxide. The amount of amino group was calculated as follow:
NH2(%) = C1 V1 – C2 V2X 0.016 …………….. (i) G (100-W) Where: C1- concentration of standard HCl aqueous solution C2 -standard NaOH solution V1 - Volume of the standard HCl aqueous solution used to dissolve chitosan (ml) V2 - Volume of standard NaOH solution consumed during titration (ml) G- Weight of chitosan (g) W- Water percentage of chitosan The number 0.016 (g) is the equivalent weight of NH2 group in 1 ml of standard 1 mol/LHCl aqueous solution DDA (%) = NH2(%)/9.94% x 100 %.....................(ii) 9.94% is the proportion of NH2 group by weight in chitosan.
Infra-Red Spectrophotometry
Dry samples of chitosan obtained by the two procedures were prepared for IR analysis by making slurry with hydrocarbon oil (NUJOL). The slurry was then transferred to a NaCl plate and inserted into the sample compartment. Infrared spectra depicting the functional groups were obtained using Buck Demo 500 spectrophotometer by recording 45 scan in %T mode in the range of 4000 ±200cm-1.
Results and Discussion
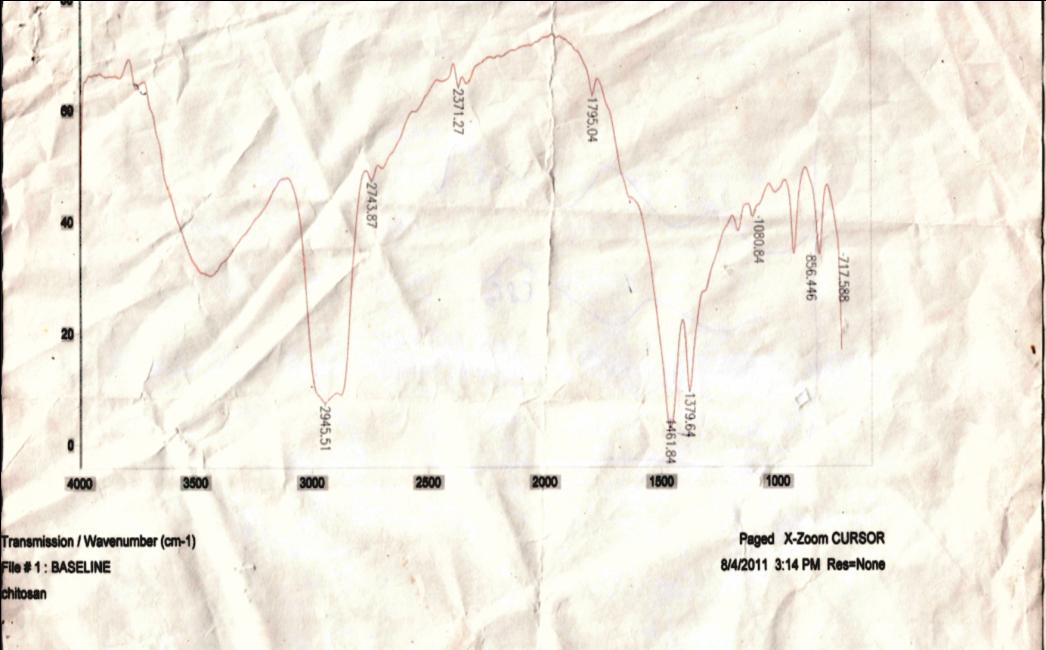
The mean values of degree of deacetylation of the two sets of chitosan are presented in (Tables 1,2). For chitosan (A), obtained using an autoclave and higher alkali concentration, the values range between 70.67 %- 69.70 % and are not significantly different from one another while chitosan (B), obtained using a magnetic stirrer and lower alkali concentration the values range between 62.36 %-61.50 % and also not significantly different from one another (p>0.05). As expected, DDA from the autoclave process are higher than the magnetic stirrer synthesized chitosan as shown from Table 1 and 2. However, the time taken for the deacetylation process with the use of an autoclave was lower than the time taken for the same process without the use of an autoclave i.e. using a magnetic stirrer. (Table 3) shows the various functional groups and the bands at which they appear in the two sets of chitosan. The band obtained at 3500 cm-1 and 3000 cm-1 attributed to the stretching mode of hydroxyl and extension vibration of N-H which is a broad and strong band in chitosan (A). The broad peak is due to inter- and intra- molecular hydrogen bonds. The band at 2945 cm-1 represents stretching N-H in amine. Lower intensity peak at 2743 cm-1 are assigned to the symmetric and asymmetric modes of CH2 group vibrations. This shows that chitosan (A) contained a free amino group that defines a chitosan. The peak observed at 1461 cm-1 and 1379 cm-1 are characteristic of chitosan as amine I and amide II peaks respectively. The absorption band featuring bending vibration of NH from R-NH2 was observed at 1795 cm-1 indicating increase degree of deacetylation. This was compared with the result obtained by [15] Teli and Sheikh and a degree of similarity was observed. The band near 3450cm-1 representing OH stretching becomes broader with lower intensity as it has undergone N-deaectylation and supported with the result of [16]Zhang et al. [17] Pawlak and Mucha reported that a band at 3360cm-1 which represents the stretching –NH2 in amine group. This shows the existence for free amino group present in chitosan. The peak at 1080cm-1 is characteristic of C-O stretching vibration. The absorption band at 1080cm-1 and 856cm-1 corresponds to the characteristic absorption bands of C=O group of amide I and of β-D-glucose unit respectively. Meanwhile, extra bands in the region of 1605cm-1 - 1566cm-1 was reported due to amine group where 3450cm-1, 3262cm-1, 3114cm-1 and 1658 cm-1 were missing due to amide group withdrew during deacetylation. This indicates that chitin is transform to chitosan through n-deacetylation which reduce the amide content. This is observed as the reductions of band at1655cm-1 as it transformed from chitin to chitosan. In Figure3 and 4, the absorption bands used to distinguish protein (1540cm-1 ) and mineral (1798cm-1, 1420cm-1 - 1430cm-1 and 876cm-1) are not observed in the spectrum of chitosan (A) compared to chitosan (B) This shows the effectiveness of the deproteinisation and demineralization steps using an autoclave and higher alkali concentration.
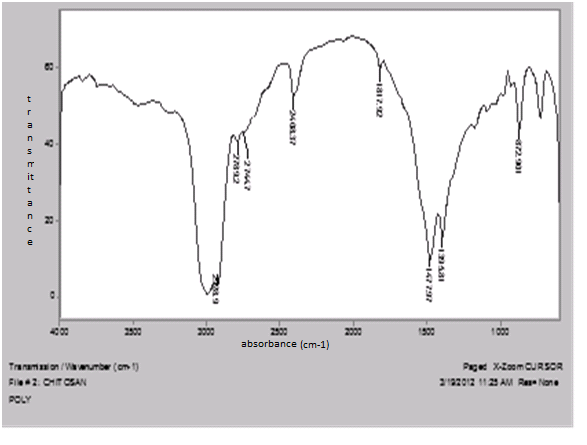
1 are assigned to the symmetric and asymmetric modes of CH2 group vibrations. Strong absorption peaks at 1477 and 1395cm-1 are characteristic of chitosan and have been reported as amine I and amide II peaks respectively. The first peak for chitosan at 898cm-1 is assigned to the ether linkage C-O-C structure and carbonyl stretching occurring at 1819cm-1. Similar reports have been reported by [18]Saifuddin et al. A
| S/N | Degree of Deacetylation (%) | ||||
|---|---|---|---|---|---|
| 1 | 69.70±0.62a | ||||
| 2 | 70.67±0.90a | ||||
| 3 | 70.30±0.03a |
Table 1: Various functional groups and their wavelengths obtained from chitosan (A and B).
| S/N | Degree of Deacetylation (%) | ||||
|---|---|---|---|---|---|
| 1 | 61.50±0.72a | ||||
| 2 | 62.07±0.80a | ||||
| 3 | 62.36±0.03a |
Table 2: Various functional groups and their wavelengths obtained from chitosan (A and B).
| Functional group | Chitosan (A) | Chitosan (B) | ||||||
|---|---|---|---|---|---|---|---|---|
| -OH- and –NH Vibrations | 3500 cm-1 | 3000 cm-1 | ||||||
| -COO- | - | - | ||||||
| Carbonyl Streching | 1795 cm-1 | 1819 cm-1 | ||||||
| AmideI and II bands | 1461 cm-1 and 1379 cm-1 | 1477 cm-1 and 1395 cm-1 | ||||||
| Symmetric CH 2 vibration | 2945 cm-1 | 2928 cm-1 | ||||||
| Asymmetrc CH 2 vibration | 2743 cm-1 | 2789 cm-1 | ||||||
| C-O-C Ether lnkage | 856 cm-1 | 899 cm-1 |
Table 3: Various functional groups and their wavelengths obtained from chitosan (A and B).
Conclusion
The use of an autoclave at a temperature of 130oC with 70 % alkali concentration in chitosan synthesis gave a higher degree of deacetylation compared to chitosan synthesized using the conventional method. However, additional studies are needed to verify the effect of these operating conditions on the functional and chemical properties of chitosan to enhance its uses. Also more accurate method of determining degree of deacetylation such as nuclear magnetic resonance spectroscopy (NMR), enzymatic determination, infrared spectroscopy (IR) etc. need to be examined.
Acknowledgement
The authors are grateful to gratitude goes to Mr. Bello T.O. of Chemistry Department University of Lagos for his effort during the research work.
References
-
Ravi KMN, Muzzarelli RA, Muzzarelli C, Sashiwa H, Domb AJ (2004) Chitosan; Chemistry and Pharmaceutical Perspectives. Journal Chem Rev 104(12): 6017-6084.
-
Rinaudo M (2006) Chitin and chitosan: properties and applications. Progress in Polymer Science 31(7): 603–632.
-
Domard A (2011) A perspective on 30 years research on chitin and chitosan. Carbohydrate Polymers 84(2): 696-703.
-
Kean T, Thanou M (2010) Biodegradation, biodistribution and toxicity of chitosan. Adv Drug Deliver Rev, 62(1): 3-11.
-
Shi CM, Zhu Y, Ran X, Wang M, Su Y, et al. (2006) Therapeutic potential of chitosan and its derivatives in regenerative medicine. J Surg Res 133(2): 185-192.
-
Jayakumar R, Prabaharan M, Sudheesh Kumar PT, Nair SV, Tamura H (2011) Biomaterials based on chitin and chitosan in wound dressing applications. Biotechnol Adv 29(3): 322-337.
-
Shahidi F, Arachchi JKV, Jeon YJ (1999) Food applications of chitin and chitosan. Trends in Food Science & Technology 10(2): 37-51.
-
Krajewska B (2004) Application of chitin- and chitosan-based materials for enzyme immobilizations: a review. Enzyme and Microbial Technology 35(2-3): 126-139.
-
Ngah WSW, Teong LC, Hanafiah MAKM (2011) adsorption of dyes and heavy metal ions by chitosan composites: a review. Carbohydrate Polymers 83(4): 1446-1456.
-
Hudson SM, Jenkins DW (2001) Chitin and Chitosan in Encyclopedia of Polymer Science and Technology. Wiley Interscience.
-
Sun Ok, FKBS (2004) Physicochemical and functional properties of crawfish chitosan as affected by different processing protocols. A Thesis Submitted to the Graduate Faculty of the Louisiana State University and Agricultural and Mechanical College in partial fulfillment of the requirements for the degree of Master of Science in The Department of Food Science Seoul National University, 1991.(**In**) Li, Q., Dunn, E.T.,
-
Grandmaison EW, Goosen MFA (1992) Applications and properties of chitosan_._ Journal of Bioactive and Compatible Polymers 7: 370-397.
-
Sridhar S, Susheela G, Jayasimha G, Khan AA (2001) Crosslinked chitosan membrane: characterization and study of dimethly hydrazine dehydration by preparation. Society of Chemical Industry 50: 1156- 1161.
-
Adewuyi S, Akinhanmi TF, Taiwo EO, Adeyemi (2008) Chelation of Zinc (II) Metal ion (II) ion from waste water with Biopolymeric Chitosan Ligand produced from snail shell. J of Chem Soc of Nig 33(2): 46-49.
-
Teli MD, Sheikh J (2012) Extraction of chitosan from shrimp shells waste and application in antibacterial finishing of bamboo rayon. International Journal of Biological Macromolecules 50(5): 1195-1200.
-
Zhang Y, Xue C, Li Z, Zhang Y, Fu X (2006) Preparation of halfdeacetylated chitosan by forced penetration and its properties. Carbohydrate Polymers 65(3): 229-234.
-
Pawlak A, Mucha M (2003) Thermogravimetric and FTIR studies of chitosan blends. Thermochimica Acta 396(1–2): 153-166.
-
Saifuddin N, Nian CY, Zhan LW, Ning KX (2011) Chitosan-silver nanoparticles composite as point-of- use drinking water filtration system for household to remove pesticides in water. Asian Journal of Biochemistry 6: 142-159.
- Solution-Processed Chiral Perovskites for Biomedical Applications
- Nanotechnology in Health Chemistry and Medicine: Current Challenges and Future Directions
- Human Exposure to Micro- and Nanoplastics: Pathways, Toxicity, and Intervention Strategies
- Exosome Nanomedicine for Cancer Therapy
- Micro and Nanoplastics–Plastisphere, Biotoxicity, Impact on Human Health, and Mitigation Strategies
- Process Validation of Cefixime Powder for Suspension Dosage Form, 50 mL