Effects of Erbium Incorporation on Structural, Magnetic, and Dielectric Properties of Magnesium Oxide Nanoparticles
The Erbium doped magnesium oxide nanoparticles (Er-MgO NPs) have been synthesized in the form of crystalline powder using the chemical precipitation method and the structure was confirmed by Photoluminescence (PL), Fourier transforms infrared spectrophotometer (FT-IR), Powder X-ray diffraction (PXRD), Scanning electron microscope (SEM) coupled with Energy Dispersive X-ray Spectroscopy (EDX). Furthermore, dielectric properties and antibacterial activity were tested. The stretching frequency in the FT-IR spectrum confirms the metal-oxygen bond Er-MgO-NPs. The SEM image reveals spherical-shaped particles with agglomeration. The EDX spectrum confirms the elemental composition (Er and O) present in the synthesized sample. The Vibrating Sample Magnetometer (VSM) graph shows that the doped MgO nanoparticles exhibit paramagnetic behaviors at room temperature. The frequency dependence of dielectric constant, dielectric lossand ac conductivity were studied over a range of the frequency 42Hz to 5MHz at room temperature.
Jayasrinivasan AV¹, Baskaran I¹*, Sathyaseelan B²#, Senthilnathan K³, Manikandan E⁴ and Sambasivam S⁵
¹Department of Physics, Arignar Anna Govt Arts College, India ²Department of Physics, University College of Engineering, India ³Department of Physics, VIT University, India ⁴Centre for Nano Sciences & Technology, Pondicherry University, India ⁵National Water and Energy Center, United Arab Emirates University, UAE #Equally Contributed Towards this Article studied over a range of the frequency 42Hz to 5MHz at room temperature.
Keywords: Erbium Trioxide Nanoparticles; Characterization; VSM Study; Dielectric Property SEM: Scanning Electron Microscope; EDX: Energy Dispersive X-Ray Spectroscopy; VSM: Vibrating Sample Magnetometer; PXRD: Powder X-Ray Diffraction.
Introduction
Rare-earth doped materials have attracted the most interest in developing photonic systems for various applications about their superior optical properties. In the search of photonic materials research, erbium oxide is one of the most part potential materials among the lanthanide group. Erbium consists of trivalent electrons, which are recognized to be advantageous for fiber amplifier applications. These days, particular attention is paid to exploring the optical behavior of the Er3+ ions due to their emission at 1.53 𝜇m, which is best for applications in the field of optical data transmission [1]. Biological applications of rare earth nano-sized metal particles are deficient when they are prepared or fabricated by solid-state synthesis. For this reason, the wet chemical method has been followed by researchers. Synthesis of rare earth nano-sized metal particles permits the formation of smaller and uniform, and irregular particles As a result of less application in the medicinal field. In the chemical synthesis of rare earth nano-sized metal particles, a suitable amount of precursors has been used to obtain nano-sized particles with homogeneous distributions. The precursor releases anions during decomposition that are responsible for the reduction of rare earth nano-sized metal particles. Erbium is one of the important representative elements among lanthanides, and it has been exploited for biological applications [2]. Erbium has been less explored than cerium as a dopant for the improved heterogeneous photocatalysis exhibited by other metal oxides. Er3+ is recognized as an attractive activator for solid-state lasers in the visible to infrared range owing to its kind of abundant energy level structure. In particular, the 4I13/2→4I15/2 transition emits at 1.54 μm located in the low-loss optical window for optical fiber communication [3]. Rare-earth metal oxides have become a precious source in material science because of their growing applications in the fields of catalysis, adsorption, and energy storage due to their distinctive properties such as semiconductor, paramagnetic, thermal stability, and fluorescent [4]. Among the lanthanide elements, erbium oxide (Er2O3) is considered a very interesting material in chemical and physical studies. Is a highly efficient catalyst for super capacitors, sensors, biosensors, and photo-degradation owing to their potential features and unique properties including semi conductivity, specific heat capacity, and less toxicity. Though large number of investigations has been reported on both bulk and nanocrystalline MgO and its analogues and some of the properties are well established. However these studies are far from complete and this versatile compound remain spicy in the material science community. To the best of our knowledge a comparative study on the effect of low level doping by trivalent ion for Mg in MgO on the structural, optical and photoluminescence are rare in the literature. To overcome such problems, many researchers have tried doping with rare earth elements (Er) into the MgO lattice by adjusting the structure, size, band-gap energy, or morphology to improve the catalytic performance and some other properties. It is significant to know that the addition of rare earth elements into oxides such as MgO is one of the beneficial strategies that has a hugely positive effect on the application of photocatalytic activity owing to its 4f–5d and 4f–4f electron transition configuration [5]. Rare-earth elements into MgO can trap a photo-induced electron which leads to minimizing the recombination of the electron-hole pairs, enhancing the absorption level, producing few defects, thereby decreasing the band-gap energy and reducing the mean crystalline size. Among all rare earth, erbium (Er) in particular has received much attention as a dopant, owing to its peculiar chemical and physical properties, emissions in the visible region and infrared, suitable infra-f transition and an overlap with the conduction band resulting in the decrease of the band-gap value of host material [6].
It remains a decent challenge to find the efficient elemental dopant for MgO to attain the best optical and photoluminescence properties. Motivated from the interesting investigations on the MgO based materials, we are reporting a systematic comparative study on the influence of nominal doping by trivalent (Er3+) ions for the divalent Mg2+ in MgO on the structural, optical and Photoluminescence properties. Considering the importance of Erbium, this manuscript is aimed at preparing Erbium- doped MgO NPs and studying their physical properties and biological applications [7, 8]. It is popularly known for its physical and chemical properties such as optical, chemical, thermal, electronic, and magnetic properties [9].
Materials and Methods
Reagents
Magnesium nitrate hexahydrate(Mg(NO3)2.6H2O)), Erbium (III) nitrate hydrate (Er(NO3).H2O)), urea (CO(NH2)2), and sodium hydroxide (NaOH) were purchased from Merck Ltd, Mumbai, India. Distilled water was used to prepare the solutions.
Synthesis of Erbium Doped-Magnesium Oxide Nanoparticles
The Er-doped MgO nanoparticles were synthesized using the chemical precipitation method. In distilled water, 1 g of magnesium nitrate hexahydrate, 1.0 g of erbium (III) nitrate hydrate, and 2.0 g of urea (CO(NH2)2) were dissolved. The solution was stirred for 30 min on a magnetic stirrer to get the precipitate. Then, after the formation of a precipitate, the prepared solution was placed in a furnace. It was boiled, and the water contents were totally dehydrated and then decomposed with the evolution of large volumes of gases. The sample burned without a flame with a sharp sound, and all the water molecules in it were expelled completely by dehydration. The total process in a micro-oven is a sudden process that occurs in less than 5 minutes. The sample was taken from the beaker and ground until well powdered and stored in a container for further studies.
Characterization Techniques
The synthesized NPs of Er doped MgO were characterized by using XRD, FTIR, UV Visible and LCR meter. The crystal structure of the sample was inspected using powder XRD using a BrukerD8-Advance X-ray diffractometer with Cu Kα
radiation in the 2θ range 20° to 80°. FTIR analysis of the samples was done by Perkin Elmer spectrophotometer in the range 400-4000 cm-1. UV Visible measurement of the samples was performed with a Perkin Elmer Spectrophotometer (Lambda 45) in the range of 200–700 nm. The frequency dependence of the dielectric behavior was studied by a parallel plate capacitor connected to a precision LCR meter (Agilent 4285 A).
Results and Discussions
XRD Pattern Analysis
Er-doped MgO NPs were synthesized using equimolar concentrations of magnesium nitrate hexahydrate. The XRD pattern of Er2O3-MgO is shown in Figure 1. The XRD pattern shows five diffraction peaks at 2θ values 20.65, 29.61, 34.12, 43.49, 49.16, 53.82, 58.12, and 79.37º, which were assigned to the reflection of (211), (222), (400), (431), (433), (511), (631), and (662) planes of Er2O3 [10, 11]. The noticed diffraction peaks are in good agreement with the cubic phase structure of Er2O3 (JCPDS No: 01-077-0459). A diffraction peak was observed at 2θ ≈ 26.65° (002) in the XRD pattern of Er2O3, which well coincided with the XRD pattern of literature data. It reveals the successful integration form of Er2O3 [12]. Figure 1, clearly exhibits the peaks at angles of 18.57, 36.96, 38.02, 42.98, 62.36, 74.71, and 78.66° which correspond to (1 1 1), (0 0 2), (2 0 2), (1 1 3), and (222) planes (JCPDS No. 87-0653), which reveals the formation of the polycrystalline cubic structure of MgONPs. XRD pattern shows a high intense (0 0 2) orientation peak revealing the high crystallinity of the synthesized material. The mean crystallite size is calculated using (0 0 2) reflection and found to be 25 nm. The XRD pattern shows the cubic structure, and the crystallite size is found to be 20 nm [13].
![Figure 1: The XRD pattern shows five diffraction peaks at 2θ values 20.65, 29.61, 34.12, 43.49, 49.16, 53.82, 58.12, and 79.37º, which were assigned to the reflection of (211), (222), (400), (431), (433), (511), (631), and (662) planes of Er2O3 [10,11]. The noticed diffraction peaks are in good agreement with the cubic phase structure of Er2O3 (JCPDS No: 01-077-0459). A diffraction peak was observed at 2θ ≈ 26.65° (002) in the XRD pattern of Er2O3, which well coincided with the XRD pattern of literature data. It reveals the successful integration form of Er2O3 [12]. Figure 1, clearly exhibits the peaks at angles of 18.57, 36.96, 38.02, 42.98, 62.36, 74.71, and 78.66° which correspond to (1 1 1), (0 0 2), (2 0 2), (1 1 3), and (222) planes (JCPDS No. 87-0653), which reveals the formation of the polycrystalline cubic structure of MgONPs. XRD pattern shows a high intense (0 0 2) orientation peak revealing the high crystallinity of the synthesized material. The mean crystallite size is calculated using (0 0 2) reflection and found to be 25 nm. The XRD pattern shows the cubic structure, and the crystallite size is found to be 20 nm [13].](/fulltextimages/13422/fig_1.png)
FTIR Spectrum Analysis
The FTIR spectrum of MgO nanoparticles prepared using the combustion process is shown in Figure 2. It shows the stretching vibration mode ~680, 787, and 1103 cm−1 indicating Mg–O–Mg bonds. The fingerprint region of Erbium shows the absorption bands at 567, 473, and 430 cm-1 with groups Er-O-Er and Er-O, respectively [14]. The absorption in the range 1200- 4000 cm−1 is due to the surface activity of the erbium oxide. The distinct band is observed in the wave numbers ~1388 and 1628 cm−1, denoting the bending vibration of the surface hydroxyl group. Broadband is observed at 3421 cm−1 due to the O–H stretching vibration of water molecules [15, 16, 17].
![Figure 2: It shows the stretching vibration mode ~680, 787, and 1103 cm−1 indicating Mg–O–Mg bonds. The fingerprint region of Erbium shows the absorption bands at 567, 473, and 430 cm-1 with groups Er-O-Er and Er-O, respectively [14]. The absorption in the range 1200- 4000 cm−1 is due to the surface activity of the erbium oxide. The distinct band is observed in the wave numbers ~1388 and 1628 cm−1, denoting the bending vibration of the surface hydroxyl group. Broadband is observed at 3421 cm−1 due to the O–H stretching vibration of water molecules [15-17].](/fulltextimages/13422/fig_2.png)
Optical Study
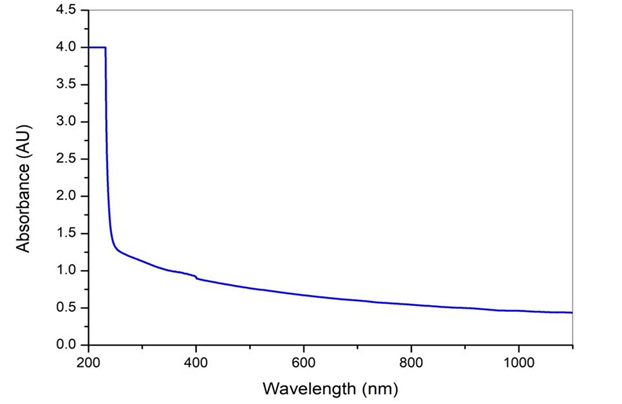
The optical properties of the pure and Er-doped samples were studied using UV−Vis diffuse reflectance spectroscopy. As shown in Figure 2, the Er-doped MgO exhibited absorption peaks ranging from 400 to 1100 nm in contrast to MgO. These adsorption peaks in the visible range were located at 451, 489, 522, 654, and 796 nm corresponding to transitions from the Er-ion ground state 4I15/2 to the higher energy levels 4F5/2, 4F7/2, 2H11/2, 4F9/2, and 4G9/2, respectively, 32 which might be associated with the up conversion. In addition, the absorption peak in the near-infrared (NIR) region (978 nm) could be related to the 4I11/2 transition. In other words, Er-MgO sample could significantly convert low-energy light into higher-energy light, such as red, green, and ultraviolet light.
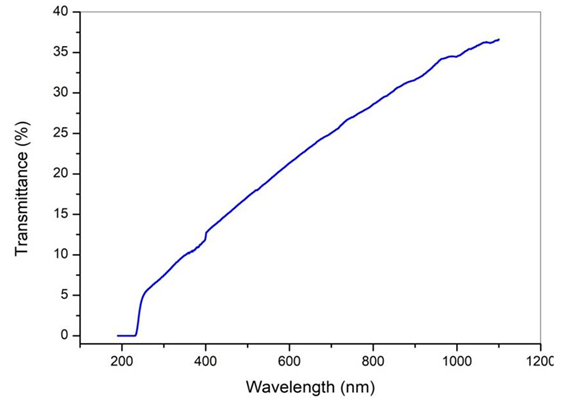
The optical properties of the pure and Er-doped samples were studied using UV−Vis diffuse reflectance spectroscopy. As shown in Figure 3, the Er-doped MgO exhibited absorption peaks ranging from 400 to 1100 nm in contrast to MgO. The transmittance of the Er-doped MgO was found to be gradually increased as shown in Figure 4 [18, 19, 20].
SEM-EDAX
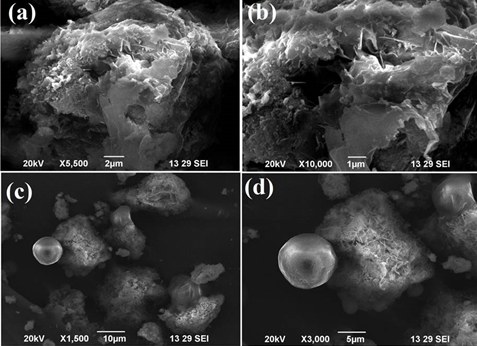
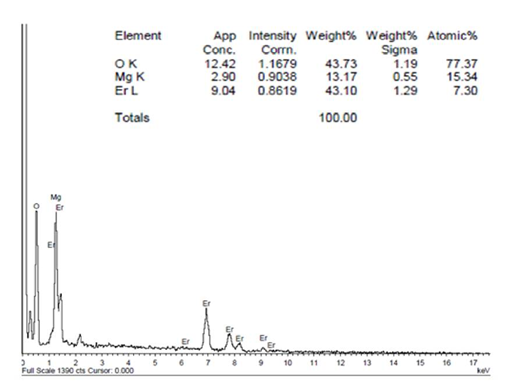
In order to understand the morphology, microstructure, geometry and estimation of the average nanocrystallite size of the Er doped MgO and also rules out presence of hidden impurity in the synthesized samples SEM measurements were conducted. Moreover, Figure 5 (a-d) displays the SEM image of Er doped MgO nanoparticles shows a wrinkled surface and folded like morphology. A good electrostatic- attractive interaction between Er doped MgO nanoparticles are possibly stabilizing them in the composite form. It can be reason that the active surface area and oxygen moieties of MgO possess attraction to the Er3+ ions nanoparticles. The EDX spectrum of Er2O3 Figure 6 depicts signals for the oxygen, and europium with weight percentage of 77.37, 15.34 and 7.30, respectively. The EDX elemental mapping of the composite reveals the homogeneous distribution of C (blue), O (red), and Er (green), which conforming the nanoparticles.
Photoluminescence Spectroscopy
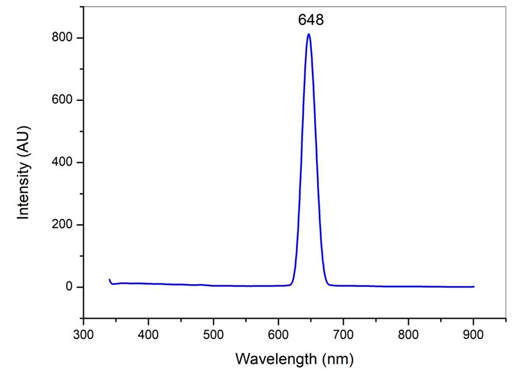
Actually, the optical and electronic characteristics of any nanoparticles are closely related to each other in terms of emission spectra and the quantized energy states, because the discrete emission wavelength of any quantum system is identified in response to the quantized energy states of that system. For understanding, the behaviour of discrete energy states and corresponding emission wavelength, the PL technique or photoluminescence spectroscopy is a powerful tool, because it is nonintrusive and nondestructive. In context of the present work, the electronic and optical properties of the prepared nanoparticles are in fact intimately related. This means that the prepared nanoparticles can exhibit the quantized energy states that are identified by discrete emission wavelength; hence, by using this technique the band structure of pure materials and the effect of nanofillers in the nanoparticles can be studied. Further, by measuring the luminescence spectrum, obviously PL spectrum, it is possible to detect the material imperfections and impurities. For the Er doped MgO nanoparticles, the PL spectra were recorded by using Spectro-Fluorescence (PerkinElmer, LS- 45). The recoded PL spectra for Er doped MgO nanoparticles are shown in Figure 7. PL spectrum at room temperature was executed to find out the optical properties of Er-MgO NPs. PL spectrum Figure 7 of Er-MgO NPs confirms the emission of UV radiation at 341 (3.10eV), and the excitation band found in the red region of light at 648 nm (1.61eV). This may be due to the oxygen vacancies in Er-MgO NPs causing the broader peak at a larger wavelength in the PL spectrum.
Consequently, PL spectrum Figure 6 confirms the existence of defects in the sample containing Er-MgO NPs.
Dielectric Properties
Dielectric properties play a significant role in determining energy storage capacity and molecular mobility in Er-MgO NPs nanocomposite. Dielectric parameters of the Er-MgONPs were tested as a function of frequency and temperature using an LCR meter. The sample was pelletized using a hydraulic press and placed between the electrodes. The dielectric constant (εr) was calculated using the relation $$ \mathring {\mathrm {a r}} = \mathrm {C d} / \mathring {\mathrm {a 0 A}} \dots \dots (1) $$
and theac conductivity was calculated by the relation, $$ \sigma \mathbf {a c} = \varepsilon \mathbf {0} \varepsilon \mathbf {r} \omega \tan (\Delta) \dots \dots (2) $$ where C represents the capacitance, d reveals the thickness, A represents the area of the cross-section of the pellet, and tan(Δ) is the dielectric relaxation of the sample. It is noticed that the dielectric constant decreases with increasing frequency as shown in Figure 6 [14, 15, 16]. From Figure 6, the dielectric constant increases at low frequency with temperature. It is understood that at low frequencies, ionic, electronic, and interfacial polarizations contribute to the dielectric constant. The dielectric loss ε” refers to energy loss in a material and can be calculated using the following equation.
$$ \varepsilon^ {\prime \prime} = \varepsilon^ {\prime} \mathbf {t a n} \delta \dots \dots \dots (3) $$ where tanδ is the tangent loss. The dielectric property of nanocompositeis the result of different polarization mechanisms adopted by the nanoparticles under an alternating electric field [21, 22].
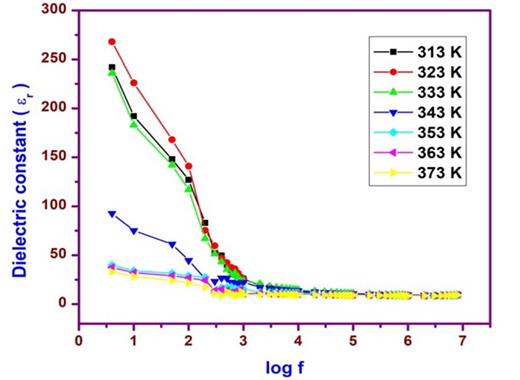
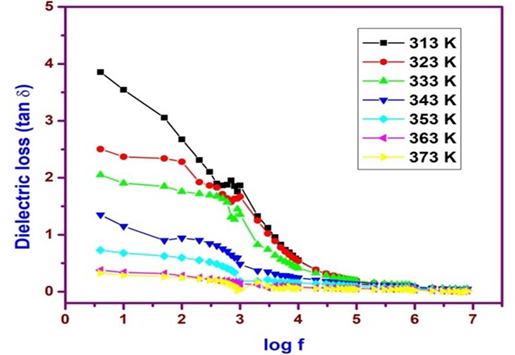
Figures 8 & 9 show the variation in the dielectric constant and dielectric loss for (Er-MgO NPs) as a function of frequency. The values of the dielectric parameter (εr and ε″) increase at lower frequencies. It may be due to the dipoles having enough time to direct themselves in the direction of the applied electric field in this region and also due to the electronic polarization effect. The dielectric constant and dielectric loss decrease as the frequency increases. This may be due to the space charge polarization which decreases as the frequency increases. In the direction of the electric field, more ions do not propagate as a consequence of the charge carriers being less participated in the dielectric property [23]. Temperature Dependence of the Dielectric Properties: Figures 10 & 11 shows the variation of the dielectric constant and dielectric loss factor as a function of temperature. In Figure 10, it can be seen that the εr increases with an increase in temperature and increases more rapidly at high temperatures. This behavior is characteristic of the polar dielectrics in which the orientation of dipoles is facilitated by increasing the temperature and hence the dielectric constant is increased. The increase of ɛr with temperature is usually associated with a decrease in bond energies [24]. That is, as the temperature increase two effects on the dipolar polarization may occur. First, it weakens the intermolecular forces and hence enhances the orientation vibration. Second, it increases the thermal agitation and hence strongly disturbs the orientation vibrations. As the temperature is increased the electronic and ionic polarizability sources start to increase. This may be because as the frequency increases, the polarizability contribution from ionic and orientation sources decreases and finally disappears due to the inertia of the ions.
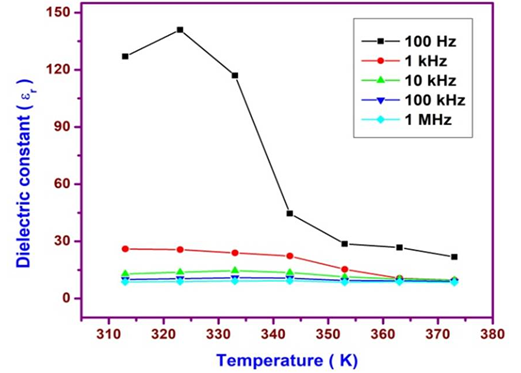
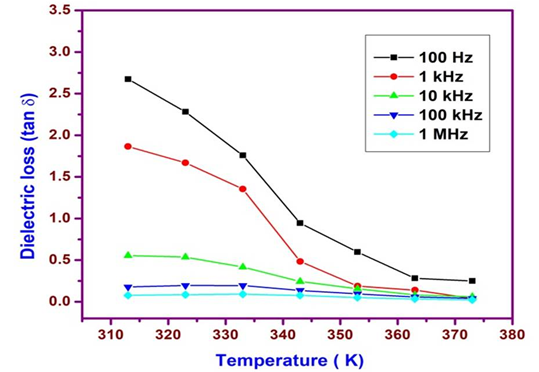
It is noticed that the dielectric loss increase with the increase in temperature (Figure 11) may be ascribed to the fact that, at low temperatures, the relaxation loss is the main contributor, and the present system may be greater than the conduction loss. When the temperature increases, the relaxation loss reduces, and therefore the conduction loss increases more quickly. The dielectric loss factor increases with temperature at low frequency.
VSM - Analysis
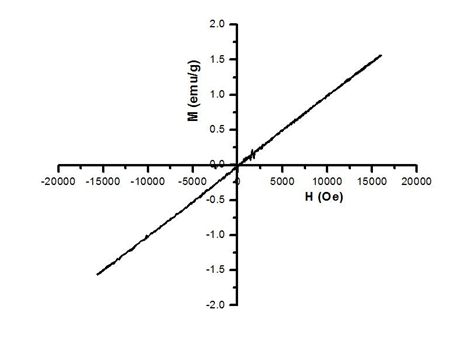
Figure 12 shows the mathematical properties of Er- doped MgO nanoparticles at room temperature from magnetic field (M-H) hysteresis loops in the range of -20000 Oe to +20000 Oe. The magnetic properties of the materials depend on crystallinity, size of the particle, shape, and magnetic direction [25]. Also, Kumar et al reported the magnetic moments were depending on the size of the nanoparticles that are close to the concentration of Mg Vacancies [26, 27, 28]. The Er-doped MgO nanoparticles show a clear paramagnetic at room temperature. But the bulk MgO is a diamagnetic insulator [29, 30, 31, 32]. The Er-doped MgO nanoparticles possessed the 2.8754E-3 emu/g of retentivity and 2.5753 Oe of coercivity which proved the paramagnetic nature of the prepared sample.
Conclusion
Er-MgO NPs with an average size of ~25 nm were successfully synthesized and characterized by various spectral techniques. The XRD spectrum confirmed the crystalline phase of Er-MgO NPs. SEM images with different magnifications confirmed the existence of Er-MgO NPs. The PL spectrum at 648 nm proved the formation of Er-MgO NPs. The dielectric constant and dielectric loss factor of Er-MgO NPs decreased with an increase in frequency but increase as temperature increased. As frequency decreases dielectric constant increases with temperature due to electrode polarization which causes space charge accumulation at the glass electrode interface. However, temperature increases are attributed to an increase in ion migration rate. At room temperature the dielectric constant and dielectric loss exhibits the normal dielectric behavior and both show a declining tendency with increasing frequency, whereas the ac conductivity shows a growing tendency with an increase infrequency. The dielectric constant increases, while dielectric loss decreases with Er doping. An increase in the ac conductivity is observed with Er doping in MgO.
References
-
Selvaraju K, Marimuthu K (2012) Structural and spectroscopic studies on concentration dependent Er3+ doped boro-tellurite glasses. Journal of Luminescence 132: 1171–1178.
-
Kataoka T, Stekelenburg A, Nakanishi T, Delhaize EM, Ryan PR (2002) Several lanthanides activate malate efflux from roots of aluminium-tolerant wheat. Plant Cell & Environment 25(3): 453-460.
-
Zhang X, Lin S, Lin T, Zhang P, Xu J, et al. (2015) Improved sensitization efficiency in Er3+ ions and SnO2 nanocrystals co-doped silica thin films Phys Chem Chem Phys 17: 11974-11980.
-
Xiaoyan Li, Yunlong Yu, PeihuiLuo, Zhang W, Guo Z, et al. (2017) Enhanced near-infrared emission from erbiumand cerium oxide codoped silica nanocomposite. Optical Materials Express pp: 71007.
-
AlAbdulaal T, AlShadidi M, Hussien M, Ganesh V, Bouzidi AF, et al. (2022) Multifunctional and smart Er2O3–ZnO nanocomposites for electronic ceramic varistors and visible light degradation of wastewater treatment. Environ Sci Pollut Res 29: 19109-1913.
-
Poornaprakash B, Chalapathi U, Kumar M, Subramanyam K, Vattikuti SP, et al. (2020) Enhanced photocatalytic activity and hydrogen evolution of CdSnanoparticles through Er doping. Ceram Int 46(13): 21728-21735.
-
Chen K, Xue D (2014) Formation of electroactive colloids via in situ coprecipitations under electric field: Erbium chloride alkaline aqueous pseudocapacitor. Journal of Colloid and Interface Science 430: 265-271.
-
Ganjali MR , Faridbod F, Norouzi P, Adib M (2006) A novel Er (III) sensor based on a new hydrazone for the monitoring of Er (III) ions. Sensors and Actuators B: Chemical 120(1): 119-124.
-
Zhang Y, Ma M, Zhang X, Wang B, Liu R (2014) Synthesis characterization, and catalytic property of nanosizedMgO flakes with different shapes. Journal of Alloys and compounds 590: 373-379.
-
Pan TM, Lin JC, Wu MH, Lai CS (2009) Study of high-k Er2O3 thin layers as ISFET sensitive insulator surface for pH detection. Sensors and Actuators B: Chemical 138(2): 619-624.
-
Mohammadi A, Badraghi J, Moghaddam AB, Ganjkhanlou Y, Kazemzad M, et al. (2011) Synthesis of Er2O3 nanoparticles and Er2O3 nanoparticle/ polyaniline deposition on the surface of stainless steel by potentiostatic deposition. Chemical Engineering & Technology 34(1): 56-60.
-
Bakhsh A, Maqsood A, (2012) Sintering Effects on Structure, Morphology, and Electrical Properties of Sol-Gel Synthesized, Nano-Crystalline Erbium Oxide. Electronic Materials Letters 8(6): 605-608.
-
Azad F, Maqsood A (2014) Fabrication, structural characterization, dielectric and electrical parameters of the synthesized nano-crystalline erbium oxide. Electronic Materials Letters 10: 557-563.
-
Selvam NCS, Kumar RT, Kennedy LJ, Vijaya JJ (2011) Comparative study of microwaveand conventional methods for the preparation and optical properties of novel MgO micro and nanostructures. J Alloys Compd 509(41): 9809-9815.
-
Balakrishnan G, Velavan R, Batoo KM, Raslan EH (2020) Microstructure, optical and photocatalytic properties of MgO nanoparticles. Results in Physics 16: 103013.
-
Saravanakumar B, Muthulakshmi S, Ravi G, Ganesh V, Sakunthala A (2017) Surfactant effect on synthesis and electrochemical properties of nickel-doped magnesium oxide (Ni–MgO) for supercapacitor applications. Appl Phys A 123: 1-9.
-
Kianipour S, Razavi FS, Hajizadeh-Oghaz M, Abdulsahib WK, Mahdi MA, et al. (2022) The synthesis of the P/N- type NdCoO3/g-C3N4 nano-33heterojunction as a high-performance photocatalyst for the enhanced photocatalytic degradation of pollutants under visible- light irradiation. Arab J Chem 15: 103840.
-
Yousefi SR, M Ghanbari, Amiri O, Marzhoseyni Z, Mehdizadeh P, et al. (2021) Dy2BaCuO5/Ba4DyCu3O9.09 S‐scheme heterojunction nanocomposite with enhanced photocatalytic and antibacterial activities. J Am Ceram Soc 104(7): 2952-2965.
-
Ali H, Ismail AM (2022) Honeycomb-like V2O5 Based Films: Synthesis, Structural, Thermal, and Optical Properties for Environmental Applications. J Inorg Organomet Polym Mater 32: 3012-3029.
-
El-Ghamaz N, Zidan H, Abdelghany AM, Lotfy A (2016) Structural and Electrical Properties of PVA/PVP Blend Doped with Methylene Blue Dye. Int J Electrochem Sci 11(11): 9041-9056.
-
Chandrakala HN, Ramaraj B, Shivakumaraiah G, Madhu GM, Siddaramaiah (2013) Investigation on the Influence of SodiumZirconate Nanoparticles on the Structural Characteristics and Electrical Properties of Polyvinyl Alcohol Nanocomposite Films. J Alloys Comp 551: 531- 538.
-
Sun L, Shi Z, Wang H, Zhang K, Dastan D, et al. (2020) Ultrahigh discharge efficiency and improved energy density in rationally designed bilayer polyetherimide- BaTiO3/P(VDF-HFP) composites. J Mater Chem A 8: 5750–5757.
-
Rahman SA (2006) Temperature frequency and composition dependence of dielectric properties of Nb substituted Li-ferrites. Egypt J Solids 29(1): 131-140.
-
Deshmukh K, Ahamed MB, Deshmukh RR, Pasha SKK, Sadasivuni KK, et al. (2017) Newly Developed Biodegradable PolymerNanocomposites of Cellulose Acetate and Al2O3 Nanoparticles with Enhanced Dielectric Performance for Embedded Passive Applications. J Mater Sci Mater Electron 28: 973-986.
-
Hadi A, Hashim A, Al-Khafaji Y (2020) Structural, Optical and Electrical Properties of PVA/PEO/SnO2 New Nanocomposites for Flexible Devices. Transactions on Electrical and Electronic Materials 21: 283-292.
-
Prashant MK, Sankarappa T, Santhosh K (2008) AC Conductivity Studies in Rare Earth Iones Doped Vonadotellurite glasses. Journal of Alloys and Compounds 464(1-2): 393-398.
-
Nabi G, Rehman S, Tahir MB, Malik N, Yousaf R, et al. (2020) Structural, Optical, and Magnetic Properties of Pure and Vanadium- Doped NiO Microstructure for Spintronics Applications. Journal of Superconductivity and Novel Magnetism 34: 1801-1806.
-
Kumar N, Sanyal D, Sundaresan A (2009) Defect Induced Ferromagnetism in MgO nanoparticles studied by Optical and positron annihilation spectroscopy. Chemical Physics Letters 477(4-6): 360-364.
-
Hanish HH, Edrees SJ, Shukur MM (2020) The Effect of Transition Metals Incorporation on the Structural and Magnetic Properties of Magnesium Oxide Nanoparticles. International Journal of Engineering 33(4): 647-656.
-
Droghetti A, Sanvito S (2009) Electron doping and magnetic moment formation in N-and C-doped MgO. Applied Physics Letters 94(25): 1-4.
-
Zhang YF, Liu H, Wu J, Zuo X (2011) Ab Initio Study on Nitrogen or Carbon Doped Magnesium Oxide. IEEE Transactions on Magnetics 47(10): 2928-2930.
-
Narayan J, Nori S, Pandya DK, Avasthi DK, Smirnov AI (2008) Defect dependent ferromagnetism in MgO doped with Ni and Co. Applied Physics Letters 93(8): 082507- 082507.
- Solution-Processed Chiral Perovskites for Biomedical Applications
- Nanotechnology in Health Chemistry and Medicine: Current Challenges and Future Directions
- Human Exposure to Micro- and Nanoplastics: Pathways, Toxicity, and Intervention Strategies
- Exosome Nanomedicine for Cancer Therapy
- Micro and Nanoplastics–Plastisphere, Biotoxicity, Impact on Human Health, and Mitigation Strategies
- Process Validation of Cefixime Powder for Suspension Dosage Form, 50 mL