Contrasting Features of Carbon dioxide and Methane (GHG) Emissions in Urban Agglomeration (Kolkata) and the Nearby Mangrove Area (Sundarbans)
This study presents a comparative analysis of methane (CH₄) emissions between Kolkata and the Sundarban Delta from 2019 to 2024, using data from Sentinel-5P. The research identifies significant trends and correlations in methane emissions, influenced by urbanization and ecological factors. Time series analysis reveals distinct seasonal patterns and trends, with Kolkata showing a steady increase in emissions due to industrial activities, while the Sundarbans exhibit relatively stable CH₄ levels, attributed to its mangrove ecosystem. Statistical analysis, including ANOVA and correlation tests, highlights the significant differences in emissions dynamics between the two regions. The findings underscore the need for transboundary environmental policies to address divergent emission trajectories and emphasize the importance of coordinated efforts between scientific communities and policymakers in India to mitigate climate change impacts. This research provides critical insights for developing targeted strategies to balance urban development with ecological preservation.
Abbreviations
ANOVA: Analysis of the Variance; TIR: Thermal-Infrared; NIR: Near-Infrared; NDVI: Normalized Difference Vegetation Index; SVM: Support Vector Machines; GHG: Greenhouse Gases; MODIS: Moderate Resolution Imaging Spectroradiometer; TCCON: Total Carbon Column Observing Network; NDACC: Network for the Detection of Atmospheric Composition Change; TROPOMI: TROPOspheric Monitoring Instrument.
Introduction
The Sundarbans Delta, recognized as a UNESCO World Heritage site, is one of the world’s largest and most biodiverse mangrove ecosystems, straddling both India and Bangladesh. This region plays a vital role in the global carbon cycle by acting as a significant carbon sink, sequestering carbon dioxide (CO₂) from the atmosphere, thereby helping mitigate the effects of global warming. Beyond its contribution to carbon sequestration, the Sundarbans also provide critical habitat for endangered species and act as a natural barrier against storm surges and cyclones [1]. However, the dynamic wetlands, peatlands, and tidal exchanges in the Sundarbans create anoxic conditions that also make the region a hotspot for methane (CH₄) emissions, particularly from microbial activity [2].
In stark contrast, the adjacent metropolitan city of Kolkata is a rapidly urbanizing region, contributing significantly to greenhouse gas emissions. As one of India’s most densely populated cities, Kolkata emits large amounts of CO₂ due to industrial activities, transportation, and residential energy use, alongside methane emissions from landfills and urban waste management systems. These anthropogenic activities further add to Kolkata’s substantial greenhouse gas footprint, presenting a challenge for both emission reduction and public health.
Given the geographical proximity of these two contrasting environments—the wild, carbon-absorbing Sundarbans and the highly urbanized, CO₂-emitting Kolkata—understanding their comparative emissions of methane and carbon dioxide is crucial. Such a comparison can provide valuable insights for various reasons:
• Emission Mitigation and Adaptation Strategies: Analyzing the differing emission patterns between the Sundarbans and Kolkata can inform targeted climate change mitigation and adaptation strategies. While urban regions like Kolkata may require stricter regulations to reduce industrial and transportation-related emissions, conservation efforts in the Sundarbans could focus on maintaining its status as a carbon sink.
• Public Health Implications: Greenhouse gas emissions have direct and indirect consequences on public health. In Kolkata, methane and CO₂ emissions contribute to air pollution, exacerbating cardiovascular and respiratory issues [3]. Meanwhile, changes in methane levels in the Sundarbans could affect the region’s ecological balance, impacting the livelihoods of local populations dependent on its natural resources.
• Understanding Emission Dynamics in Diverse Environments: The juxtaposition of a natural ecosystem and an urbanized area offers a unique opportunity to explore the dynamics of greenhouse gas emissions. While methane emissions in the Sundarbans are biogenic and result from natural processes, those in Kolkata are largely anthropogenic, stemming from landfills and waste management systems. Similarly, Kolkata is a net CO₂ emitter due to fossil fuel combustion, whereas the Sundarbans act as a CO₂ sink. A comparative analysis of these emissions will help clarify the different sources, magnitudes, and temporal variations in these distinct environments [4, 5].
Understanding these dynamics will provide a holistic view of the carbon cycle and contribute to more effective climate and environmental management policies for both regions.
Background and Significance
The Sundarbans not only serve as a natural buffer against climate impacts like cyclones but also act as a methane source due to its wetlands. Kolkata, on the other hand, is a large urban center where methane emissions are driven by anthropogenic activities such as waste management, industrial operations, and transportation. This paper compares methane emissions from these contrasting environments and investigates how natural and human- induced factors contribute to methane dynamics.
Study Area
Kolkata is positioned on the eastern bank of the Hooghly River, a distributary of the Ganges, and is located in the Indian state of West Bengal. The Sundarbans Delta, on the other hand, is a vast region formed by the convergence of three major rivers: the Ganges, Brahmaputra, and Meghna. This delta is shared between India and Bangladesh, with the larger portion situated in Bangladesh.
• Kolkata: Latitude: 22.5726° N; Longitude: 88.3639° E
• Sundarbans Delta: Latitude: 21.7496° N to 22.7496° N; Longitude: 88.8639° E to 89.8639° E
Key issues addressed in this paper include
• Emission Mitigation and Adaptation Strategies: How methane emissions in urban (Kolkata) and natural (Sundarbans) environments demand different management approaches.
• Public Health Implications: Methane’s impact on air quality and human health in Kolkata, compared to its ecological effects in the Sundarbans.
• Transboundary Environmental Policies: The need for India and Bangladesh to coordinate efforts in managing emissions across borders.
Methodology
Data Acquisition
Methane concentration data from 2019 to 2024 was obtained using satellite data from OCO-2, OCO-3, Sentinel- 5P (via the TROPOMI sensor), and MODIS. The dataset was processed using Python, reducing the original 142GB of net CDF files to manageable CSV files. Data validation was done against networks such as TCCON and NDACC for reliability [6].
Multispectral Satellite Images
Multispectral satellite images are captured by sensors aboard satellites that detect and record radiation from various regions of the electromagnetic spectrum, typically in several discrete spectral bands. These bands usually include the visible spectrum, near-infrared (NIR), and sometimes the thermal-infrared (TIR) regions, providing a diverse range of data beyond what the human eye can perceive.
These images are widely used in environmental monitoring, urban planning, agriculture, and forestry. One of the key advantages of multispectral satellite imagery is its ability to create spectral indices, such as the Normalized
Difference Vegetation Index (NDVI), which helps assess vegetation health, density, and vigor. NDVI measures the difference between near-infrared (which vegetation strongly reflects) and red light (which vegetation absorbs), offering critical insights into the photosynthetic activity of plants. This data is invaluable in comparing vegetation health across different geographic regions and time periods [8, 9].
In addition to indices like NDVI, multispectral images can be transformed into false-color composites that enhance the visual contrast between different features on Earth’s surface. By assigning different spectral bands to color channels, analysts can create images where features like vegetation, water bodies, or urban areas are highlighted in distinct colors. For instance, healthy vegetation often appears in red tones, urban areas in blue, and barren soil in shades of green or brown. Such enhancements help in distinguishing landscape features that would otherwise appear similar in natural-color images.
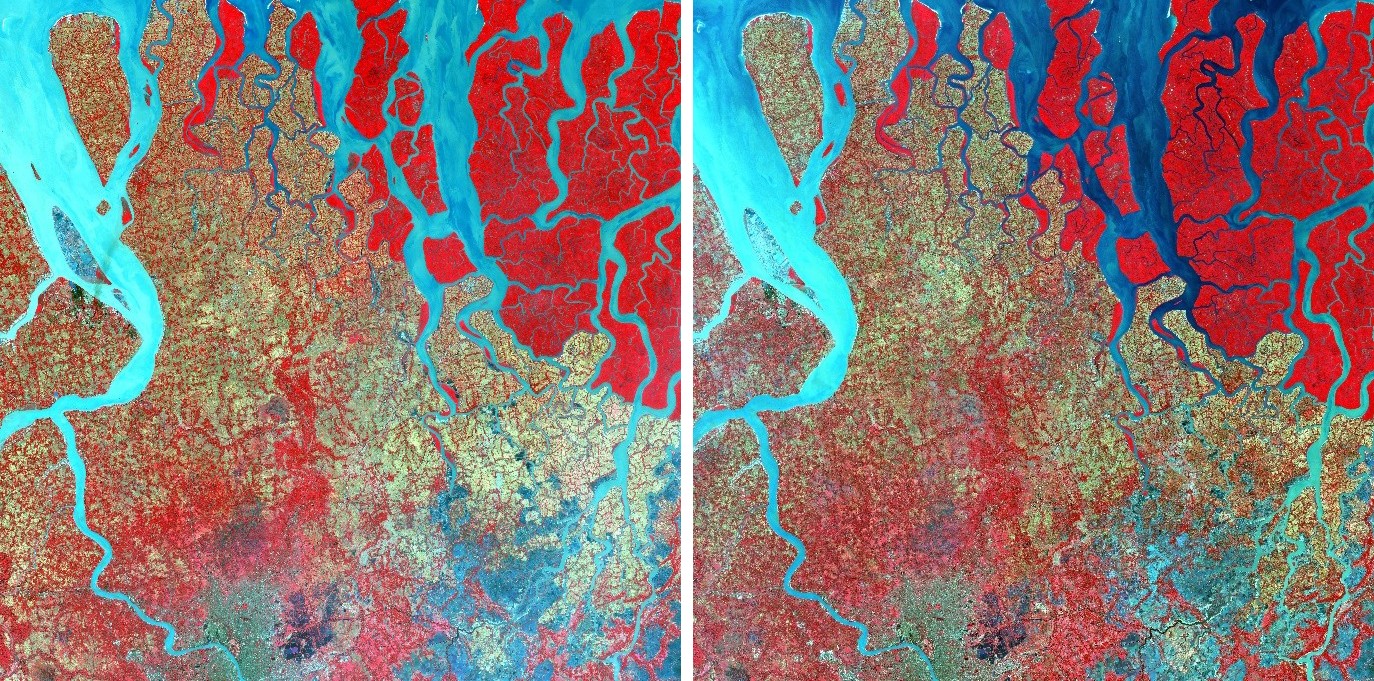
Figure 1a: Sentinel 2A-2016. Figure 1b: Sentinel 2A-2021.
Figure 1a and 1b: The images below are taken by Sentinel Satellite. These are the multispectral Images of southern part of west Bengal. Here the red parts are vegetation, bluish parts are construction site, greenish parts are bare soil and the others are water bodies.
The images below (Figures 1a & 1b), captured by the Sentinel-2A satellite, show multispectral views of the southern part of West Bengal, including the urban areas around Kolkata and the nearby mangrove-rich Sundarbans. In these images, vegetation appears red, construction sites blue, and bare soil greenish, with water bodies represented in darker shades. These spectral signatures allow for better identification of different land-use categories and environmental features.
While human observation can interpret general patterns, the exact quantification of these features-such as the percentage of land covered by vegetation or construction sites-requires more advanced techniques.
Supervised machine learning algorithms, like Support Vector Machines (SVM), are used for image classification to segment and categorize these land-cover types accurately. By analyzing these changes over a five-year span, researchers can track shifts in land use, which directly impact greenhouse gas dynamics, particularly CO2 emissions.
For example, vegetation can act as a carbon sink by absorbing CO2, while urban construction sites are often sources of carbon emissions. Thus, tracking changes in vegetation and construction over time provides critical data for understanding shifts in carbon sequestration and emissions patterns in the region.
Image Classification: Image classification is a fundamental task in remote sensing, enabling the identification and mapping of different land cover and land use types from remotely sensed data. Remote sensing refers to the acquisition of information about Earth’s surface without direct physical contact, typically through sensors on satellites, aircraft, or drones. These sensors capture various types of data, such as satellite imagery, which contain extensive information about natural resources, environmental conditions, and land use patterns across the globe.
The process of image classification involves analyzing and categorizing the spectral signatures of different objects on Earth’s surface, such as forests, water bodies, urban areas, and agricultural lands. Each type of land cover reflects or absorbs light differently across various parts of the electromagnetic spectrum, making it possible to differentiate between them using image processing techniques. Classification can be either supervised, where the analyst provides examples of known land cover types, or unsupervised, where the algorithm identifies patterns and clusters in the data without prior knowledge.
Image classification is vital in a range of applications, from land use planning and resource management to environmental monitoring. It plays a key role in assessing changes in the environment, such as deforestation, urban expansion, or crop health, helping policymakers make informed decisions to better manage ecosystems and human activities.
In environmental conservation, for instance, image classification helps track changes in forest cover, monitor biodiversity, and assess the impacts of natural disasters. In urban planning, it aids in mapping the expansion of cities, zoning, and infrastructure development. Moreover, classified images support agricultural practices by identifying crop types, monitoring growth stages, and managing water resources.
Overall, image classification transforms the vast amounts of remote sensing data into actionable insights, providing an essential tool for understanding and managing the Earth’s surface and resources.
Here we have classified the image of Kolkata, Sundarban and surrounding areas which was taken by Sentinel Satellite. We have the images of 2016 and 2021 and that is classified with four region of interest:
i. Vegetation: Colour Red
ii. Water Body: Colour Green
iii. Construction Site: Blue
iv. Bare Soil: Yellow
Classified Images: These are the classified images of 2016 and 2021 for both Rural and Urban areas given in Figure 2 (3x4 image matrix).
After the classification, it becomes evident that in urban areas, particularly around construction sites (a source of CO2), there has been a significant increase over a five- year period, while vegetation has seen minimal growth. In contrast, the rural regions, especially the Sundarbans, have maintained a steady percentage of vegetation over this time. Although there are substantial areas of bare soil and water bodies, vegetation has played the dominant role in carbon dioxide sequestration, allowing us to disregard the impact of the bare soil and water bodies in this context. This reveals a notable difference between Kolkata and the Sundarbans, with the variation in CO2 levels primarily driven by the disparity between construction sites and vegetation in these regions.
| Urban parts (2016) | |||
|---|---|---|---|
| Vegetation 40.979% Construction 35.452% | Vegetation 28.546% Construction 42.812% | Vegetation 23.026% Construction 12.015% | |
| Urban parts (2021) | |||
| Vegetation 44.712% Construction 24.275% | Vegetation 23.177% Construction 47.851% | Vegetation 20.135% Construction 41.029% | |
| Rural parts (2016) | |||
| Vegetation 10.681% Construction 13.997% | Vegetation 24.356% Construction 4.683% | Vegetation 64.492% Construction 5.999% | |
| Rural parts (2021) | |||
| Vegetation 10.727% Construction 9.451% | Vegetation 27.462% Construction 5.813% | Vegetation 62.087% Construction 2.767% |
Statistical Analysis
• Time Series Analysis: A detailed time series analysis was conducted to investigate trends, seasonality, and residuals in methane emissions. • Trend: Kolkata exhibited a steady increase in methane emissions, correlating with industrial growth. The Sundarbans showed stable emissions due to its natural ecosystem. • Seasonality: Seasonal methane peaks were observed in the Sundarbans during monsoon months, while Kolkata showed periodic surges related to temperature variations and urban activities (Figures 3a & 3b).
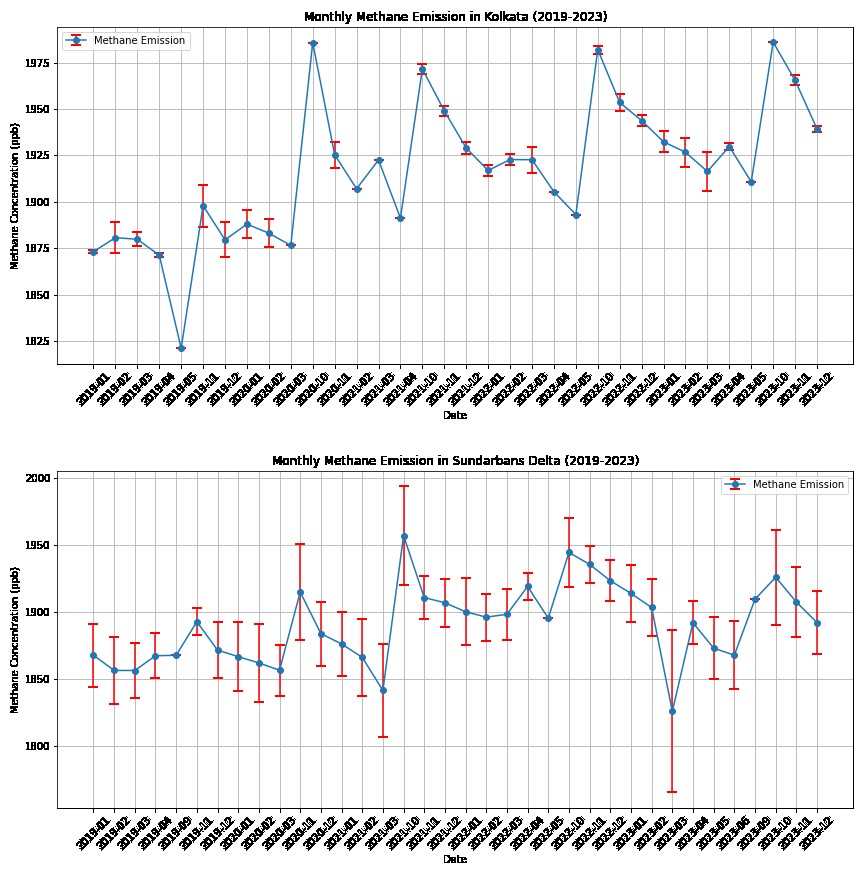
Figure 3a: Monthly Methane emission 2019-2023 for Kolkata Urban Agglomeration area.
Figure 3b: Monthly Methane emission 2019-2023 for Sundarban Mangrove forest area.
ANOVA Test: An ANOVA test was performed to assess the statistical significance of methane emission differences between Kolkata and the Sundarbans. The results indicated significant differences, underscoring the impact of geographical and environmental factors. Correlation Analysis: A correlation analysis was performed to explore the relationship between methane emissions in both regions. The weak negative correlation suggests that emissions in these regions are driven by distinct processes, with minimal interdependence.
Results and Discussion
Time Series Analysis of Methane Emissions
Time series analysis revealed distinct seasonal patterns in methane emissions for both Kolkata and the Sundarbans. Kolkata’s emissions displayed cyclical patterns, with a significant decrease from March to May and peaks in October. In contrast, the Sundarbans exhibited relatively stable emissions with a slight increase during the monsoon season (July to September), due to heightened microbial activity in wetlands. Auto-correlation: Auto-correlation analysis showed that methane emissions in Kolkata decrease gradually with increasing lags, while Sundarbans emissions exhibited short- term seasonality with weaker long-term correlations.
ANOVA Test Results
The ANOVA test revealed statistically significant differences in methane emissions between Kolkata and the Sundarbans, with an F-statistic of 11.0940 and a p-value of 0.00140. These results confirm that methane emissions in the two regions are influenced by vastly different factors, justifying the need for region-specific policies.
Statistical Correlation Analysis
Correlation analysis showed a weak negative relationship between monthly methane emissions in Kolkata and the Sundarbans, with a Pearson correlation coefficient of -0.280 and a Spearman correlation coefficient of -0.323. While these results suggest an inverse relationship, the lack of statistical significance implies that methane emissions in both regions are largely independent.
Conclusion
This study highlights the contrasting features of methane emissions in the urbanized environment of Kolkata and the natural wetlands of the Sundarbans. The significant differences in emission drivers between these regions underscore the need for tailored mitigation strategies. In Kolkata, stricter waste management policies and sustainable urban development practices are necessary to reduce emissions, while in the Sundarbans, conservation of the mangrove ecosystem can help maintain its role as a carbon sink while mitigating methane emissions from wetlands.
The weak correlation between methane emissions in these regions suggests that emissions are driven by distinct processes, with little interdependence. This emphasizes the need for region-specific approaches to emission mitigation. Additionally, the results highlight the importance of transboundary cooperation between India and Bangladesh in addressing emissions in the Sundarbans, as environmental policies in one region can impact the other.
Recommendations
• Kolkata: Implement stricter regulations on waste management, enhance urban sustainability measures, and explore renewable energy sources to reduce methane emissions.
• Sundarbans: Focus on conserving the mangrove ecosystem while monitoring methane emissions to ensure that the region continues to function as a natural carbon sink. • Transboundary Cooperation: Foster collaboration between India and Bangladesh to develop joint policies addressing methane emissions and their transboundary impacts. This research provides a foundation for future studies and policy-making that aim to balance urban development with ecological preservation, ensuring both regions contribute effectively to climate change mitigation.
Acknowledgements
The authors would like to thank the Institute of Natural Sciences and Applied Technology, Kolkata for providing infrastructure facilities to carry out the research.
References
-
Ghimire KM, Vikas M (2012) Climate Change – Impact on the Sundarbans, a Case Study. International Scientific Journal: Environmental Science 2(1): 7-15.
-
Bera B, Bhattacharjee S, Sengupta N, Shit PK, Adhikary PP, et al. (2022) Significant reduction of carbon stocks and changes of ecosystem service valuation of Indian Sundarban. Scientific Reports 12: 7809.
-
Attfield R (2023) How to use Ethics. Review of Applied Ethics: An Introduction. Studies in Ecology and Bioethics 21(4): 89-95.
-
Laanbroek HJ (2010) Methane emission from natural wetlands: interplay between emergent macrophytes and soil microbial processes. Annals of botany 105(1): 141- 153.
-
Padhy SR, Bhattacharyya P, Dash PK, Reddy C, Chakraborty A, et al. (2019) Seasonal fluctuation in three mode of greenhouse gases emission in relation to soil labile carbon pools in degraded mangrove, Sundarban, India. The Science of the total environment 705: 135909.
-
Eldering A, O’Dell C, Fisher B, Kiel M, Nelson R, et al. (2021) Measuring Carbon Dioxide from the International Space Station: An Overview of the OCO-3 Mission. EGU General Assembly 2021, EGU21-1318.
-
Schneising O, Buchwitz M, Reuter M, Bovensmann H, Burrows J, et al. (2019) A scientific algorithm to simultaneously retrieve carbon monoxide and methane from TROPOMI onboard Sentinel-5 Precursor. Atmospheric Measurement Techniques 12(12): 6771- 6802.
-
Matloob A, Sarif MO, Um JS (2021) Evaluating the inter- relationship between OCO-2 XCO2 and MODIS-LST in an Industrial Belt located at Western Bengaluru City of India. Spatial Information Research 29: 257-265.
-
Qin J, Zhang XY, Liu LYD, Qin K, Xing X (2023) Estimating ground-level CH4 concentrations inferred from Sentinel- 5P. International Journal of Remote Sensing 44(15): 4796-4814.
- Early Universe: Hadronic Crystals Coherent Micro Gravitational Wave Emitters PHYSICS Part II
- The Solar System Constraint Maze: A Scientific Dead-End Revealing the Interuniversal Machine
- Assessment of Radiofrequency Radiation from 2G and 3G Mobile Phone Handsets
- Early Universe Magneto-Gravitational Coupling Genesis Physics: Part I
- Falsifiability of the Classical Law of Gravitation and Unveiling the Time-temperature Entanglement of the Universe
- Origin of Ancient Civilisations The Southern Hemisphere’ Scenario