Changes in Enamel Topography with the Contemperary Orthodontic Adhesives: A Pilot Study
Introduction: The self-etching primer system consists of etchant and primer dispersed in a single unit. The etching and priming are merged as a single step leading to fewer stages in bonding procedure and reduction in the number of steps that also reduces the chance of introduction of error, resulting in saving time for the clinician. It also results in smaller extent of enamel decalcification. Aim: To compare the Shear Bond Strength (SBS) of orthodontic molar tubes bonded with conventional acid etching system and Self-Etch Primers (SEP) and to study the surface appearance of enamel after debonding using surface profilometry and scanning electron microscope. Materials and Methods: The sample of this in-vitro study consisted of sixty caries free, intact extracted mandibular first molar teeth. A molar tube of 0.018” Roth prescription with micro etched base was bonded to each molar with two different bonding agents. All the molar tubes were subsequently tested for evaluation of shear bond strength with a universal testing machine. Surface Profilometry and Scanning Electron Microscope (SEM) was used to evaluate the effect of various light cure adhesives on the enamel morphology. Results: Transbond-XT exhibited the highest bond strength (22.6 MPa) closely followed by Transbond Plus SEP (19.6 MPa). However, Transbond-XT sample also had higher surface roughness and enamel alterations as compared to the Transbond Plus SEP. Conclusion: The adequate bond strength of self-etching primers, less deleterious effects on the enamel and less chair side time due to absence of acid etching makes it a good option for routine use in orthodontics.
Introduction
The acid etch technique was first suggested by Michael G Buonocore [1, 2]. George V Newman [3] experimentally and clinically bonded plastic orthodontic attachments directly to enamel using acid etch technique with epoxy resins and curing agents and the process was known as bonding. Today’s advanced adhesives coupled with high performance; light force wires have allowed clinicians to greatly expand the use of direct bond tubes on the molars. A review of the literature reveals that the effect of contemporary light cure bonding agents on the surface topography of the enamel surface has not been thoroughly evaluated. The objective of this in-vitro study was to evaluate and compare the changes in the surface topography of debonded enamel surface using surface profilometry and the scanning electron microscope (SEM).
Materials and Methods
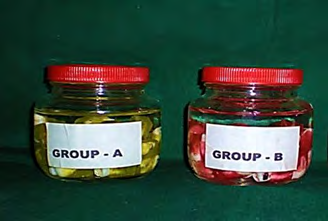
The sample of this in-vitro study consisted of sixty caries free, intact extracted mandibular first molar teeth. These teeth were cleaned of residual soft tissue debris under running water with a tooth brush and then decontaminated in 10% formalin for one week. The teeth were then stored in distilled water. The roots of the teeth were embedded in the centre of a cold cure acrylic (DPI-RR Products Ltd) block measuring 12 mm X 12 mm X 25 mm, with the crowns of the teeth exposed in such a way that the long axis of the tooth was vertical with the buccal surface exposed for the bonding procedure. All the teeth were randomly assigned to two groups with thirty teeth in each group. A colour code was used for each group (Table 1).
| Sr. No. | Area (mm2) | Shear bond strength (MPa) | Breaking load(N) |
|---|---|---|---|
| 1 | 18 | 25.3 | 456.2 |
| 2 | 18 | 26.64 | 479.5 |
| 3 | 18 | 20.06 | 361.0 |
| 4 | 18 | 18.20 | 327.5 |
| 5 | 18 | 27.43 | 493.7 |
| 6 | 18 | 22.43 | 403.7 |
| 7 | 18 | 23.42 | 421.5 |
| 8 | 18 | 28.66 | 515.8 |
| 9 | 18 | 20.56 | 370.0 |
| 10 | 18 | 19.2 | 345.7 |
| 11 | 18 | 24.19 | 435.3 |
| 12 | 18 | 19.61 | 353.0 |
| 13 | 18 | 25.51 | 459.2 |
| 14 | 18 | 31.19 | 561.3 |
| 15 | 18 | 25.75 | 463.5 |
| 16 | 18 | 20.84 | 375.2 |
| 17 | 18 | 20.22 | 364.0 |
| 18 | 18 | 20.45 | 368.2 |
| 19 | 18 | 23.65 | 425.7 |
| 20 | 18 | 22.32 | 401.8 |
| 21 | 18 | 28.23 | 508.3 |
| 22 | 18 | 19.32 | 347.8 |
| 23 | 18 | 20.78 | 373.6 |
| 24 | 18 | 22.66 | 407.8 |
| 25 | 18 | 21.24 | 382.3 |
| 26 | 18 | 18.51 | 333.2 |
| 27 | 18 | 18.03 | 324.5 |
| 28 | 18 | 20.26 | 364.8 |
| 29 | 18 | 22.28 | 401.1 |
| 30 | 18 | 21.53 | 387.7 |
| Mean | 22.61566667 | 407.0966667 | |
| SD | 3.404157381 | 61.28884403 |
Table 1: Breaking load and mean shear bond strength of Group-A.
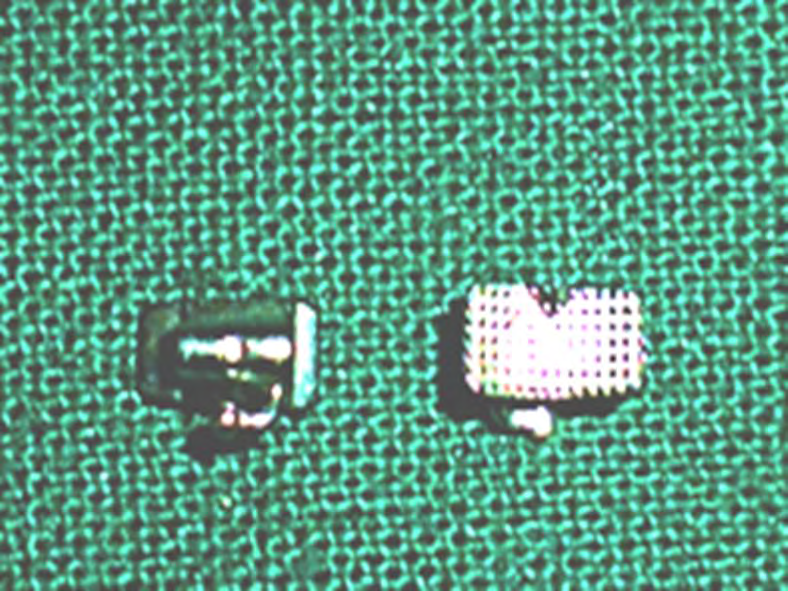
The buccal surface of each mounted tooth was cleaned with fluoride free pumice slurry in an aqueous base. They were then washed for 10 seconds in distilled water with a three way air syringe and dried for 10 seconds with oil free and moisture free gentle air spray. A molar tube of 0.018” Roth prescription with micro etched base [(Navy bondable tubes sourced from Libral Traders Ltd) (Figure 1). was bonded to each molar for each bonding agent and the bonding procedure recommended by the manufacturer was followed.
Bonding Procedure for Group A
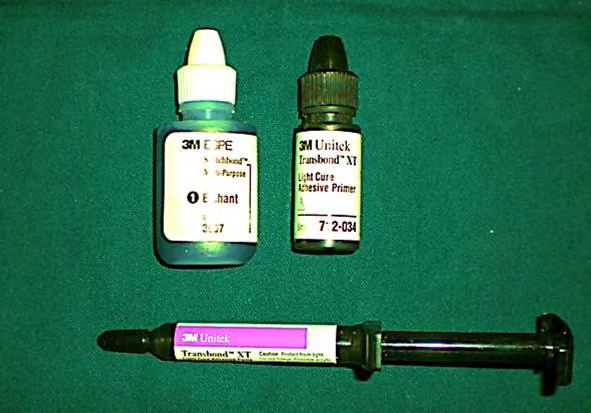
Acid etching was done with 37% orthophosphoric acid (Scotchbond, 3M Unitek) for 30 seconds (Figure 2). Thereafter the tooth surface was rinsed with water for 30 seconds and dried with moisture free air to get a frosty white appearance of tooth surface. Transbond XT primer was applied uniformly. The tube was placed on the tooth surface, excess material was removed with an explorer and the adhesive was cured with a LED light source.
Bonding Procedure for Group B
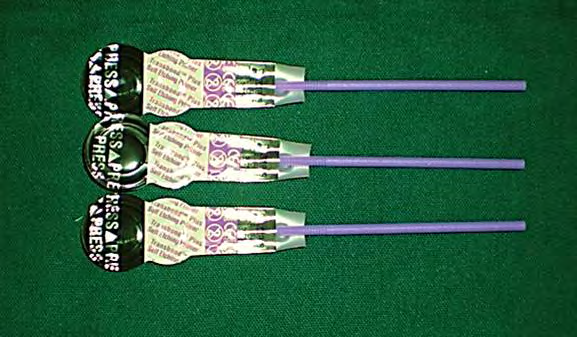
The single use package of Transbond Plus Self-etching Primer (SEP) (Figure 3) was used for etching and priming.
Squeezing and folding the first compartment over to the second activated the system. The mixed component in the second compartment was then ejected into the third compartment to wet the applicator tip. The tip was rubbed on the entire buccal enamel surface for a minimum of 3-5 seconds.
Then light cure composite adhesive paste (Transbond- XT) was applied to the bonding base of the molar tube, the tube was placed on the tooth surface lightly with the help of a bracket holding forceps, final position of the tube was adjusted and it was pressed firmly. Excess material was removed with an explorer and the adhesive was cured with the LED light source. The LED light source used for both groups had an intensity of 900mW/cm2 as measured with luxmeter. All the specimens were kept in distilled water for 24 hrs, at room temperature (Figure 4).
Preparation of Bonded Tooth for Debonding Test for Shear Bond Strength (SBS)
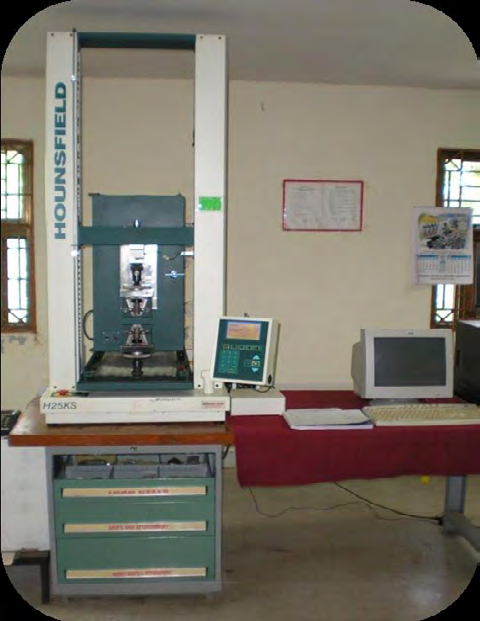
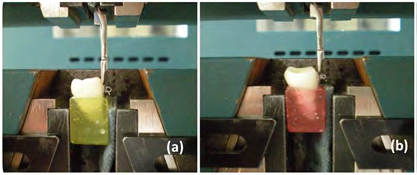
All the molar tubes were subsequently tested for evaluation of shear bond strength with a universal testing machine [(Model H25KS, Germany), (Figure 5). The test parameters data namely load (5000N), range (5.30kgf), gauge length (0.01mm), speed of test (1mm/min) and the approach speed (0.50mm/min) was entered into the computer. The specimen to be tested was loaded in the lower jaw of the machine using a heavy grip (Figures 6a & b) each sample was stressed in the occulsogingival direction at a crosshead speed of 1mm per minute.
Figures 6a & b: Specimen to be tested were loaded in the lower jaw of the machine.
The load was increased automatically by the machine till the break point was reached. This was displayed graphically on the monitor of the computer. The bond strength was determined in the shear mode until debonding took place. The values of failure loads were recorded in megapascals (MPa).
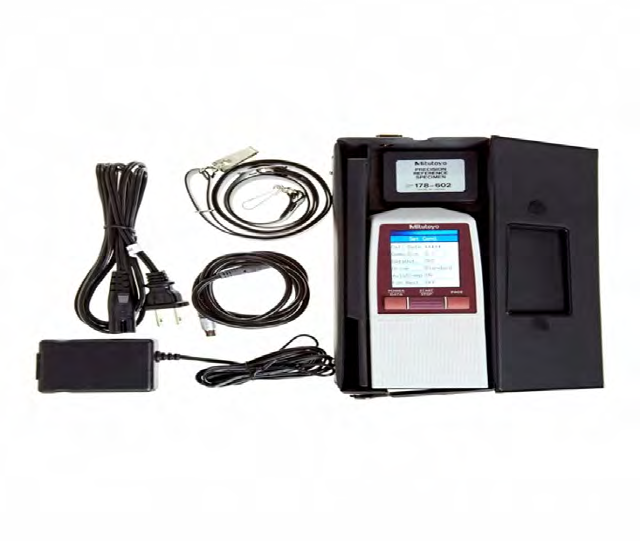
Surface Roughness Profilometry: Profilometry of etched enamel surface was done with a Profilometer (Mitutoyo, Japan, Model No. SJ210), (Figure 7). Five representative samples from each of the two groups were taken to determine the surface roughness of enamel after application of conventional acid etch and self-etch primers. All etched teeth samples were rinsed thoroughly and air dried. After which, enamel surface roughness was measured with Profilometer.
Scanning Electron Microscope (SEM) Analysis
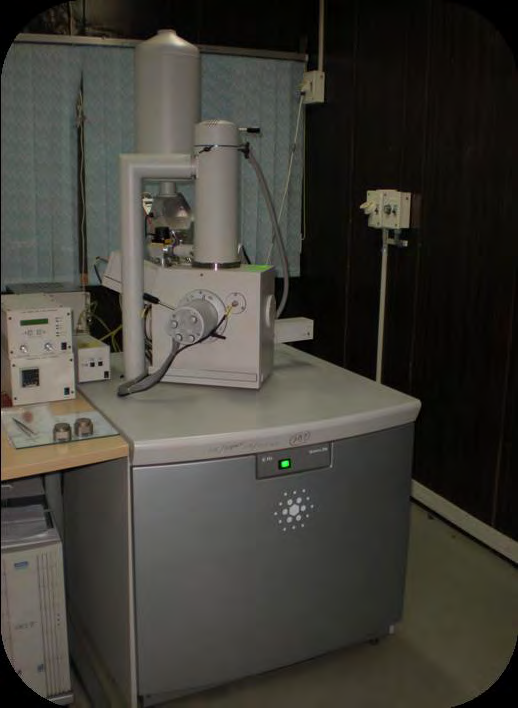
SEM was used to evaluate the effect of various light cure adhesives on the enamel morphology. Fifteen samples from each of the two groups were selected randomly to visualise the resin penetration into the enamel surface using scanning electron microscope. Quanta- 200 (Fei, Netherlands), (Figure 8).
These crowns post debonding were transversely sectioned from the roots embedded in the acrylic block with the help of a carborundum disc of 15mm diameter (SS White Ltd.) loaded on the straight handpiece of a micromotor (Confident India Ltd.) by single operator followed by sectioning mesiodistally in a vertical direction from the occlusal to cervical, using the same carborundum disc, handpiece and micromotor. The sectioning was carried out under a constant stream of distilled water spray using a 5ml hypodermic syringe (Dispovan). Now, the specimens were loaded on aluminium stubs using double sided graphite adhesive tape and marking for samples A & B was done with a coloured marker (Figure 9).
These loaded aluminium stubs were placed one at a time into the stage of the SEM sample chamber (Figure 10) and chamber was closed (Figure 11). The pressure inside was pumped down to 90 Mpa. Then imaging of the specimen surfaces was carried out. All the specimens were observed from the occlusal to the cervical area. The build-in camera of SEM was used to take photomicrographs of the middle third of the crown, as that was the area where bonding of molar tubes was performed at 1500X, 3000X and 6000X magnifications (Figures 12 & 13).
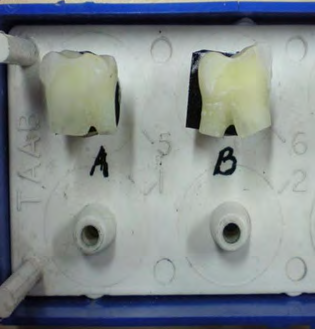
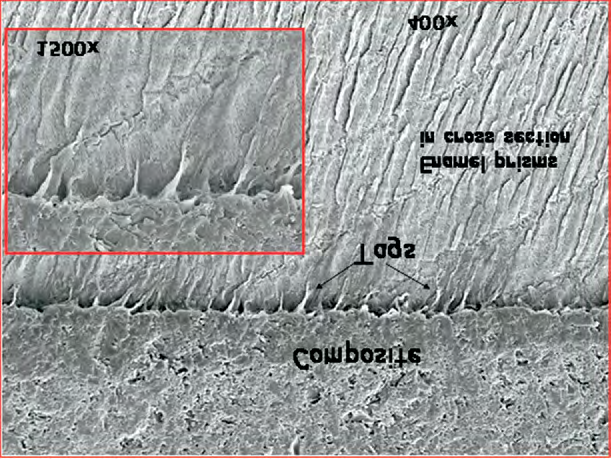
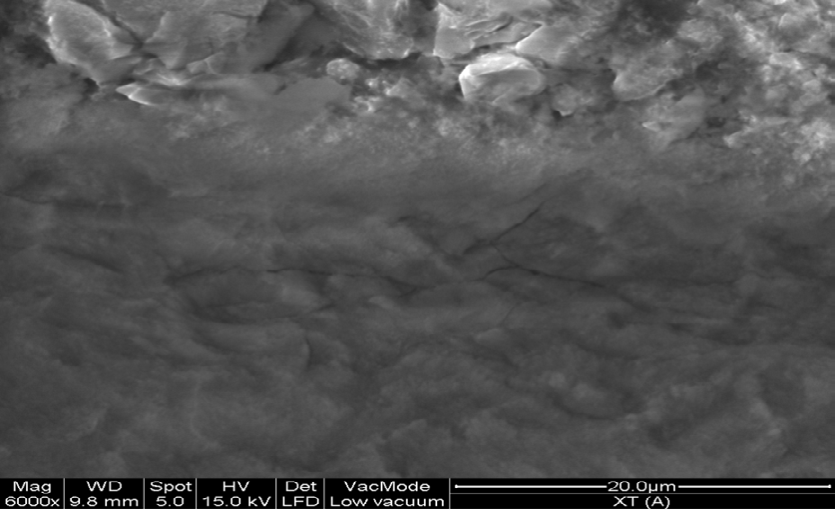
Figure 12a: Group-A (Transbond-XT); Enamel adhesive interface showing cracks in the enamel surface at 1500X.
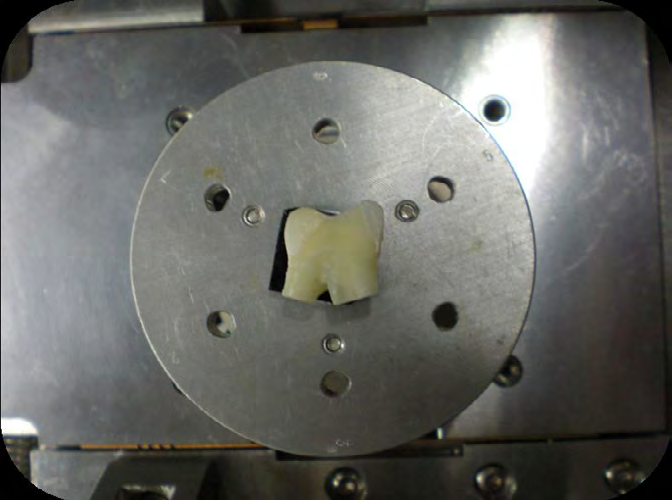
Figure 12b: Enamel adhesive interface showing resin tags penetrating enamel surface at 3000X.
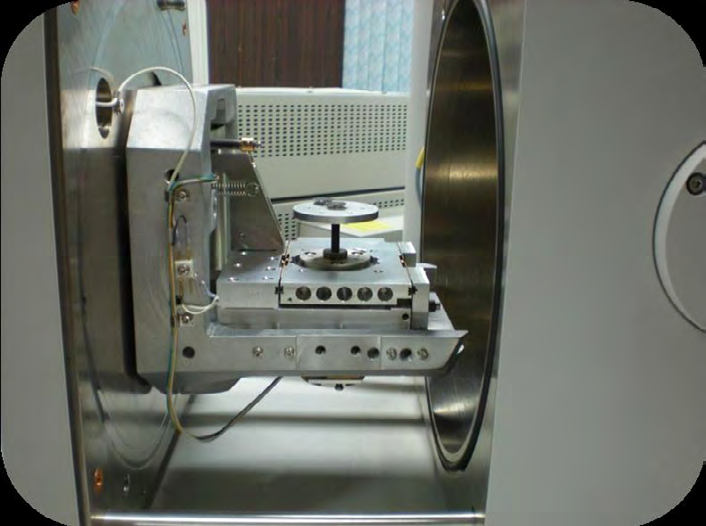
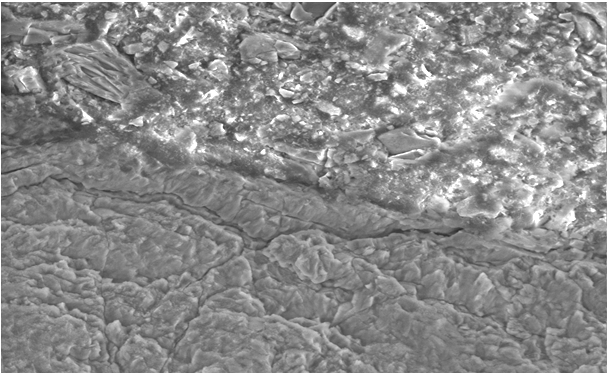
Figure 12c: Enamel adhesive interface showing irregular enamel surface at 6000X.
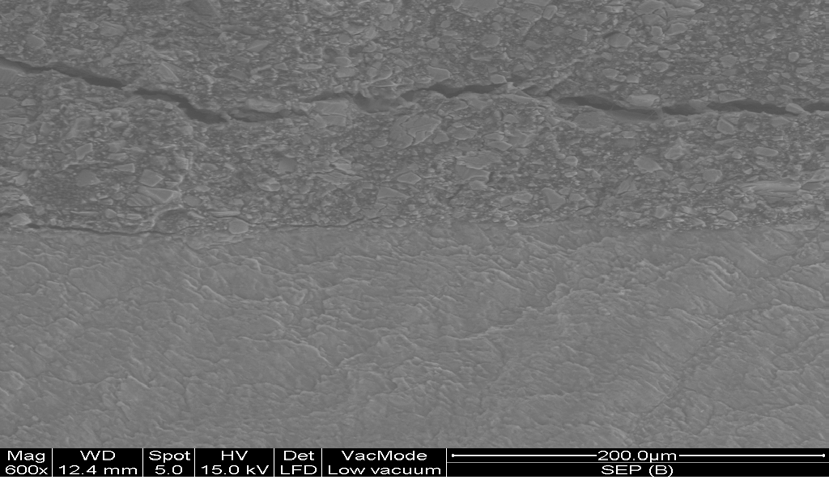
Figure 13a: Enamel adhesive interface showing cracks in the adhesive structure at 1500X.
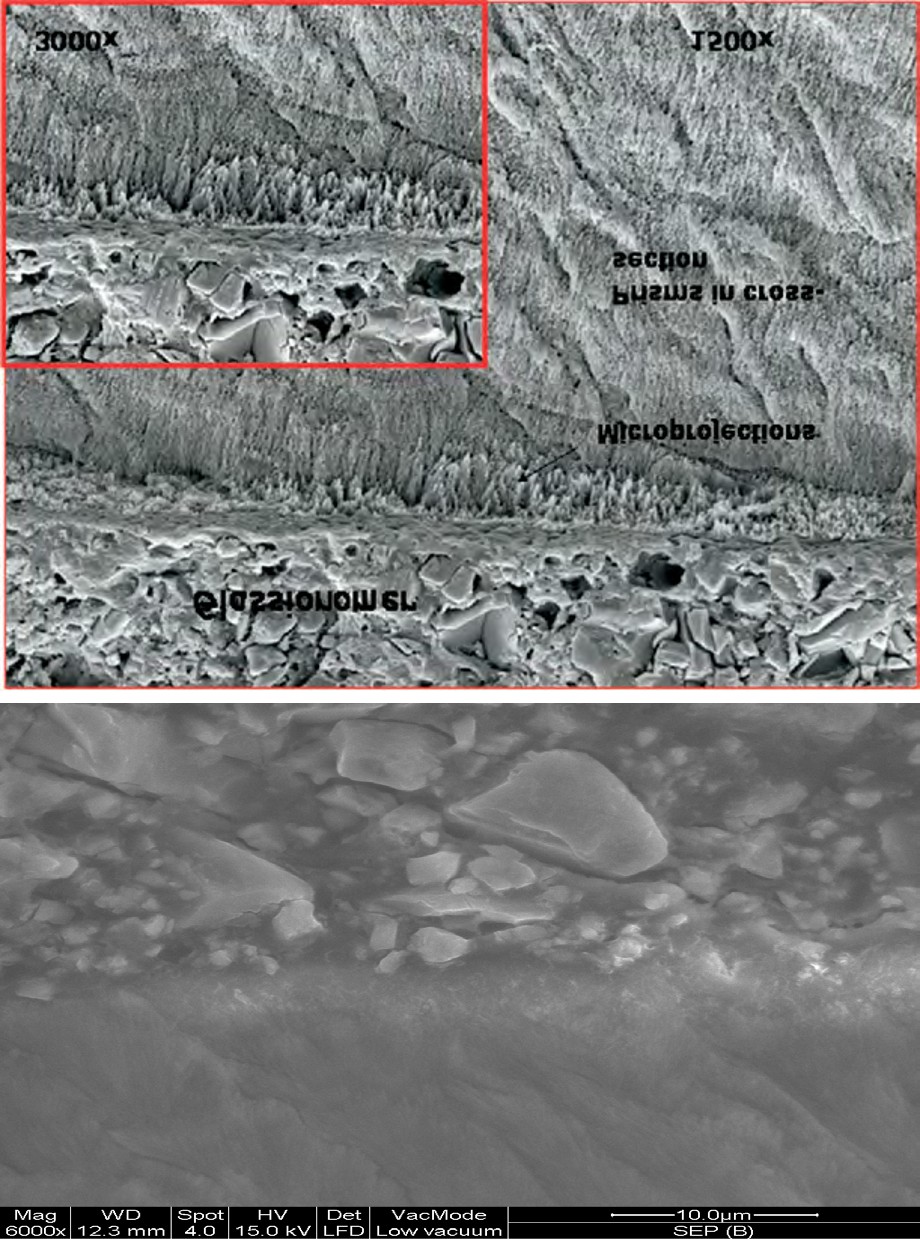
Figure 13b: Enamel adhesive interface showing thinner and smaller resin tags at 3000X
Figure 13c: Enamel adhesive interface in high magnification at 6000X.
Results
MINITAB-16 software was used for statistical analysis. Comparison of the mean shear bond strength in MPa with respect to the two bonding materials was done (Tables 1-3). Transbond-XT exhibited the higher bond strength (22.6 MPa) closely followed by Transbond Plus SEP (19.6 MPa).
To evaluate the difference in the mean shear bond strength (SBS) of the bonding materials, a one-way analysis of variance (ANOVA) test was conducted (Table 4) that showed that the differences in the mean shear bond strength were statistically very highly significant (F=60.15, p=0.0001).
| Sr. No. | Area (mm2) | Shear bond strength (MPa) | Breaking load (N) |
|---|---|---|---|
| 1 | 18 | 20.32 | 365.8 |
| 2 | 18 | 16.61 | 299.0 |
| 3 | 18 | 21.93 | 394.7 |
| 4 | 18 | 25.37 | 456.8 |
| 5 | 18 | 22.37 | 402.7 |
| 6 | 18 | 19.24 | 346.3 |
| 7 | 18 | 16.08 | 289.6 |
| 8 | 18 | 24.63 | 443.5 |
| 9 | 18 | 16.19 | 291.5 |
| 10 | 18 | 24.31 | 437.7 |
| 11 | 18 | 16.41 | 295.4 |
| 12 | 18 | 23.42 | 421.5 |
| 13 | 18 | 17.31 | 311.7 |
| 14 | 18 | 24.5 | 441.0 |
| 15 | 18 | 17.1 | 307.9 |
| 16 | 18 | 20.56 | 370.0 |
| 17 | 18 | 21.51 | 387.1 |
| 18 | 18 | 16.18 | 291.3 |
| 19 | 18 | 17.64 | 317.5 |
| 20 | 18 | 16.45 | 296.1 |
| 21 | 18 | 19.61 | 353.0 |
| 22 | 18 | 18.84 | 339.2 |
| 23 | 18 | 26.02 | 468.3 |
| 24 | 18 | 23.8 | 428.4 |
| 25 | 18 | 25.51 | 459.2 |
| 26 | 18 | 17.66 | 317.9 |
| 27 | 18 | 18.02 | 324.5 |
| 28 | 18 | 16.18 | 291.4 |
| 29 | 18 | 16.01 | 288.1 |
| 30 | 18 | 19.08 | 343.6 |
| Mean | 19.962 | 359.3566667 | |
| SD | 3.420702086 | 61.56008382 |
Table 2: Breaking Load and Mean Shear Bond Strength of Group-B.
| Groups | N | Mean | Standard Deviation |
|---|---|---|---|
| Group A | 30 | 22.616 | 3.404 |
| Group B | 30 | 19.962 | 3.421 |
Table 3: Comparison of mean shear bond strength.
Profilometry Test
Surface roughness after etching with conventional acid etching was more than SEP, Mean surface roughness of Transbond-XT was much greater than Transbond Plus SEP. Table 5 shows correlation between SBS and surface roughness done with t-test. There was statistically highly significant (p<0.001) mean difference in between surface roughness and SBS of Transbond-XT and Transbond Plus SEP.
| Source | Degree of freedom | Sum of squares | Mean sum of squares | Variance Ratio (f) | P value or level of significance (p) |
|---|---|---|---|---|---|
| Groups | 2 | 1198.22 | 599.11 | 60.15 | 0.0001 |
| Error | 87 | 866.55 | 9.96 | - | - |
| Total | 89 | 2064.77 | - | - | - |
Table 4: (ANOVA) test for evaluation of differences in the mean shear bond strength.
| Group | SBS Mean + SD (Mpa) | Surface Roughness Mean + SD (µm) | t | p-value |
|---|---|---|---|---|
| Transbond-XT | 22.61 + 3.40 | 0.205 + 0.0038 | 5.296 | < 0.001 |
| Transbond Plus SEP | 19.96 + 3.42 | 0.191 + 0.0036 | 5.878 | < 0.001 |
Table 5: Correlation between SBS and surface Roughness done with t test.
Scanning Electron Microscope Evaluation of Enamel Adhesive Interface
Group-A, treated with Transbond-XT, the SEM images showed an interface between enamel and adhesive with many long, thick resin tags that had penetrated into the enamel surface to the length that varied from a few microns to more than 20 microns (Figure 12). The typical prism structure of the enamel was lost not only on the superficial surface but also in the deeper parts not reached by the resin tags. There were cracks observed on the superficial enamel surface. These findings were consistent in all the three magnifications (Figure 12).
Group-B, treated with the Transbond Plus SEP showed resin tags which were thinner, fewer and shorter than those seen when the teeth were exposed to phosphoric acid (Figure 13a). Cracks were observed in the adhesive structure however there were no cracks visible in the enamel structure (Figure 13b).
Discussion
In the first part of the present study shear bond strength of two different light cure bonding adhesives have been evaluated. The present study showed that conventional light cure composite adhesive Transbond-XT had more bond strength of 22.6 MPa with a standard deviation of 3.4 MPa followed by Transbond Plus Self-etching Primer at 19.6 MPa with a standard deviation of 3.42 MPa. This result is in accordance with the study of Grubisa, et al. [4]. According to Lopez JI [5] minimum bond strength of 7Mpa is required for successful clinical bonding. Both the mean shear bond strength values of the light cure bonding agents used in the present study were above the minimal requirements as mentioned above and hence, are within clinically acceptable range. Group-A, the SEM images showed an interface between enamel and adhesive with many long, thick resin tags that has penetrated into the enamel surface (Figure 12b) and cracks on the superficial enamel surface (Figures 12 a-c). Group-B showed resin tags which were thinner, fewer and shorter (Figure 13b). Cracks were observed in the remnant adhesive structure only (Figure 13a). Longer and thicker tags were visible with the phosphoric acid treatment compared with the self-etching system, similar to the observations by Torii, et al. [6].
Cracks in the enamel surface was observed only in Group-A and the reason for this can be too high shear bond strength levels that carry the risk for enamel fracture during debonding process. These findings corroborate with the findings of Douglas R, et al. [7] who showed that the greatest frequencies for enamel fracture upon debonding occurred in the groups showing the highest bond strengths i.e., Transbond-XT in their study.
Charles A, et al. [8] used three different surface treatments of enamel i.e. conventional acid etching with 37% phosphoric acid, air abrasion with 50 microgram aluminium oxide and bur abrasion with #330 Diaburs and found that air abrasion produced the least bond strength and showed highest frequency of bond failure at enamel adhesive interface.
Abhinay Sorake, et al. [9] in their study compared SBS of conventional adhesives and self-etching primers containing antimicrobial monomer and self-etching primers not containing antimicrobial monomer. In their study they revealed that self-etching primers have SBS comparable to conventional adhesives, however added advantage of inhibitory effect on growth of bacteria on their surface makes them the material of choice in contemporary orthodontics. Sachdeva A, et al. [10] compared Transbond -XT with Transbond Plus and G-BOND and found that Transbond -XT has the highest SBS followed by G- BOND and lowest SBS was with Transbond Plus. Gandhi G, et al. [11] concluded from their study, that a more conservative etch pattern and a less adhesive penetration was produced by Transbond Plus SEP than when 37% phosphoric acid and a separate primer is used for bonding and this also corroborates with our present study.
Alavi S, et al. [12] in their study, compared the shear bond strength and enamel surface changes between the two step etching and primer and self-etch primer methods in rebonding of orthodontic brackets. They concluded that the mean SBS values of CEP and SEP methods were not significantly different. Moreover, SEP method showed lower enamel damage in Scanning Electron Microscope analysis.
Both the bonding systems used in the present study induced different effects on the enamel structure. The possible lower bond strength of the bonding systems based on conditioning the enamel surfaces with a self-etching primer might be outweighed by fewer irreversible effects on the enamel structure on debonding.
Conclusion
The adequate bond strength of self-etching primers, less deleterious effects on the enamel and less chair side time due to absence of acid etching makes it a good option for routine use in orthodontics. However, further in-vivo evaluation following a full period of routine orthodontic treatment is required to validate the findings of the present study.
References
-
Buonocore MG (1955) A simple method of increasing the adhesion of acrylic filling materials to enamel surface. J Dent Res 34(6): 849-853.
-
Buonocore MG, Matsui A, Gwinnett AJ (1968) Penetration of resin dental materials into enamel surfaces with references to bonding. Arch Oral Biol 13(1): 61-70.
-
Newman GV (1965) Epoxy adhesive for orthodontic attachments: A progress Report. Am J Orthod 51(12): 901-912.
-
Grubisa HSI, Heo G, Raboud D, Glover KE, Major PW (2004) An evaluation and comparison of orthodontic bracket bond strengths achieved with self-etching primer. Am J Orthod Dentofacial Orthop 126(2): 213- 219.
-
Lopez JI (1980) Retentive shear strengths of various bonding attachment bases. Am J Orthod 77(6): 669-678.
-
Torii Y, Itou K, Hikasa R, Iwata S, Nishitani Y (2002) Enamel tensile bond strength and morphology of resin- enamel interface created by acid etching system with or without moisture and self-etching priming system. J Oral Rehabil 29(6): 528-533.
-
Douglas R, Timothy FF, Mamandras FA (2001) Comparison of bond strength of three adhesives: composite resin, hybrid GIC, and glass-filled GIC. Am J Orthod Dentofacial Orthop 119(1): 36-42.
-
Charles A, Senkutvan R, Ramya RS, Jacob S (2014) Evaluation of shear bond strength with different enamel pretreatments: An In vitro study. Indian J Dent Res 25(4): 470-474.
-
Sorake A, Rai R, Hegde G, Suneja R, Kumar N, et al. Comparison of shear bond strength of new self-etching primer with conventional self-etching primer: An In vitro study. J Int Oral Health 7(7): 17-21.
-
Sachdeva A, Raghav S, Goel M, Tiwari S (2017) A comparison of the shear bond strength of the conventional acid etching, self- etching and single bottle self- adhesive-An In vitro study. Indian J Dent Sci 9(3): 170-175.
-
Gandhi G, Kalra J, Goyal A, Sharma A (2018) Microphotographic assessment of enamel surface using self-etching primer and conventional phosphoric acid: An In vitro Study. Contemp Clin Dent 9(1): 15-19.
-
Alavi S, Ehteshami A (2019) Comparison of shear bond strength and enamel surface changing between the two step etching and primer and self-etch primer methods in rebonding of orthodontic brackets: An in vitro study. Dent Res J 16: 239-244.
- Diagnosis and Management of Mental Nerve Paresthesia Secondary to Apical Periodontitis of Mandibular Second Premolar: A CBCT Based Case Report
- A Randomized, Double Blinded Clinical Trial to Compare the Effect of Oral Premedication (Diclofenac Potassium or Dexamethasone) on Post-Operative Pain Following Pulpectomy
- Modified Lip Repositioning Technique for the Management of Excessive Gingival Display
- Integral Role of Non-Dental Providers and Fluoride Dissemination
- Root Canal Treatment Rate in Deciduous Teeth Among 6-Year- Olds in the Era of Discontinuing Water Fluoridation - Historical Cohort Study
- The Impact of the Notch1 on the Migratory Capacity and the Expression of E-Cadherin and CyclinD1 in Ameloblastoma Cells