Estimation of Flouride Concentration in Drinking Water Sources of Bhilai, Chattisgarh
Background: Fluoride has always been considered as a “double edged sword”. The optimum and judicious use of fluoride has resulted in caries protection whereas injudicious use has resulted in chronic fluoride toxicity, which manifests as dental and skeletal fluoride. Dental fluorosis occurring due to drinking water with high concentration of fluoride is a common public health problem in India. Hence the present study was designed with an aim to estimate fluoride concentration in drinking water source of the people from Bhilai, Chattisgarh. Aim: To estimate fluoride concentration in drinking water source of the people from Bhilai, Chattisgarh. Material and Methods: Eight different samples of ground water was collected from bhiali, Chattisgarh, which is divided into four different areas: kurud (north), Maroda (south), Charoda (east), Nehrunagar (west); all these samples were tested by HI-96759-11 portable photometre and the fluoride concentration was determined. All the data obtained was then further subjected to statistical analysis and a conclusion was inferred regarding the fluoride concentration of drinking water source of the people of Bhilai, Chattisgarh which is essential for an effective fluoride regimen for prevention of dental caries in children. Result: Highest fluoride concentration in Bhilai is found to be 0.52 ± .056 ppm and the lowest being 0.31 ± .148 ppm. So, the fluoride concentration of the ground water in Bhilai is found to be in the range of 0.3-o.6 ppm. Thus, it does not possess any chance to cause dental fluorosis in the people of Bhilai. However, a fluoride supplementation of 0.25mg/day for 3-6yrs children and 0.50mg/day for 6-16yrs children can be done to enhance the prevention of dental caries in the children residing in Bhilai, Chattisgarh.
Introduction
Water, the most abundant and wonderful natural sources upon which most of the human population is dependent. It is very important for survival of all living organisms. Ground water is generally considered to be much clear then surface water. Ground water is most suitable fresh water with nearly balanced concentration of the salt for human consumption. The term groundwater is usually reserved for the subsurface water that occurs beneath the water table in soils and geologic formation that are fully saturated .Having a safe drinking water is an internationally accepted human right (world health organization (WHO 2004). So the drinking water quality should always be evaluated for good health of people [1, 2, 3, 4].
Fluoride has always been considered as a “double edged sword”. The optimum and judicious use of fluoride has resulted in caries protection whereas injudicious use has resulted in chronic fluoride toxicity, which manifests as dental and skeletal fluorosis. Dental fluorosis is an endemic disease occurring in people who consume water having fluoride concentration more than normal levels, that is water with fluoride concentration ranging >1.0 ppm at the time of tooth formation. Fluorotic lesions are usually bilaterally symmetrical and clinical features of dental fluorosis range from few minute white flecks or spots to brown stains with pits on teeth. Children in the age group of 1-12 years are more prone to development of fluorosis since their body tissues are in formative or developmental stage during this period.
Endemic fluorosis is considered to be a major public health problem worldwide as well as in India. More than 60 million people are exposed to risk of fluorosis due to high concentration of fluoride in drinking water. Thus, it becomes imperative to estimate whether fluoride levels in drinking water are within the recommended and accepted levels to prevent dental caries and reduce the risk of dental fluorosis.
Hence the present study was designed with an aim to estimate fluoride concentration in drinking water source of the people from Bhilai, Chattisgarh.
Area of Study
Bhilai city is situated in durg district, c.g (the eastern central part of India). The city is located within the 32 km west from the raipur city. The population of the city is 1,006,407. This is the city which produced steel in large scale. Sampling sites were setup in Bhilai-durg area which was in range of 10 kms close to industrial area. Thus there is increased chance of contamination of ground water because of huge industrial setup nearby.
Materials and Methods
Drinking water source for the people of Bhilai was the ground water found in Bhilai and this water was made available to the people via borewell and handpumps. However, major population relied on hand pump water as their drinking water in everyday life. Thus, hand pump water was selected to be evaluated under this study.
The map of Bhilai was then evaluated properly and Bhilai
was divided into 4 different areas: kurud (north), Maroda (south), Charoda (east), Nehrunagar (west). 2 samples of ground water was taken from each areas which happened to be the major source of drinking water for the people of that area. The spots were identified by the help of nagar nigam, Bhilai. After the collection of samples were done, they were immediately taken to the water treatment plant, nagar nigam, Bhilai; where the estimation of fluoride was done. All the samples were tested by HI-96759-11 portable photometre as shown in Figure 1.
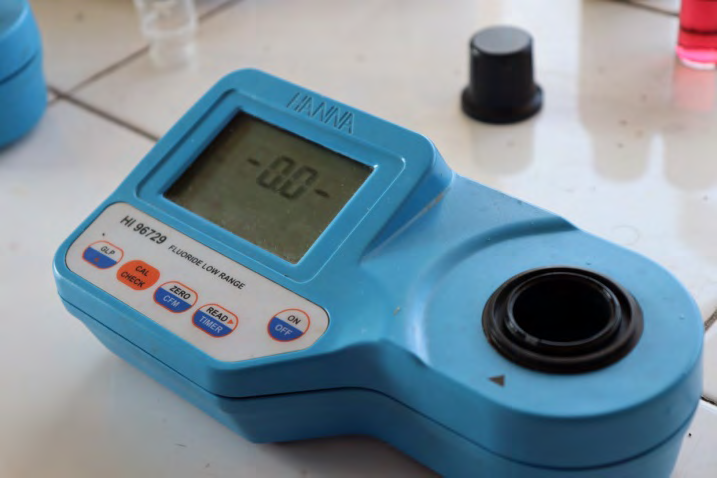
HI-96729-11 is a high quality set of calibration standards that allows users to validate and calibrate the fluoride range found in the compatible HI-96759-11 portable photometers that have a 0.00 to 2.00 mg/L (ppm) fluoride range. The HI-96729-11 includes one sealed “A” cuvette for zeroing the meter and one “B” cuvette that is used to validate or calibrate. The calibration set is produced using reagent grade chemicals in a temperature controlled environment. Thus, all the data obtained was then further subjected to statistical analysis [5, 6, 7, 8].
Statistical Analysis
Mean and Standard deviation of the fluoride concentration was evaluated. Based on the normalcy of the distribution, fluoride concentration was analyzed for all the groups using SPSS version 21. Analysis of Variance (ANOVA) was used, to assess the difference in the mean fluoride concentration between the areas with statistical significance set at p < 0.05. A post hoc Bonferroni test was used to compare results between individual areas. All statistical significance was kept at 95% Confidence Interval and p value less than 0.05 was considered statistical significance.
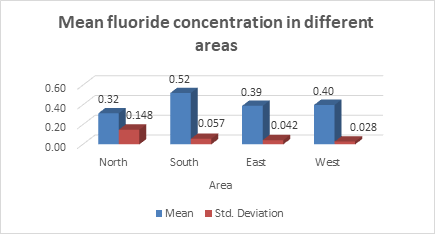
Mean fluoride concentration in different areas is shown in Table 1 and Figure 2.
| Area | N | Mean | Std. Deviation |
|---|---|---|---|
| North | 2 | 0.315 | 0.14849 |
| South | 2 | 0.52 | 0.05657 |
| East | 2 | 0.39 | 0.04243 |
| West | 2 | 0.4 | 0.02828 |
| Total | 8 | 0.4063 | 0.1007 |
Table 1: Mean fluoride concentration in different areas.
Comparison of fluoride concentration between the areas is shown in Table 2.
| Sum of Squares | df | Mean Square | F | P Value | |
|---|---|---|---|---|---|
| Between Groups | 0.043 | 3 | 0.014 | 2.065 | 0.248 |
Table 2: Comparison of fluoride concentration between the areas.
Pairwise comparison of fluoride concentration between the areas is shown in Table 3.
| (I) Area | (J) Area | Mean Difference (I-J) | P value |
|---|---|---|---|
| North | South | -0.205 | 0.42 |
| East | -0.075 | 1 | |
| West | -0.085 | 1 | |
| South | North | 0.205 | 0.42 |
| East | 0.13 | 1 | |
| West | 0.12 | 1 | |
| East | North | 0.075 | 1 |
| South | -0.13 | 1 | |
| West | -0.01 | 1 | |
| West | North | 0.085 | 1 |
| South | -0.12 | 1 | |
| East | 0.01 | 1 |
Table 3: Pairwise comparison of fluoride concentration between the areas.
Result
There were no significant differences in fluoride concentration between the areas. (p>0.05). The mean fluoride concentration in North, South, East and West were .31 ± .148, .52 ± .056, .39 ± .042 and .40 ± .028 respectively [9]. The mean fluoride concentration was found highest in South followed with West. Minimum fluoride concentration was seen in North followed with East.
Discussion
Water is a vital source of fluoride, which may be consumed either directly as a drink or indirectly when added to food or beverages. Fluoride may affect the consumer in any of the three ways: optimal levels of fluoride in water and beverages will result in caries prevention, suboptimal levels will cause increase in dental caries incidence; whereas high level of flouride can result in fluorosis. Several methods of fluoride delivery are available; either in the form of systemic fluoride or topical fluoride [10, 11, 12]. Of all available methods, addition of fluoride to public drinking water has been identified the most economical and the safest delivery system. The main source of systemic fluoride in children is from drinking water, carbonated beverages and other juice drinks. Therefore, determination of exact concentration of fluoride in drinking water is essential for an effective fluoride regimen for prevention of dental caries in children. Thus the fluoride concentration range in water determines the fluoride regimen as mentioned as follows in Table 4.
| Age | < 0.3 | 0.3 to 0.6 | > 0.6 |
|---|---|---|---|
| Fluoride supplement | Fluoride supplement | Fluoride supplement | |
| Birth lo 6 months | |||
| 6 months to 3 years | 0.25 mg/day | ||
| 3 years 10 6years | 0.50 mg/day | 0.25 mg/day | |
| 6 years to 16 years | 1.00 mg/day | 0.50 mg/day |
Table 4: Fluoride Concentration in Drinking water (Parts per Million). This is the first study for estimation of fluoride in grou
Water is essential for all physiological activities associated with humans, animals, and the plant kingdom. However, the nature and the quality of surface and ground water are widely variable and are determined by the local geological history, including the rocks and hidden ore deposits nearby the sites for the assembly of the water, and other issues, such as the effort of fundamental elements and contaminants by lentic and lotic waters and alternative aquifers.
In India, several states are endemic for hydrofluorosis due to the high F content in drinking water. Various reports present conflicting data about the availability and quality of drinking water to the public in the country. The flouride quantities are far above the permissible levels according to national guidelines of drinking water and WHO, USEPA standards. The contamination of water with fluoride is going to develop a serious health problem in coming years.
So, it is important to estimate the fluoride levels in drinking water and after the study we came to know that the level of fluoride in Bhilai is not toxic and the water can be used for drinking. However, for preventing the occurence of dental caries in children of Bhilai fluoride supplementation can be done as stated in the study.
Conclusion
Thus from the result of our study we have come to a conclusion that the highest fluoride concentration in Bhilai is found to be 0.52 ± .056 ppm and the lowest being 0.31 ± .148 ppm. So, the fluoride concentration of the ground water in Bhilai is found to be in the range of 0.3-o.6 ppm. Thus, it does not possess any chance to cause dental fluorosis in the people of Bhilai. However, a fluoride supplementation of 0.25mg/day for 3-6yrs children and 0.50mg/day for 6-16yrs children can be done to enhance the prevention of dental caries in the children residing in Bhilai, Chattisgarh.
References
-
Pandey PC, Kumar P, Yadav M, Katiyar S, Mandal VP, et al. (2015) Vigorous Appraisal of Fluoride on Industrial Proponent in Thermal Power Plant over Anthropoid Biosphere Using F(-) Ion-Selective Electrode. IEEE J Transl Eng Health Med 3: 3700111.
-
Gupta AK, Ayoob S (2016) Fluoride in Drinking Water: Status, Issues, and Solutions. CRC Press, pp: 210.
-
Dhanuthai K, Thangpisityotin M (2011) Fluoride content of commercially-available bottled water in Bangkok, Thailand. J Investig Clin Dent 2(2): 144-147.
-
Curcic M, Mandinic Z, Carevic M, Antonijevic B (2010) Fluoride in enamel samples of 12 years old schoolchildren depending on fluoride content in drinking water. Toxicology Letters 196: S50.
-
Ahiropoulos V (2006) Fluoride content of bottled waters available in Northern Greece. Int J Paediatr Dent 16(2): 111-116.
-
Aldrees AM, Al-Manea SM (2010) Fluoride content of bottled drinking waters available in Riyadh, Saudi Arabia. Saudi Dent J 22(4): 189-193.
-
Beverage Marketing Corporation, 2014. ‘2013 Market Report Findings.
-
Bratovcic A, Odobasic A, Catic S (2009) The advantages of the use of ion-selective potentiometry in relation to UV/VIS spectroscopy. Agric Conspec Sci 74: 139-141.
-
Burton LE, David C, Davis OS, Tinanoff N, et al, (1992) Comparison of colorimeter and electrode analysis of water fluoride. Pediatr Dent 14(1): 47-49.
-
Ceci QV, Paulo F (2015) Fluoride concentration in bottle water. Cad Saude Clet 23(4): 460-467.
-
Ali S, Fakhri Y, Golbini M, Thakur SK, Alinejad A, et al. (2019) Concentration of fluoride in groundwater of India: A systematic review, meta-analysis and risk assessment. Groundwater for Sustainable Development 9: 100224.
-
Sankhla MS, Kumar R (2018) Fluoride Contamination of Water in India and its Impact on Public Health. ARC Journal of Forensic Science 3(2): 10-15.
-
Amiya K, Mishra PK, Biswas A (2020) Assessment of origin and distribution of fluoride contamination in groundwater using an isotopic signature from a part of the Indo-Gangetic Plain (IGP), India. Hydro Research 3: 75-84.
- Diagnosis and Management of Mental Nerve Paresthesia Secondary to Apical Periodontitis of Mandibular Second Premolar: A CBCT Based Case Report
- A Randomized, Double Blinded Clinical Trial to Compare the Effect of Oral Premedication (Diclofenac Potassium or Dexamethasone) on Post-Operative Pain Following Pulpectomy
- Modified Lip Repositioning Technique for the Management of Excessive Gingival Display
- Integral Role of Non-Dental Providers and Fluoride Dissemination
- Root Canal Treatment Rate in Deciduous Teeth Among 6-Year- Olds in the Era of Discontinuing Water Fluoridation - Historical Cohort Study
- The Impact of the Notch1 on the Migratory Capacity and the Expression of E-Cadherin and CyclinD1 in Ameloblastoma Cells