Optical Coherence Tomography Angiography in Glaucoma: Literature Review and Case Report
Objective: To describe the main uses of angiography by optical coherence tomography (OCT-A) in glaucoma, its main characteristics and potential uses as a diagnostic tool described in the literature. Study design: Literature review Methods: Review of medical literature using PubMed and Scopus between 2013 and 2017. Conclusions: Changes at papillary, peripapillary and macular capillary levels may lead to a more accurate and even an early diagnosis of glaucoma, leading us to think about possible earlier findings in the OCT-A compared to classical changes in the visual field and optical coherence tomography (retinal nerve fiber layer). Additionally, its potential use in the detection of progression should be evaluated, allowing a better monitoring of the disease.
Introduction
Glaucoma is a chronic, progressive and multi factorial disease. It is still unclear whether a reduction in the retinal and optic disc blood flow may be the first detectable alteration, or if, on the other hand, once there is a reduction in the nerve fiber layer of the retina, deterioration in the blood vessels is consequently generated. Perhaps people with migraine tend to develop more glaucoma. Fluoresce in angiography – AF has been the gold standard in the diagnosis of retinal diseases, it allows the evaluation of the retinal vasculature, while the doppler evaluates greater caliber vessels [1, 2, 3, 4, 5, 6]. Even the use of magnetic resonance imaging (MRI) has been postulated as an imaging method to evaluate perfusion of the optic nerve head (ONH), however it has low resolution, long acquisition time, and relatively high cost [7]. Recently, angiography by optical coherence tomography (OCT-A) has shown comparable results to those described with fluoresce in angiography [8]. The main advantages of the OCT-A are no need of contrast medium, faster image acquisition time, precision, and a good resolution; In addition, it allows the evaluation of retinal vessels both structurally and functionally, leading recent studies towards evaluating its possible diagnostic value in ocular hypertension and glaucoma [9]. The acquisition of OCT-A images is achieved through the addition of multiple A-scan images with which B-scan images, subsequently making a correlation of several of these scans with successive explorations that are obtained sequentially in the same location; the OCT-A image is generated, which allows us to evaluate the vascular changes of the retina [3, 4, 6, 7, 10, 11, 12]. This is possible thanks to several protocols such as; the Split- spectrum amplitude decor relation angiography (SSADA), optical micro angiography (OMAG), OCT angiography ratio analysis (OCTARA) among others.
Reduction of Capillary Density In Glaucoma
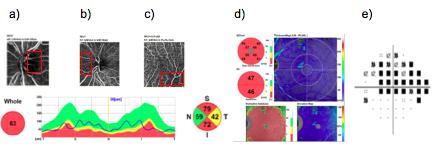
The reduction of the vascular density can be a good indicator and predictor of glaucomatous pathology [14, 15]. Recent studies focus on the retinal and choroidal vessel density, offering potential to assist in the diagnosis and progression of glaucoma severity. The vessels are evaluated mainly in three areas: the disc vessels, the peripapillary area and the macular area. Most of these studies agree that a reduction in vessel density in all areas is found, but the area of greatest diagnostic value and that correlates best with glaucoma damage, is the peripapillary area; although these studies differ on where the measurement around the disk should be taken [16, 17, 18]. In addition, it has been found that the diagnostic capacity of the detection of vascular alterations increases significantly with the severity of glaucoma. Kumar et al. evaluated the spacing of small and large caliber vessels in patients with different glaucoma severity, they found that normal eyes have higher vessel density, fewer spacing between large and small vessels (compared to patients with advanced stages of glaucoma) [2]. (Figure 1) Image of a patient with advanced glaucoma in which a reduction in vascular density in the superficial layer of the retina is observed by OCT-A, and the corresponding visual field and OCT of the patient's optic disc.
the peripapillary area, is reported in patients with glaucoma compared with controls. These vascular changes are also detectable in patients with ocular hypertension (OHT); in whom there is a significant reduction of capillaries in different retinal areas, without changes in the visual field or RNFL [19, 20, 21].
Correlation between OCT-A and the Visual Field
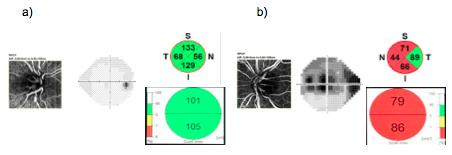
The functional deterioration in glaucoma is evaluated fundamentally by means of the visual field (VF). It has been found that the reduction of capillary density in different layers of the retina correlates with the localization of the visual field defect and have a strong association with the visual field loss expressed as mean deviation (MD) and visual field index (VFI). In addition, as a potential marker of the severity of glaucoma, an association between changes in the visual field and the reduction of the microvasculature of the peri-papillary deep layer has been observed [20, 22, 23, 24, 25]. In a case report study, the focal micro vascular reduction was reproducible on the side corresponding to the defects in the VF in most eyes with POAG, The reduction in the thickness of the RNFL was significant; not only in the corresponding location of the VF defects, but also in the non-corresponding locations, suggesting that the vascular alterations could be more related to the campimetric defects, than with the structural defects (RNFL). This is concordant with results shown by Yarmohamma di, et al. who evaluated patients with glaucoma with visual field involvement of a single hemi field, a decrease in the peri-papillary and macular vascular measurements was found, as well as the thickness of the nerve fiber layer in the circumpapillary retina (cpRNFL) and macular ganglion cell complex (mGCC) in the affected hemiretins [26]. On the other hand, areas of lower vascular density could be detected, even in the intact hemi retinas of the eyes with glaucoma, compared with peripapillary and macular regions of healthy eyes. These findings suggest that vascular changes may precede the detectable changes in VF in the peri- papillary and macular regions of the apparently normal hemiretins of glaucomatous eyes. Akagi, et al. suggested that OCT angiography could provide new structural parameters that can potentially be used to diagnose glaucoma in early stages, demonstrating a reduction in vessel density in patients with pre perimetric glaucoma compared with control patients without glaucoma [27]. Kwon, et al. evaluated whether there is an increase in the diameter of the avascular foveal zone (ZAF) or if there is an alteration on the shape with OCT-A [28]. They evaluated patients with glaucoma who had central visual field defects (CVFDs) and reported that the area of the ZAF was higher in the group with CVFDs and the vessel density on this area was lower than in the group with peripheral defects. Concluding that the eyes of GPAA with CVFDs confined to a single hemi field had a larger and less regular ZAF area than those of the group with peripheral defect in the visual fields [23]. The correlation between the camp metric defects and the vascular density by means of OCT-A, tries to define if with this new tool it is possible to predict the place where a defect will be generated in the visual field. (Figure 2) Structure-function correlation is found; the visual field defect not only corresponds well with the RNFL and the CCG, but also with the location of a lower vascular density area.
Correlation of RNFL and Retinal Vessel Density
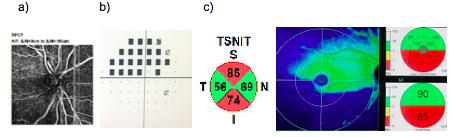
The second aspect that has great importance in the diagnosis and monitoring of glaucoma is the thickness of the retinal nerve fiber layer. Structural defects detected by spectral domain optical coherence tomography (OCT- SD) could correlate well with alterations at the vascular level and could anticipate RNFL glaucomatous damage. Lee et al. studied the circulation of the peri-papillary retina using the OCT-A centered on the head of the optic disc in 98 eyes with POAG with RNFL localized defects, and 45 eyes of healthy controls. A decrease in microvasculature density of the peripapillary retina was identified in 100% of the eyes with POAG at the site of glaucomatous damage with an excellent topographic relationship with the RNFL defect area, while none of the healthy eyes exhibited a reduction in the vasculature. These findings suggest that a decrease in the microvasculature identified on OCT-A probably represents the secondary loss of capillaries, which occurs combined with the loss of RNFL. Because RNFL and GCC thickness measurements by OCT-SD have become important for the assessment of glaucoma; for their reliable values and good correlation with different stages of glaucoma, it seems to be important to evaluate how much concordance exists between these findings and those reported by the OCT-A [29]. It has been reported that the density of vessels in the entire field is as good as the thickness of RNFL to differentiate healthy patients from those with glaucoma. In a cross-sectional study, the diagnostic capabilities of optic nerve head (ONH), peripapillary, and macular vessel density measurements were compared in optical coherence tomography angiography in eyes with POAG and layer thickness of peripapillary RNFL and of the macular ganglion cell complex (CCG) [30]. It was found that the density of the vessels in OCT- A of the ONH, peripapillary and macular regions in GPAA were significantly lower than the thickness of the peripapillary RNFL and the macrometric measurements of the CCG thickness, respectively. Rao, et al. indicated that, as expected, the diagnostic capability of vessel density and structural measures increased with the severity of glaucoma. Wang, et al. found that flow rates and vessel density values decreasing were good indicators of eye damage in POAG, especially in severe stages; in addition they reported that there was a close correlation between vessel flow and density index, MD, thickness of RNFL and GCC, suggesting that angio-OCT may also be useful to monitor progression of POAG [31]. (Figure 3) Lower vascular is observed in the most superficial layer of the retina by OCT-A in a right eye due to advanced glaucoma [32].
suggest that a high IOP affects the RNFL measurements before affecting the vessel density. An interesting finding of this study was the variability in the diagnostic capacity of the peripapillary RNFL and the vessel density through the different stages of PACG. In the early stages of VF loss, the sensitivity of peripapillary RNFL thickness was better than the vessel density, not supporting their hypothesis that the reduction of vessel density occurs after structural changes in PACG, and is likely secondary to the loss of retinal ganglion cells (RGCs) and their axons. However, in more advanced stages of glaucoma (MD in VF between -20 to - 30 dB), the diagnostic capacity of the peri-papillary vessel density seems to be better than the peri-papillary RNFL thickness. The limited usefulness of traditional OCT in advanced glaucoma has been attributed to the floor effect, with the RNFL and GCC thickness showing few changes with the increasing severity of glaucoma. Measurements of vessel density may devoid the floor effect and may be better at detecting progression in advanced glaucoma.
Defects at the Level of the Lamina Cribrosa and its Relationship with OCT-A
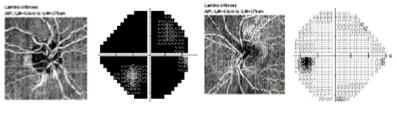
Among the possible theories postulated in the glaucoma damage, it has been said that the lamina cribrosa could play an important role in the pathophysiology of glaucoma [33]. Hee Suh, et al. in their study of 82 patients with POAG, 41 with focal defect of lamina cribrosa (LC) and 41 without defect, measured of the circumpapillary vessels density (cpVD) by means of Angio OCT. The cpVD in the RNFL were significantly lower in the glaucomatous eyes with focal defects of the LC compared with the eyes without defects, while the severity of the glaucoma did not differ between the 2 groups. The lowest cpVD was more pronounced in the superior-temporal (ST) and inferior-temporal (IT) sectors and also showed a topographic correlation with the LC defect. In another study OCT angiography detected flow from all the depths of the disc from the internal surface to the LC which had a dense vascular network in the normal eye and a slightly attenuated in the eye with glaucoma [34]. The disk flow rate in the glaucoma group was 25% lower compared to the normal group. (Figure 4) Image of an OCT angiography of a patient showing a decrease in vascular density at the level of the cribriform plate [35].
Future Perspectives
Studies are required to standardize the parameters of the findings provided by OCTA, so that it can be used for glaucoma diagnosis and progression OCT angiography may also be useful for evaluating neurodegenerative diseases, such as Alzheimer's, due to the vascular component within their pathophysiology, which has been seen to compromise even the retina, showing vascular changes in doppler, with reduction of the lumen and deposits of amyloid-β in the vessels. As in glaucoma and Alzheimer's, OCT-A may help us understanding the blood flow role in other neurodegenerative diseases such as Parkinson's, schizophrenia and multiple sclerosis [36, 37, 38, 39, 40].
Conclusion
There is a correlation between alterations of the visual field and vascular changes in the corresponding retina and it is possible to differentiate the stages of glaucoma through OCT-A. Although the findings of these studies are promising, it has not yet been possible to clearly elucidate whether the vascular alterations precede the structural changes or vice versa. Longitudinal studies are required to understand the future role of OCT angiography in glaucoma and to find the vacuum of knowledge that complements along with the visual field and the OCT-DS, the diagnosis and follow-up of patients with glaucoma.
References
-
Mansouri K (2016) Optical coherence tomography angiography and glaucoma: searching for the missing link. Expert Rev Med Devices 3(10): 879-880.
-
Kumar RS, Anegondi N, Chandapura RS, Sudhakaran S, Kadambi SV, et al. (2016) Discriminant Function of Optical Coherence Tomography Angiography to Determine Disease Severity in Glaucoma. Invest Ophthalmol Vis Sci 57(14): 6079-6088.
-
Chalam K, Sambhav K (2016) Optical coherence tomography Angiography in retinal diseases. J Ophthalmic Vis Res 11(1): 84-92.
-
Wylęgała A, Teper S, Dobrowolski D, Wylęgała E (2016) Optical coherence angiography: A review. Medicine (Baltimore) 95(41): e4907.
-
Yu S, Lu J, Cao D, Liu R, Liu B, et al. (2016) The role of optical coherence tomography angiography in fundus vascular abnormalities. BMC Ophthalmol 16: 107.
-
Choi W, Mohler KJ, Potsaid B, Lu CD, Liu JJ, et al. (2013) Choriocapillaris and choroidal microvasculature imaging with ultrahigh speed OCT angiography. PLoS One 8(12): e81499.
-
Akil H, Falavarjani K, Sadda S, Sadun A (2017) Optical coherence tomography angiography of the optic disc; an overview. J Ophthalmic Vis Res 12(1): 98-105.
-
Gao SS, Jia Y, Zhang M, Su JP, Liu G, et al. (2016) Optical Coherence Tomography Angiography. Invest Ophthalmol Vis Sci 57(9): 27-36.
-
Souied EH, Querques G (2016) OCT Angiography in Retinal and Macular Diseases. In: Bandello F (Eds.), 55.
-
Koustenis A, Harris A, Gross J, Januleviciene I, Shah A, et al. (2017) Optical coherence tomography angiography: an overview of the technology and an assessment of applications for clinical research. Br J Ophthalmol 101(1): 16-20.
-
Ghasemi Falavarjani K, Al-Sheikh M, Akil H, Sadda SR (2017) Image artefacts in swept-source optical coherence tomography angiography. Br J Ophthalmol 101(5): 564-568.
-
Coscas G, Lupidi M, Coscas F (2016) Heidelberg Spectralis Optical Coherence Tomography Angiography: Technical Aspects. Dev Ophthalmol 56: 1-5.
-
Turgut B (2016) Review Imaging Optical Coherence Tomography Angiography – A General View. 39-42.
-
Wang Q, Chan S, Yang JY, You B, Xing Y (2016) Vascular Density in Retina and Choriocapillaris as Measured by Optical Coherence Tomography Angiography. Am J Ophthalmol 168: 95-109.
-
Rao HL, Pradhan ZS, Weinreb RN, Reddy HB, Riyazuddin M, et al. (2016) Regional Comparisons of Optical Coherence Tomography Angiography Vessel Density in Primary Open-Angle Glaucoma. Am J Ophthalmol 171: 75-83.
-
Hollo G (2016) Intrasession and Between-Visit Variability of Sector Peripapillary Angioflow Vessel Density Values Measured with the Angiovue Optical Coherence Tomograph in Different Retinal Layers in Ocular Hypertension and Glaucoma. PLoS One 11(8): e0161631.
-
Scripsema NK, Garcia PM, Bavier RD, Chui TYP, Krawitz BD, et al. (2016) Optical Coherence Tomography Angiography Analysis of Perfused Peripapillary Capillaries in Primary Open-Angle Glaucoma and Normal-Tension Glaucoma. Invest Ophthalmol Vis Sci. 57(9): 611-620.
-
Lévêque P, Zéboulon P, Brasnu E, Baudouin C, Labbé A (2016) Optic Disc Vascularization in Glaucoma : Value of Spectral-Domain Optical Coherence Tomography Angiography. Journal of Ophthalmology 2016: 1-9.
-
Liu L, Jia Y, Takusagawa HL, Pechauer AD, Edmunds B, et al. (2015) Optical Coherence Tomography Angiography of the Peripapillary Retina in Glaucoma. JAMA Ophthalmol 133(9): 1045-1052.
-
Chihara E, Dimitrova G, Amano H, Chihara T (2017) Discriminatory Power of Superficial Vessel Density and Prelaminar Vascular Flow Index in Eyes with Glaucoma and Ocular Hypertension and Normal Eyes. Investig Opthalmology Vis Sci 58(1): 690-697.
-
Mammo Z, Heisler M, Balaratnasingam C, Lee S, Yu DY, Mackenzie P, et al. (2016) Quantitative Optical Coherence Tomography Angiography of Radial Peripapillary Capillaries in Glaucoma, Glaucoma Suspect, and Normal Eyes. Am J Ophthalmol 170: 41- 49.
-
Yarmohammadi A, Zangwill LM, Diniz-Filho A, Suh MH, Yousefi S, et al. (2016) Relationship between Optical Coherence Tomography Angiography Vessel Density and Severity of Visual Field Loss in Glaucoma. Ophthalmology 123(12): 2498-2508.
-
Lee EJ, Lee KM, Lee SH, Kim TW (2016) Oct angiography of the Peripapillary retina in primary open-angle glaucoma. Investig Ophthalmol Vis Sci 57(14): 6265-6270.
-
Hee Suh M, Zangwill LM, Isabel Manalastas PC, Belghith A, Yarmohammadi A, et al. (2016) Deep Retinal Layer Microvasculature Dropout Detected by the Optical Coherence Tomography Angiography in Glaucoma 123(12): 2509-2518.
-
Akagi T, Iida Y, Nakanishi H, Terada N, Morooka S, et al. (2016) Microvascular Density in Glaucomatous Eyes With Hemifield Visual Field Defects: An Optical Coherence Tomography Angiography Study. Am J Ophthalmol 168: 237-249.
-
Yarmohammadi A, Zangwill LM, Diniz-Filho A, Saunders LJ, Hee Suh M, et al. (2016) Peripapillary and Macular Vessel Density in Patients with Glaucoma and Single-Hemifield Visual Field Defect. Ophthalmology 124(5): 709-719.
-
Akil H, Huang AS, Francis BA, Sadda SR, Chopra V (2017) Retinal vessel density from optical coherence tomography angiography to differentiate early glaucoma, pre-perimetric glaucoma and normal eyes. PLoS One 1-12.
-
Kwon J, Choi J, Shin JW, Lee J, Kook MS (2017) Alterations of the Foveal Avascular Zone Measured by Optical Coherence Tomography Angiography in Glaucoma Patients With Central Visual Field Defects. Investig Opthalmology Vis Sci 58(3): 1637-1645.
-
Yarmohammadi A, Zangwill LM, Diniz-Filho A, Suh MH, Manalastas PI, et al. (2016) Optical Coherence Tomography Angiography Vessel Density in Healthy, Glaucoma Suspect, and Glaucoma Eyes. Investig Opthalmology Vis Sci 57(9): 451-459.
-
Rao HL, Pradhan ZS, Weinreb RN, Riyazuddin M, Dasari S, et al. (2017) A comparison of the diagnostic ability of vessel density and structural measurements of optical coherence tomography in primary open angle glaucoma. PLOS one 12(3): e0173930.
-
Wang X, Jiang C, Ko T, Kong X, Yu X, et al. (2015) Correlation between optic disc perfusion and glaucomatous severity in patients with open-angle glaucoma: an optical coherence tomography angiography study. Graefe’s Arch Clin Exp Ophthalmol 253(9): 1557-1564.
-
Rao HL, Pradhan ZS, Weinreb RN, Riyazuddin M, Dasari S, et al. (2017) Vessel density and structural measurements of optical coherence tomography in primary angle closure and primary angle closure glaucoma. Am J Ophthalmol 177: 106-115.
-
Suh MH, Zangwill LM, Manalastas PIC, Belghith A, Yarmohammadi A, et al. (2016) Optical Coherence Tomography Angiography Vessel Density in Glaucomatous Eyes with Focal Lamina Cribrosa Defects. Ophthalmology 123(11): 2309-2317.
-
Jia Y, Wei E, Wang X, Zhang X, Morrison JC, et al. (2014) Optical coherence tomography angiography of optic disc perfusion in glaucoma. Ophthalmology 121(7): 1322-1332.
-
Chen CL, Bojikian KD, Gupta D, Wen JC, Zhang Q, et al. (2016) Optic nerve head perfusion in normal eyes and eyes with glaucoma using optical coherence tomography-based microangiography. Quant Imaging Med Surg 6(2): 125-133.
-
Frohman EM, Fujimoto JG FT, Frohman TC, Calabresi PA, Cutter G, et al. (2008) Optical coherence tomography: a window into the mechanisms of multiple sclerosis. Nat Clin Pr Neurol 4(12): 664-675.
-
Fischer VW, Siddiqu A, Yusufaly Y (1990) Altered angioarchitecture in selected areas of brains with Alzheimer’s disease. Acta Neuropathol 79(6): 672- 679.
-
Feke GT, Hyman BT SR, Stern RA, Pasquale LR (2015) Retinal blood flow in mild cognitive impairment and Alzheimer’s disease. Alzheimers Dement (Amst) 1(2): 144-151.
-
Coppola G, Di Renzo AL, Ziccardi L, Martelli F, Fadda A, et al, (2015) 0ptical coherence tomography in Alzheimer’s disease: a meta-analysis. PLoS One 10(8): e0134750.
-
Kur J, Newman EA, Chan-Ling T (2012) Cellular and physiological mechanisms underlying blood flow regulation in the retina choroid in health and disease. Prog Retin Eye Res 31(5): 377-406.
- Screening of Hospital Staff During World Glaucoma Week in a Tertiary Eye Care Centre
- Angioid Streaks with Macular Neovascularization: Clinical Insights from Two Cases
- Giant Kissing Naevus: An Oculoplastic Challenge
- Why Freedom of Vision Should Not Cost the Freedom of Feeling - LASIK in the Climate of Change
- Asymmetric Optic Nerve with Small Disc and Large Cup: A Rare and Challenging Case of Unilateral Optic Nerve Hypoplasia
- Large Angle Exotropia in a Child: A Case Report