A Comparison of Retinal Nerve Fibre Layer Thickness by Spectral Domain Optical Coherence Tomography in Primary Open Angle Glaucoma, Normotensive Glaucoma and Glaucoma Suspect
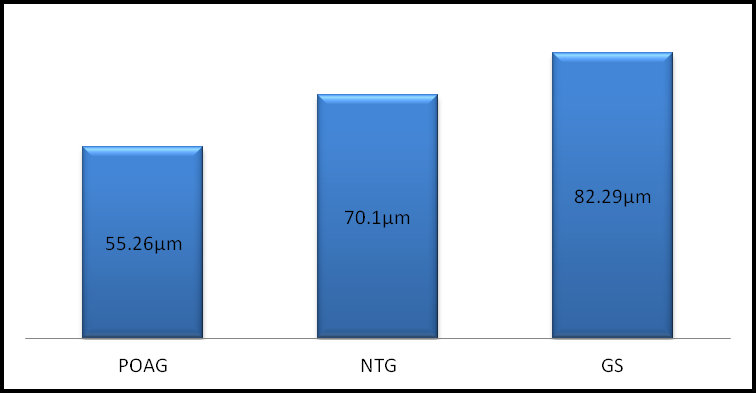
Purpose: To Compare Retinal Nerve Fibre Layer Thickness by Spectral Domain Optical coherence Tomography in primary open angle glaucoma, normotensive glaucoma and glaucoma suspect. Patients and methods: This prospective study included 124 eyes of 67 subjects, average and quadrant RNFL thickness was measured in all these patients. Results: The average RNFL thickness in POAG, NTG and GS groups were 55.26±19.75, 70.1±17.81 and 82.29±10.66 μm respectively, (p= 0.0002) which was statistically highly significant. Same pattern was seen in all the quadrants. Conclusion: RNFL global average thickness, average thicknesses in four quadrants in POAG patients were significantly decreased compared with the NTG and the GS groups and in NTG patients were significantly decreased compared with GS groups.
Introduction
Glaucoma is achronic, progressive optic neuropathies that can lead to irreversible damage to retinal ganglion cells (RGC) and their axons with characteristic visual field defects. In the early stages the disease is largely asymptomatic and it is estimated that only half of glaucoma patients are aware that they have the disease. The diagnosis of glaucoma is based on Visual field loss (VF) or the appearance of the disc, measurement of intraocular pressure or Retinal nerve fiber layer (RNFL) changes. Normotensive glaucoma (NTG) or glaucoma with normal pressure or Low tension glaucoma (LTG) patients are found to have open anterior chamber angles, optic disc changes, typical glaucomatous visual field losses, but with normal or low IOPs. Glaucoma suspects (GS) by disc had evidence of glaucomatous optic disc damage without elevated IOP and did not have detectable visual field defects. Glaucomatous optic disc appearance was defined as vertical cup disc ratio >0.5, focal or diffuse thinning of the neuroretinal rim and asymmetry of the cup disc ratio ≥ 0.2 between two eyes. Quigley et al. reported that up to 40% to 50% of the RNFL could be lost before visual field defects are detected by conventional perimetry [1]. The early detection of nerve fiber layer (NFL) changes is crucial for all patients with glaucoma. Thus RNFL assessment is an important parameter for preperimetric diagnosis of glaucoma.
Several studies have reported differences in OCT- measured RNFL thickness between normal eyes and those with ocular hypertension and early open-angle glaucoma; this suggests that OCT may differentiate between healthy eyes and those with early pressure related damage before other techniques [2, 3, 4, 5, 6, 7, 8]. In this study we aim to measure the thickness of the peripapillary nerve fiber layer in subjects with primary open angle glaucoma (POAG), normotensive glaucoma (NTG) and glaucoma suspect (GS) by Spectral domain-optical coherence tomography (SD- OCT), to determine pattern of RNFL loss in comparing across the groups,to detect structural changes.
Material and Methods
All participants in this study were evaluated at the Manohar Das Regional Institute of Ophthalmology, Allahabad. Informed consent was obtained from each participant. The study was conducted in accordance with the ethical standards was approved by institutional ethics review board with informed consent obtained from all participants.
Inclusion Criteria
Subjects were included if they were Primary open angle glaucoma (POAG), Normotensive glaucoma (NTG) and Glaucoma suspect (GS), of age 18 years or older. All subjects underwent a full ophthalmic examination comprisingvisual acuity (VA) with refraction, Slit lamp biomicroscopy, Intraocular pressure (IOP), Gonioscopy, Fundus examination, Perimetry, and Optical coherence tomography (OCT). The POAG patients were included if all the following criteria were met: (1) Elevated intraocular pressure (IOP) greater than 21mm Hg without treatment on at least two separate visits. (2) Glaucomatous optic disc appearance. (3) Visual Field damage (two or more contiguous points with a pattern deviation sensitivity loss of P<0.01, or three or more contiguous points with a sensitivity loss of p<0.05 in the superior or inferior arcuate areas, and an abnormal result in glaucoma hemifield test). (4) Wide and open angles on gonioscopy. (5) No other obvious causes for these changes.
Exclusion Criteria
(1) History of diabetes mellitus, chorioretinitis, myopic retinal degeneration, retinal laser damage, that might affect VF or retinal thickness. (2) Intraocular surgery except for uncomplicated cataract extraction at least a year prior to enrolment (3) Best corrected visual acuity worse than 6/24. (4) Any ocular abnormality other than glaucoma, evidence of macular disease, refractive or retinal surgery, optic nerve ischemia, optic nerve compressive lesion, narrow angle glaucoma. Intra Ocular Pressure (IOP): Intraocular pressure (IOP) was measured by Schiotz tonometer. The mean of at least 3 reading was taken. Gonioscopy: Gonioscopy was done by Goldman 2 mirror goniolens. Shaffer’s system was used for grading the angle. Evidence of angle recession and angle neo-vascularization, peripheral anterior synachae (PAS), blood in schlemm canal was carefully noted.
Fundus Examination
Optic disc was examined after dilating each pupil with one drop of a mixture of tropicamide 0.8% and phenylephrine 5%. Direct, indirect ophthalmoscope and slit lamp biomicroscopy of the optic disc with +90D lens (Volk) was used. A ratio of vertical diameter of the cup and disc was estimated as the vertical-cup/disc-ratio (VCDR) for each eye. Any asymmetry of the VCDRs (0.2 or more) between two eyes, thinning of the neuro-retinal rim, any notching at the cup margin, laminar dot sign, bayoneting sign, saucerization of the cup, loss of nerve fiber layer, disc pallor and splinter hemorrhages, peripapillary atrophy, nasal shifting of the vessel, and baring of the circumlinar vessels were noted.
Visual Field Examination
Visual field testing was performed using static automated white on- white threshold perimetry (full threshold 30-2, oculus Field Analyzer). A visual field was defined as reliable when fixation loss less than 20 %, false-positive and false-negative errors were less than 33%. Average visual field sensitivity was expressed in visual field index (VFI) and mean deviation (MD) results, as calculated by the perimetry software. A visual field defect was defined as having 3 or more significant (p≤0.05) non edge contiguous points with at least 1 at the p≤0.01 level on the same side of horizontal meridian in the pattern deviation plot and confirmed with at least 2 consecutive examinations.
Retinal Nerve Fiber Layer Imaging by SD- Optical Coherence Tomography
The pupils were nondilated during RNFL imaging. However, dilation was performed when the pupil size was too small (<4mm) to obtain images with the required quality Images with poor centration, motion artifact, poor focus, or missing data were detected by the operator at the time of imaging with rescanning performed in the same visit.
Spectral-Domain Optical Coherence Tomography (SD-OCT)
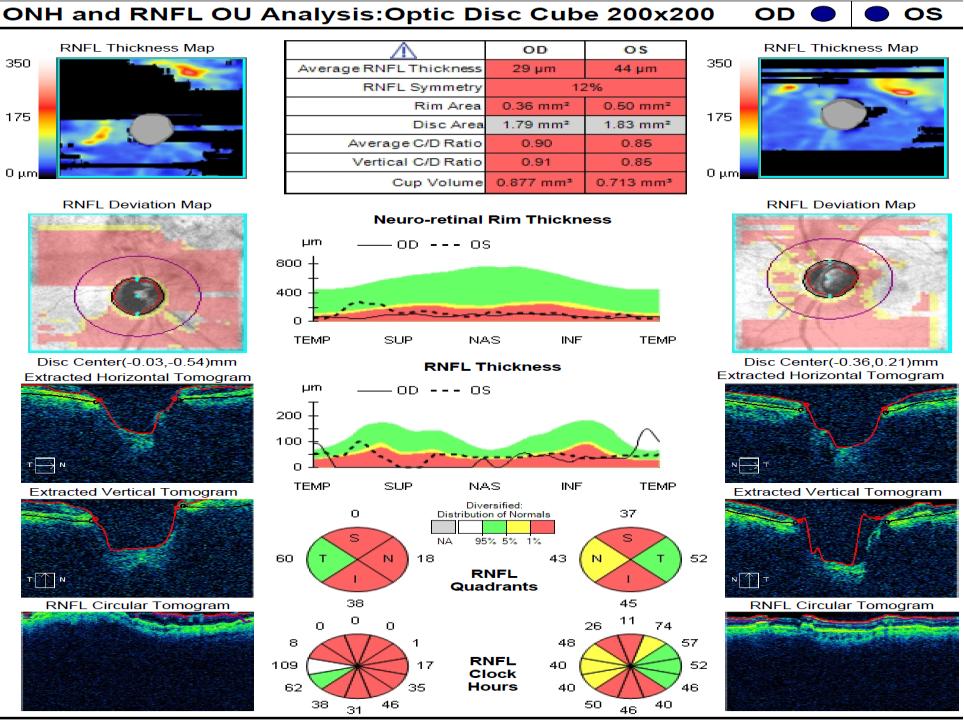
Spectral-domain OCT imaging was performed with the Cirrus HD-OCT (software version 5.0; Carl Zeiss Meditec, Inc.). An optic disc cube scan protocol was used to measure the RNFL thickness in a 6×6-mm2 area consisting of 200×200 axial scans (pixels) at the optic disc region which consists of 1024 (depth) × 200 (vertical) × 200 (horizontal) data points is used for measurement of RNFL thickness. The disc center was identified by finding a circle near the center of the scan that had a shape and size consistent with a range of optic discs. A 3.4 mm circular scan that is used to measure the thickness of the RNFL was positioned automatically around optic disc. The RNFL curve starts with the temporal quadrantand continues clockwise in the right eye and counterclockwise in the left eye. The RNFL thickness values are provided for the four quadrants (temporal, superior, nasal, and inferior) and for12 clock hours. All the OCT scans included in the study had signal strength of ≥ 5.Tested optic nerves are classified as within normallimits, borderline or outside normal limits, after comparing theirRNFL thickness values to those of the normative database. The outcomes are also color coded. Green means within normal limits, yellow, borderline, and red, outside normal limits. Statistical Analysis: This prospective study included 124 eyes of 67 subjects, average and quadrant RNFL thickness was measured in all these patients using SD- OCT. The results was analyzed using SPSS Version 16 and relationships are considered significant if p<0.05. Data were reported as mean±standard deviation (SD). The intergroup differences in sex were analyzed by the chi- square test statistics. The differences between groups in age were defined by one way ANOVA. We also used ANOVA with OCT parameters to test differences between the 3 groups.
Results
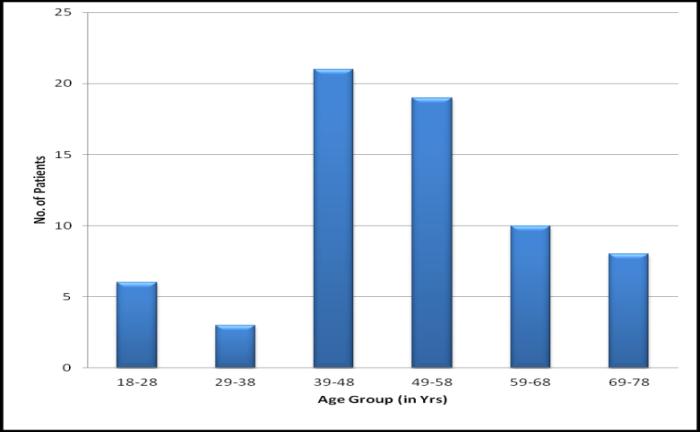
124 eyes of 67 subjects were enrolled for this study. The mean age ± standard deviation (SD) was 50.19±14.05 years (range, 18-78). There was no significant difference of age among 3 groups (P = 0.06). There were 46 males and 21 females (Table 1). Mean ± SD values for average and quadrant RNFLT for various groups is shown in Table 2. The average RNFL thickness in POAG, NTG and GS groups were 55.26±19.75, 70.1±17.81 and 82.29±10.66 μm respectively, (p= 0.0002) which was statistically highly significant. Superior quadrant RNFL thickness among 3 groups were 65.45±27.86, 77.8±30.58 and 106.75±16.47 μm respectively, (p =0.0002 ),inferior quadrant RNFL thickness among the 3 groups were 65.68±32.89, 92.6±30.42 and 103.62±21.84 μm respectively, (p=0.0009), temporal quadrant RNFL thickness in POAG, NTG and GS groups were 42.84±18.86, 54.7±12.99 and 57±11.77 μm respectively (p=0.023),nasal quadrant RNFL thickness in POAG, NTG and GS groups were 44.91±23.79, 49.6±13.99 and 63.95±11.12 μm respectively, (p= 0.0425). There was statistically significant mean difference between average and all quadrants RNFLT between the 3 groups.

| POAG | NTG | GS | |||||||
|---|---|---|---|---|---|---|---|---|---|
| Number of patients | 45 | 10 | 12 | ||||||
| Age(mean±SD) in years | 54.13±11.42 | 39.08±12.61 | 45±18.27 | ||||||
| Males/Females | 34/11 | 7/3 | 7-May |
Table 1: Base line characteristics of sample population.
SD=Standard deviation Table 1: Base line characteristics of sample population.
| RNFLT(μm) | POAG | NTG | GS | p value | ||||||||||
|---|---|---|---|---|---|---|---|---|---|---|---|---|---|---|
| Mean | 55.26±19.75 | 70.1±17.81 | 82.29±10.66 | 0.0002 | ||||||||||
| Superior quadrant | 65.45±27.86 | 77.8±30.58 | 106.75±16.47 | 0.0002 | ||||||||||
| Inferior quadrant | 65.68±32.89 | 92.6±30.42 | 103.62±21.84 | 0.0009 | ||||||||||
| Nasal quadrant | 44.91±23.79 | 49.6±13.99 | 63.95±11.12 | 0.0425 | ||||||||||
| Temporal quadrant | 42.84±18.86 | 54.7±12.99 | 57±11.77 | 0.023 |
Table 2: Baseline retinal nerve fiber layer thickness (RNFLT) in POAG, NTG, GS.
Discussion
Mohamed A. E. Soliman et al. studied for comparison of retinal nerve fiber layer (RNFL) thickness measurements using optical coherence tomography (OCT) to the clinical standard red-free photography, in relation to functional visual field damage in 42 primary open-angle glaucoma (POAG) patients, 34 ocular hypertensives, 25 POAG suspects and25 normal controls [9]. They found that OCT RNFL thickness decreases with increased RNFL damage (detected with red-free photography). The global average OCT RNFL thickness correlated significantly with the photographic total RNFL score (r = .650, P =.0001). Both OCT and photographic scoring system were able to find significantly thinner RNFL in the glaucoma group as compared with normals (P=.0001 for both), ocular hypertensives (P = .0001 for both), and suspects (P =.0001 for both).
Tarek A. El Beltagi, et al. reported 43 patients with open angle glaucomatous optic neuropathy (GON) and who had undergone OCT imaging within 6 months of SAP [10]. They found RNFL thickness in superior quadrant was 119.61(±37.32) μm, in inferior quadrant 116.83 (±37.24) μm, in nasal quadrant 65.87 (±25.62) μm, in temporal quadrant 67.71 (±24.69) μm. In our studyin POAG we found RNFL thickness in superior quadrant was 65.45±27.86 μm, inferior quadrant 65.68±32 μm, temporal quadrant 42.84±18.86 μm, and nasal quadrant RNFL 44.91±23.79 μm. Maziar Lalezary, et al. conducted cohort study [11]. 114 participants were recruited as a glaucoma suspect. The cohort was divided into two groups based on the development of glaucomatous change. Over a 4.2-year average follow-up period, 23 eyes (20%) developed glaucomatous changes and 91 (80%) did not. They found average RNFL thickness in glaucomatous and non-glaucomatous changes were 101±17.3, 107±15.6 (μm) p= 0.14, in superior quadrant 122±17.3, 130±19.7 (μm), p = 0.08, in nasal quadrant 86.0±18.9, 90.3±22 (μm), p = 0.39, in Inferior quadrant 114±25.0, 127±20.7 (μm), p = 0.01, in temporal quadrant 85.2±20.7, 81.9±19.6 (μm), p = 0.48 respectively. In our study we found average RNFL thickness in non- glaucomatous changes were average RNFL thickness 82.29±10.66 μm, superior quadrant 106.75±16.47 μm, inferior quadrant 103.62±21.84 μm, temporal quadrant 57±11.77 μm, nasal quadrant 63.95±11.12 μm.
In a study Ramanjit Sihota, et al. measured the RNFL thickness in primary open-angle glaucoma (POAG) [12]. The average RNFL in control subjects, early glaucoma, moderate glaucoma, severe glaucoma, and blind glaucoma were 102.30±10.34, 77.68±15.7, 66.07±15.5, 53.65±14.2, and 44.93±4.95 μm, respectively. There was a significant difference in all RNFL thickness parameters between normal and all glaucoma subgroups (_P<_0.001). In our study a significant difference was found in RNFL thickness in POAG.
S Popović Suić, et al. assessed whether retinal nerve fiber layer (RNFL) thickness value obtained with optical coherence tomography (OCT) in ocular hypertension patients can predict glaucomatous changes in visual field over a 2-year period [13]. This comparative analysis included 76 eyes: 36 ocular hypertension (OHT) and 40 healthy. They found mean retinal nerve fiber layer thickness (RNFL) in eyes with and without glaucomatous changes were 101±17.3, 108±16.1 p>0.01, in superior quadrant 117±13.5, 121±13.2, p>0.01, in inferior quadrant 115±12.2, 131±12.4, p<.01, in nasal quadrant 95±17.3, 97±15.6, p>.01 and in temporal quadrant 85±12.2, 89±11.3 (μm), p>.01 respectively. In ocular hypertension group, 6 (16.6%) eyes developed SAP glaucomatous abnormalities in 2-year period. In our study we found average RNFL thickness in non-glaucomatous changes were average RNFL thickness 82.29±10.66 μm, superior quadrant 106.75±16.47 μm, inferior quadrant 103.62±21.84 μm, temporal quadrant 57±11.77 μm, nasal quadrant 63.95±11.12 μm. Several studies have shown that OCT RNFL thickness measures from the inferior or inferior temporal hemiretina (corresponding to the 6 o‘clock to 8 o‘clock positions in this study) are the most informative (higher receiver operating characteristic curve areas and increased sensitivity and specificity) when discriminating between healthy eyes and eyes with early to moderate glaucoma [7, 8, 14].
There are several limitations to this study. The sample size in each of the three diagnostic groups was small and the participants were not age matched, so generalizations about these measurements should be made with caution. Despite the small sample size, significant differences among study groups for OCT RNFL thickness were found.
Conclusion
We found that RNFL thickness in superior and inferior quadrants are predictive of glaucomatous change, but the nasal and temporal quadrants are not very much significant. They follow the ―double hump pattern of the peripapillary RNFL contour loss. In our study we found that RNFL global average thickness, average thicknesses in four quadrants in POAG patients were significantly decreased compared with the NTG and the GS groups and in NTG patients were significantly decreased compared with GS groups.
References
-
Quigley HA, Addicks EM, Green WR (1982) Optic nerve damage in human glaucoma III. Quantitative correlation of nerve fiber loss and visual field defect in glaucoma, ischemic neuropathy, papillodema and toxic neuropathy. Arch Ophthalmol 100(1): 135-146.
-
Schuman JS, Hee MR, Puliafito CA, Wong C, Pedut- Kloizman T, et al. (1995) Quantification of nerve fiber layer thickness in normal and glaucomatous eyes using optical coherence tomography. Arch Ophthalmol 113(5): 586-596.
-
Pieroth L, Schuman JS, Hertzmark E, Michael R Hee, Jason R Wilkinset al. (1999) Evaluation of focal defects of the nerve fiber layer using optical coherence tomography. Ophthalmology 106(3): 570- 579.
-
Bowd C, Weinreb RN, Williams JM, Zangwill LM (2000) The retinal nerve fiber layer thickness in ocular hypertensive, normal, and glaucomatous eyes with optical coherence tomography. Arch Ophthalmol 118(1): 22-26.
-
Hoh ST, Greenfield DS, Mistlberger A, Liebmann JM, Ishikawa H, et al. (2000) Optical coherence tomography and scanning laser polarimetry in normal, ocular hypertensive, and glaucomatous eyes. Am J Ophthalmol 129(2): 129-135.
-
Pons ME, Ishikawa H, Gurses-Ozden R, Liebmann JM, Dou HL, et al. (2000) Assessment of retinal nerve fiber layer internal reflectivity in eyes with and without glaucoma using optical coherence tomography. Arch Ophthalmol 118(8): 1044-1047.
-
Bowd C, Zangwill LM, Berry CC, Blumenthal EZ, Vasile C, et al. (2001) Detecting early glaucoma by assessment of retinal nerve fiber layer thickness and visual function. Invest Ophthalmol Vis Sci 42(9): 1993-2003.
-
Zangwill LM, Bowd C, Berry CC, Williams J, Blumenthal EZ, et al. (2001) Discriminating between normal and glaucomatous eyes using the Heidelberg Retina Tomograph, GDx Nerve Fiber Analyzer, and Optical Coherence Tomograph. Arch Ophthalmol 119(7): 985-993.
-
Mohamed AE Soliman, Thomas JTP Van Den Berg, Ismaeil AA, De Jong LA, De Smet (2002) Retinal Nerve Fiber Layer Analysis: Relationship Between Optical Coherence Tomography and Red-free Photography. Am J Ophthalmol 133(2): 187-195.
-
Tarek A El Beltagi, Christopher Bowd, Amini P, Sample PA, Zangwill LM, et al. (2003) Retinal Nerve Fiber Layer Thickness Measured with Optical Coherence Tomography Is Related to Visual Function in Glaucomatous Eyes. Ophthalmology 110(11): 2185-2191.
-
Maziar Lalezary, Felipe A Medeiros, Weinreb RN, Bowd C, Sample PA, et al. (2006) Baseline Optical Coherence Tomography Predicts the Development of Glaucomatous Change in Glaucoma Suspects. Am J Ophthalmol 142(4): 576-582.
-
Ramanjit Sihota, Parul Sony, Viney Gupta, Tanuj Dada, Rajvir Singh (2006) Diagnostic Capability of Optical Coherence Tomography in Evaluating the Degree of Glaucomatous Retinal Nerve Fiber Damage. Invest Ophthalmol Vis Sci 47(5): 2006-2010.
-
S. PopovićSuić, B Cerovski, T Vidović, M Ekert, D Petravić (2010) Prediction of glaucomatous optic nerve damage in ocular hypertension with optical coherence tomography. Neurol Croat 59: 3-4.
-
Greaney MJ, Hoffman DC, Garway-Heath DF, Nakla M, Coleman AL, et al. (2002) Comparison of optic nerve imaging methods to distinguish normal eyes from those with glaucoma. Invest Ophthalmol Vis Sci 43(1): 140-145.
- Screening of Hospital Staff During World Glaucoma Week in a Tertiary Eye Care Centre
- Angioid Streaks with Macular Neovascularization: Clinical Insights from Two Cases
- Giant Kissing Naevus: An Oculoplastic Challenge
- Why Freedom of Vision Should Not Cost the Freedom of Feeling - LASIK in the Climate of Change
- Asymmetric Optic Nerve with Small Disc and Large Cup: A Rare and Challenging Case of Unilateral Optic Nerve Hypoplasia
- Large Angle Exotropia in a Child: A Case Report