To Investigate the Morphologic Alterations in and Around the Optic Disc by Optical Coherence Tomography (OCT) in Eyes with Different Degree of Myopia
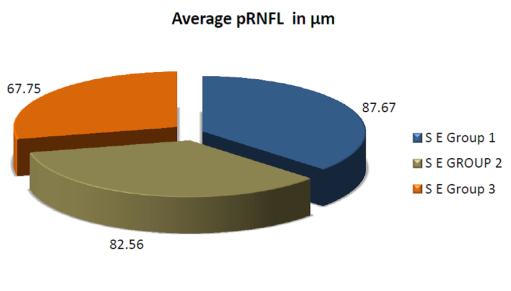
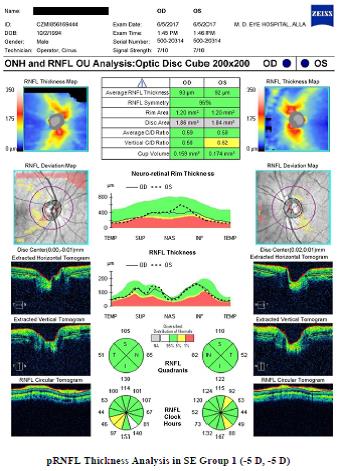
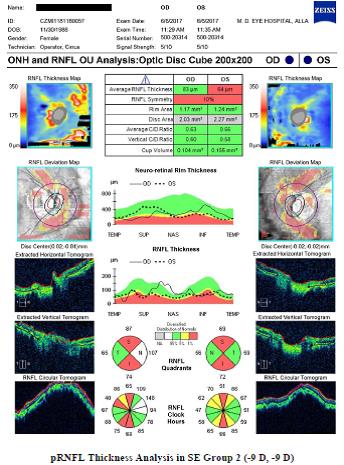
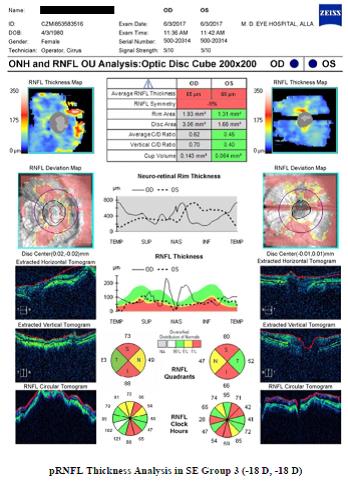
Objective: To investigate the morphologic alterations in and around the optic disc by optical coherence tomography (OCT) in eyes with different degree of myopia. Methods: This prospective study included 110 myopic subjects for evaluation of Peripapillary Retinal Nerve Fiber Layer (pRNFL) pattern in myopia. Results: In our study we observed that in SE Group 1 (-3D to -6D), the average pRNFL thickness, Mean disc area and mean CD Ratio was 87.67 µm, 1.850±0.36, 0.46±0.09 while in SE Group 2 (> -6D to -10D) it was 82.56 µm, 1.89±0.23, 0.49±0.06 and in SE Group 3 (> -10D) the thickness was found to be 67.75 µm, 2.54±0.24, 0.49±0.05 respectively. This decrease in pRNFL thickness is highly statistically significant (p < 0.001) in different groups. Similar results were seen with Al Group 1,2 and 3. Conclusion: Average pRNFL thickness clearly exhibited a decreasing pattern as spherical equivalent and Axial length increases while it is not followed in all quadrants. The average disc area increases however CD ratio remains unchanged as spherical equivalent increases.
Introduction
Myopia is one of the most prevalent variations of the eye. High degree myopia is associated with comorbidities that increase risks of severe and irreversible loss of vision, such as retinal detachment, sub retinal neovascularization, glaucoma and dense cataract.
Recently, reports from population-based prevalence studies carried out in various geographical areas now give a clear picture of the current distribution of refractive error.
The incidence of myopia in Asian countries is extremely high, the elongation of axial length (AL) occurs because increased negative refractive power and certain optic disk features of myopic eyes affect the performance accuracy of OCT [1]. The reported associations between AL and pRNFL thickness vary with different study populations, OCT instruments, and whether ocular magnification is adjusted [2]. Certain studies have shown that the average pRNFL thickness inversely correlated with AL or negative refractive power. By contrast, certain studies have reported a positive relationship between AL and pRNFL thickness [3].
Optical coherence tomography (OCT) has allowed in vivo quantitative analysis of the peripapillary retinal nerve fiber layer (pRNFL) and may be useful in detecting patients with glaucoma and other optic neuropathies. The optic disc as the bottleneck of the whole visual inference is of great importance for the diagnosis of optic nerve anomalies and diseases [4]. Since the morphology, including the measurements of the optic disc, depends on the ethnic background of the subjects [5].
The variation in the normal population needs to be taken into account to distinguish a pathologically from a physiologically thin pRNFL [6]. There is now a normative database available for the HD OCT based on a large sample of normal subjects across a broad range of age and ethnicity [7].
The limited data is available for subjects with a high degree of refractive error that particularly important for myopic patients who not only have an increased risk of developing primary open-angle glaucoma, but whose optic disc appearances are often difficult to interpret and may mask early glaucomatous changes [8, 9]. Subject providing standard measurements of the normal optic nerve head in this population group, and to compare these measurements with the optic disc data of other ethnic groups.
To comparing the results of this study with findings of studies on patients with optic nerve diseases, the results of the present study may also be helpful in describing morphological optic disc parameters for the early detection of optic nerve diseases, including myopic Indian population group [10]. Most of the ophthalmologist opinion are that the assessment of pRNFL thickness by Optical coherence tomography (OCT) can’t be used as a diagnostic parameter to distinguish between glaucoma and normal in different degree of myopia.
However some authors suggested that mathematical shape analysis of pRNFL thickness profile and pattern may be of some importance in differentiating that high myopia with glaucoma and those without glaucoma. Many such type of analysis is still under process. The purpose of this study was to assess pRNFL thickness distribution in a group of non-glaucomatous subjects with a different degree of Myopia, with evaluation and relationship between pRNFL thickness, global and sectorial, and other variables including axial length and optic disc size [11, 12].
Further the present study also aims to evaluate whether pattern module of pRNFL thickness in myopia exhibits some changes which may give some clue to detect presence of glaucoma at the earliest in patients with different degree of myopia.
Material and Methods
This study was carried out from November 2016 to October 2017. Subjects were enrolled at Regional Institute of Ophthalmology (M. D. Eye Hospital, Dr. Katju Road, Nakhas Kona, Allahabad. The study was conducted in accordance with the ethical standards was approved by institutional ethics review board with informed consent obtained from all participants.
It is a prospective cross sectional study. A total of 110 myopic subjects were enrolled consecutively. They were enrolled for the study evaluation of Peripapillary Retinal Nerve Fiber Layer (pRNFL) pattern in myopia, which was designed to investigate the roles of pRNFL imaging for monitoring myopia.
The Inclusion Criteria
Subjects were included if they were (-3 D) more than (-3 D) spherical equivalent and age 18 years or older.
The Exclusion Criteria
- Dense hazy medium,
- History of diabetes mellitus or any other systemic disease,
- History of long term medical treatment that might affect Visual Field or retinal thickness,
- History of previous intraocular surgery,
- Best corrected visual acuity less than 6/12,
- Any ocular abnormality other than myopia.
All subjects underwent a full ophthalmic examination, comprising
3. Refraction, under full mydriasis and Best corrected visual acuity (BCVA) 4. Fundus examination in fully dilated pupil - Direct, indirect ophthalmoscope, and +90D lens (Volk) was used at the slit lamp for optic disc biomicroscopy 5. Optical coherence tomography in fully dilated pupil - Cirrus HD-OCT (software version 5.0; Carl Zeiss Meditec, Inc.) for optic disc and pRNFL thickness 6. Color founds photograph in fully dilated pupi - taken by KOWA VX-10 Fundus Camera Japan 7. Visual field examination - full threshold 30-2, Oculus Field Analyzer 8. Axial length - done by ECHOSCAN US800 V 1.91 NIDEK Japan 9. Anterior segment bio microscopy - examined by DC-3 Digital Slit Lamp Topcon 10. Gonioscopy – done by Goldman two mirror goniolens
Observation and Results
A cross sectional study with 110 subjects is undertaken to study the pRNFL imaging by Cirrus HD- OCT in myopic subjects. The results are analyzed using Statistics Calculators version 4.0 Analysis of Variance (ANOVA) and relationships are considered significant if p<0.001
| Age in years | Number of subjects | Percentage | ||||||
|---|---|---|---|---|---|---|---|---|
| 18-24 | 84 | 76 | ||||||
| >24 | 26 | 24 | ||||||
| Total | 110 | 100 |
Table 1: Age distribution of subjects in study. In this study 51% female and 49% male subjects enrolled which was almost equal in
| Group | Spherical equivalent (D) | Number of subjects | Percentage | ||||||
|---|---|---|---|---|---|---|---|---|---|
| SE Group-1 | -3 to -6 | 42 | 38 | ||||||
| SE Group-2 | > -6 to -10 | 37 | 34 | ||||||
| SE Group-3 | > -10 | 31 | 28 | ||||||
| Total | 110 | 100 |
Table 2: Distribution of subjects in group with degree of myopia.
| Quadrants | Mean pRNFL thickness in μm | ||||
|---|---|---|---|---|---|
| SE Group 1 | SE Group 2 | SE Group 3 | |||
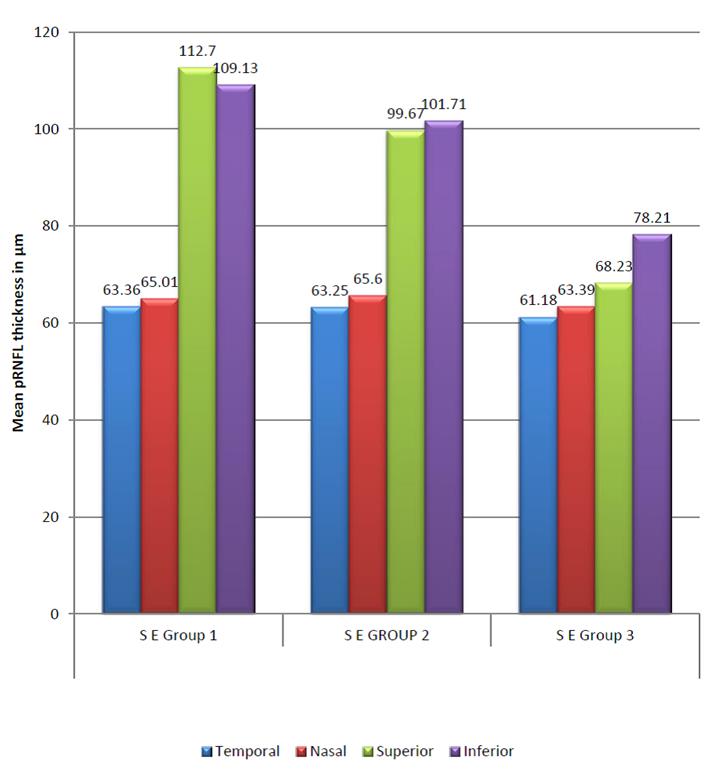
| Temporal | 63.36±9.13 | 63.25±14.87 | 61.18±17.22 | ||
| Nasal | 65.01±14.5 | 65.6±18.12 | 63.39±16.86 | ||
| Superior | 112.7±17.41 | 99.67±15.37 | 68.23±21.02 | ||
| Inferior | 109.13±12.14 | 101.71±14.28 | 78.21±15.38 | ||
| Average | 87.67±7.00 | 82.56±7.00 | 67.75±9.00 |
Table 3: The average pRNFL thicknesses and mean pRNFL thicknesses in μm out of four quadrants measured by Cirrus HD-OCT were comp
| Optic disc variable | Mean disc area in mm² and mean CD Ratio | |||||
|---|---|---|---|---|---|---|
| S E Group 1 | S E GROUP 2 | S E Group 3 | ||||
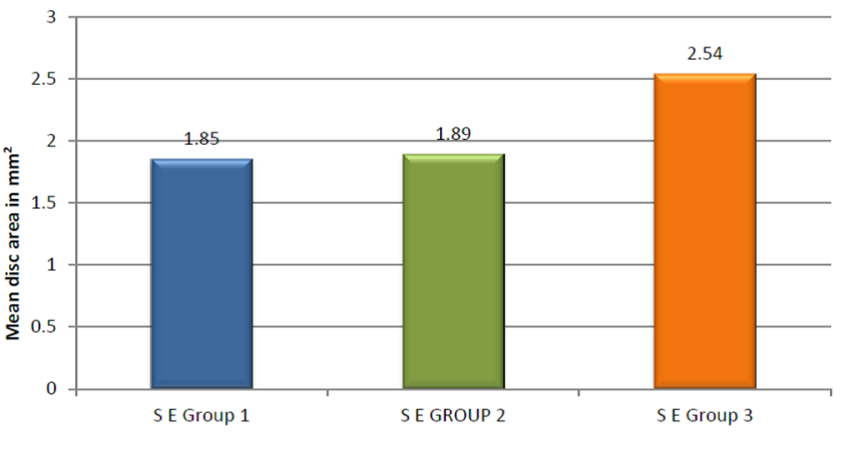
| Disc Area | 1.850±0.36 | 1.89±0.23 | 2.54±0.24 | |||
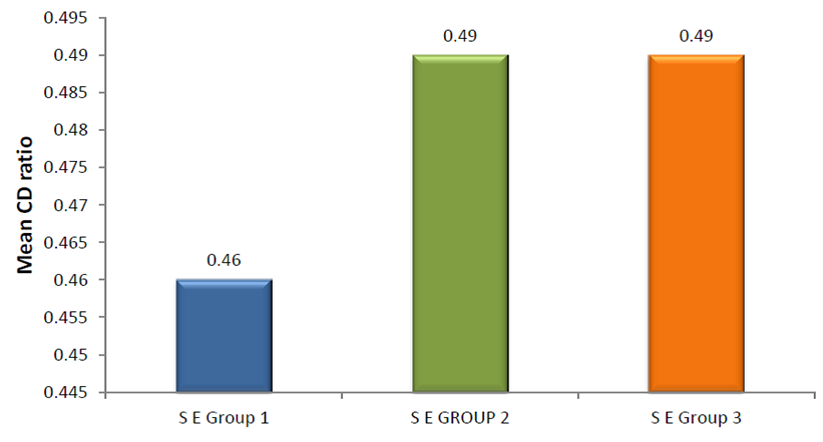
| CD Ratio | 0.46±0.09 | 0.49±0.06 | 0.49±0.05 |
Table 4: Mean disc area in mm² and mean CD Ratio. The average disc area increases however CD ratio remain unchanged as spherical
| Group | Axial length in mm | Number of Patients | Percentage | |||||||
|---|---|---|---|---|---|---|---|---|---|---|
| AL Group-1 | 24 to 26 | 69 | 63 | |||||||
| AL Group-2 | > 26 to 28 | 27 | 24 | |||||||
| AL Group-3 | > 28 | 14 | 13 | |||||||
| Total | 110 | 100 |
Table 5: Distribution of subjects in group with axial length.
| Quadrants | Average and quadrant wise mean pRNFL thickness in μm | ||||
|---|---|---|---|---|---|
| AL GROUP 1 | AL GROUP 2 | AL GROUP 3 | |||
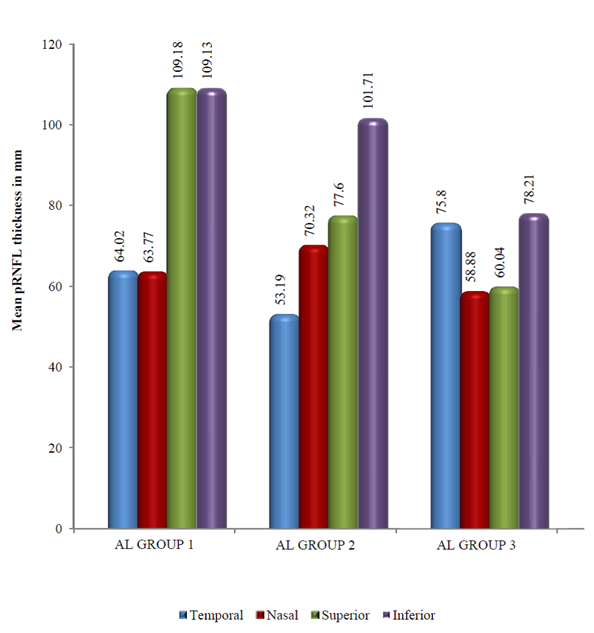
| Temporal | 64.02±12.29 | 53.19±13.31 | 75.8±11.19 | ||
| Nasal | 63.77±14.97 | 70.32±20.49 | 58.88±10.47 | ||
| Superior | 109.18±16.45 | 77.60±20.42 | 60.04±17.09 | ||
| Inferior | 109.13±12.14 | 101.71±14.28 | 78.21±15.68 | ||
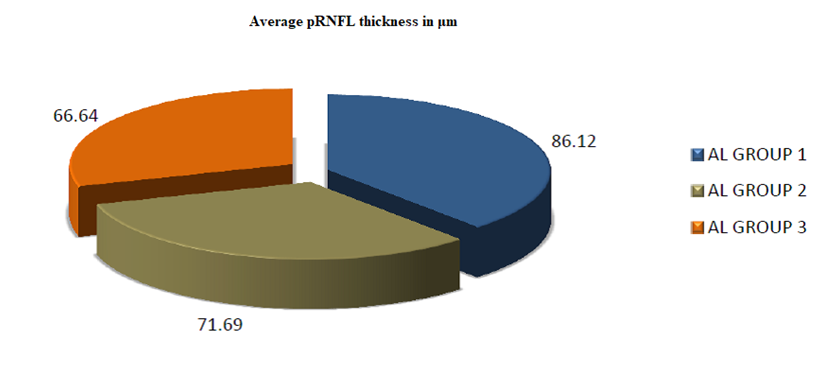
| Average | 86.12±7.26 | 71.69±10.8 | 66.64±7.16 |
Table 6: Average and quadrant wise mean pRNFL thickness in μm.
| Optic disc variable | Mean disc area in mm2 and mean CD ratio | |||
|---|---|---|---|---|
| AL GROUP 1 | AL GROUP 2 | AL GROUP 3 | ||
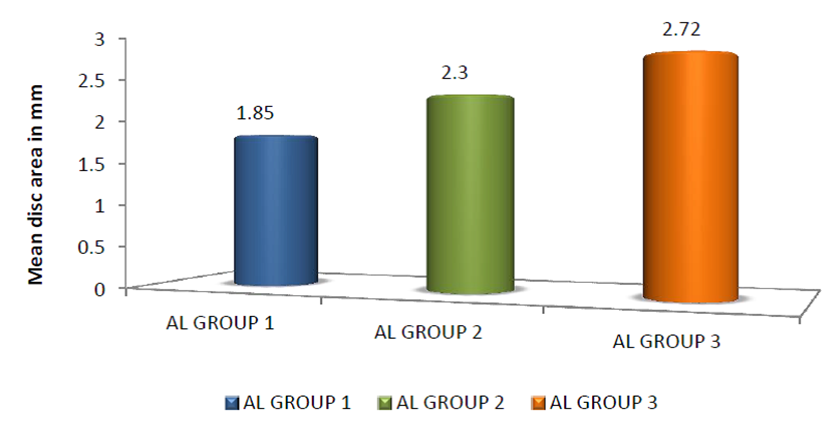
| Disc Area | 1.85±0.32 | 2.3±0.27 | 2.72±0.13 | |
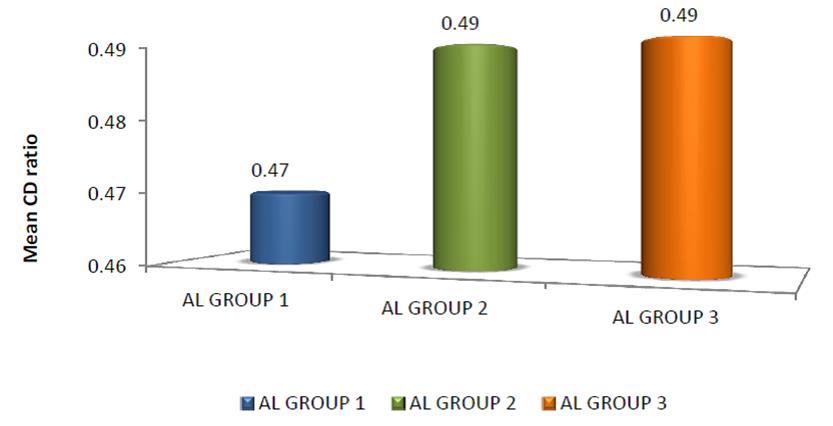
| CD Ratio | 0.47±0.08 | 0.49±0.06 | 0.49±0.04 |
Table 7: Mean disc area in mm² and mean CD ratio.
Discussion
Several techniques for clinical pRNFL evaluation have been described. Ophthalmoscopic examination using red- free light and NFL photography have been used for many years, but these techniques are limited to eyes with clear media and to good cooperation of the patient and are difficult to perform and interpret. The slit-lamp biomicroscopic pRNFL examination and pRNFL photography evaluation are subjective and depend on the experience of the examiner (and also the photographer, as in the case of pRNFL photography).
Other technologies, such as scanning laser polarimetry [1], have been developed to measure the thickness of the NFL. This device is based on changes in polarization of light and retardation, which is related to the NFL thickness. Unfortunately, the NFL is not the only birefringent structure in the eye, and it remains unclear what the effects of corneal and lenticular birefringence and aging are on polarimetric measurements. Polarimetric measurements can be influenced by peripapillary atrophy or chorioretinal scars, which may occur in healthy eyes or eyes with myopia and other diseases.
Optical coherence tomography enables cross-sectional visualization and direct measurement of NFL thickness. Low coherence light is applied through a noncontact, noninvasive instrument and depicts the retinal microstructure with a resolution of 10 µm. There is good correlation of NFL measurements by OCT to histopathologic analysis. The reproducibility of OCT measurements compares well with other currently available ophthalmic instrumentation designed for optic nerve and NFL analysis.
An attempt has been made to differentiate myopic groups on the basis of spherical equivalent and axial length. However; evaluation of pRNFL and optic disc changes constitutes an important part of glaucoma diagnosis but we observe a significant difference in the pRNFL thickness parameters among different groups of myopia [12]. Previous studies have shown that Stratus OCT-generated pRNFL thickness is reliable for differentiating eyes with myopic from glaucomatous eyes.
In our study we observed that as the spherical equivalent increases, there is a definite trend of decrease in average pRNFL thickness. Thus decreased average pRNFL thickness is specifically evident in S E Group 3 which comprised of subjects having high myopia. In quadrant wise analysis maximum decrease in average pRNFL thickness from SE Group 1 to SE Group 3 is observed in superior and inferior quadrant as compared to nasal and temporal. This decrease in pRNFL thickness is highly statistically significant (p < 0.001) in different groups. Similar results are also recorded by various authors. Sung Won Choi, et al. [6] also reported that the decreased thickness of pRNFL was seen on increased spherical equivalent in subjects having myopia of different degree and age between 23 to 26 years, evaluated by Stratus OCT.
Our observation are also in accordance with the findings of Shin Hee Kang, et al. [2] and Geng Wang, et al. [7] evaluated by Cirrus HD OCT, Jing Jing, et al. [9] evaluated by Topcon 3D OCT and performed study upon subjects having almost similar equivalents. Our study specifically exhibited strong resemblance with observation of study of Divya Singh, et al. [12] as age and spherical equivalent of subjects under study of our and there is almost similar. She also reported a decrease in thickness of pRNFL with the increase in spherical equivalent. This decrease in pRNFL thickness is found to be statistically significant. But another study by SA Vernon, et al. [3] assess pRNFL thickness in non- glaucomatous 31 eyes of 31 healthy person with -6 D or > -6 D mean –7.7 D and mean age of 48.1 years, show no statistically significant association between mean pRNFL thickness and spherical equivalent measured by Stratus OCT.
Thus regarding average pRNFL thickness it may safely be concluded that average pRNFL thickness decreases as the spherical equivalent increase. At time there may be minor variation in the amount of average pRNFL thickness in different studies. This minor variation in different studies may probably be because number of subjects having mild, moderate or severe myopia differs from study to study. In a study where number of persons having severe myopia is more may exhibit much more amount of decreased average pRNFL thickness as compared to study where more number of subjects examined was having mild to moderate myopia but overall observation of a decrease in thickness of average pRNFL with increase spherical equivalent may be scientifically accepted.
Other variable the mean superior and mean inferior pRNFL thickness in our groups is showing continuous decreasing order, with the p value of 0.001 and 0.001 respectively which is statistically highly significant. But mean temporal and mean nasal pRNFL thickness showing no definite trend of decrease mean pRNFL thickness in our groups and no statistically significant change of mean pRNFL thickness with the p value of 0.596 and 0.728 respectively. Sung-Won Choi, et al. [6], reported decreasing thickness of pRNFL, an increase in spherical equivalent in subjects having myopia of different degree, evaluated by Stratus OCT. According to this study mean superior, inferior and nasal pRNFL thickness showed statistically significant difference. But the mean temporal pRNFL thickness not showed statistically significant difference in between groups.
Similar study done by Divya Singh, et al. [12], found that mean superior, inferior and nasal pRNFL thickness decreased which was statistically significant (p<0.001). But the mean temporal pRNFL thickness firstly decreased, but later on showed an increasing trend with high myopia measured by Cirrus HD OCT. Jing-Jing, et al. [9] evaluated non glaucomatous healthy myopic subjects, the mean superior and nasal pRNFL thickness decreased on increasing myopia, which was statistically significant, (p < 0.001), measured by 3D OCT. Geng Wang, et al. [7] evaluated that only mean inferior pRNFL thickness decreased statistically significant, and Shin Hee Kang, et al. [2] evaluated that mean temporal and nasal pRNFL thickness increase, superior and inferior pRNFL thickness not exhibit strong correlation with myopia, measured by Cirrus HD OCT. SA Vernon, et al. [3] evaluated pRNFL thickness by Stratus OCT in non-glaucomatous subjects, showed no statistically significant association between mean pRNFL thickness of mean superior, inferior, temporal or nasal quadrants with spherical equivalent.
Thus regarding the variation of mean pRNFL thickness in superior, inferior, temporal or nasal quadrants with spherical equivalent are not in all progressive decreasing order, but most of the study showed that as in our study the superior, inferior pRNFL thickness showed progressive decreasing trend of mean pRNFL thickness which was statistically significant associated with spherical equivalent. The mean nasal and temporal pRNFL thickness did not show any significant changes when spherical equivalent increase.
Our study also showed on increasing degree of myopia, continuous increasing the mean disc area with p value of 0.001 which statistically highly significant but mean CD ratio not statistically significant with p value of 0.011 in different groups. Similar study done by A Nagai Kusuhara, et al. [1] recorded that normal subjects showed positive correlation with the disc area on increased degree of myopia measured by OCT. J B Jonas, et al. [4] analyzed morphology of the optic nerve head in south Indian subjects and showed that disc area and CD ratio statistically independent with refractive error. SA Vernon, et al. [3] also found no statistically significant association of disc area and cup disc ratio with spherical equivalent. Tarannum Mansoori, et al. [8] evaluated normal subjects of various age groups and found that disc area and cup disc ratio showed no any statistically significant relation with myopia.
In our study we observed that average pRNFL thickness show inverse correlation with axial length. Average pRNFL thickness decrease as axial length increases which is highly statistically significant (p < 0.001) in all the groups. Similar observations have also been quoted by various other authors. In our study the decreased average pRNFL thickness was more in amount when we compared Group 1 and Group 2 subjects, which was almost double in amount of decreased pRNFL thickness when compared Group 2 and Group 3 subjects. A Nagai Kusuhara, et al. [1] evaluated 162 eyes of 162 Japanese normal subjects aged between 20 and 83 yrs, the influence of axial length on the pRNFL thickness by OCT and found that total average pRNFL thickness were inversely correlated with axial length.
SA Vernon, et al. [3] evaluated by Stratus OCT, Shin Hee Kang, et al. [2] and Geng Wang, et al. [7] evaluated by Cirrus HD OCT, V Sowmya, et al. [10], measured by TOPCON 3D OCT 2000 and Pai Huei, et al. [11], evaluated by TOPCON 3D OCT-1000, all showed average pRNFL thickness decreased with the increasing axial length in non-glaucomatous subjects who performed study upon subjects having almost similar equivalents and equipment having same specification and configuration. Our study is in accordance with observation of study of Divya Singh, et al. [12], She also reported a decrease in thickness of pRNFL with the increasing in axial length. This decrease in pRNFL thickness is found to be statistically significant in different groups. But another study by SA Vernon, et al. [4] assessed the pRNFL thickness in non-glaucomatous healthy person with -6 D or > -6 D, mean –7.7 D and mean age of 48.1 years, show no statistically significant association between the average pRNFL thickness and axial length measured by Stratus OCT.
Thus it is almost a universal observation that average RNFL thickness decreased as the axial length increase although there are variation in pattern showed amount of thickness in different AL Groups, which differs from study to study.
Similarly in our study different quadrant exhibit different pattern, superior and inferior showed definite decreasing trend. On other hand mean temporal pRNFL showed a trend of increased pRNFL thickness as axial length increases, while nasal pRNFL thickness showed first increased pRNFL thickness pattern on high axial length then pRNFL thickness decreases on extremely high axial length.
In our study the mean temporal RNFL thickness in AL Group 1, AL Group 2 and AL Group 3 are showing decreasing pattern with high and very high axial length but when it extremely high the mean temporal RNFL thickness increase with the p value of 0.001 which was statistically highly significant in groups. The mean nasal RNFL thickness are showing decreasing pattern in high and extremely high axial length but it showing increasing in very high axial length with the p value of 0.007 which is statistically significant in groups. The mean superior and inferior pRNFL thickness showing continuous decreasing order, with the p value of 0.001 and 0.001 respectively, which is statistically highly significant.
Our study also resemble by SA Vernon, et al. [3] evaluated mean pRNFL thickness as quadrant wise, in non-glaucomatous Caucasian subjects with a high degree of myopia and found vertical quadrant and particular superior sector correlated strongly with axial length. Shin Hee Kang, et al. [2] evaluated the mean temporal pRNFL thickness, which showed continuously increasing pattern on increasing axial length which was statistically significant. The mean superior and inferior pRNFL thickness continuously decreasing pattern which was statistically significant. The mean nasal pRNFL thickness showed no significant difference, measured by Cirrus HD OCT. Geng Wang, et al. [7] also found that mean temporal pRNFL thickness, which showed continuously increasing pattern, followed by the mean superior and inferior pRNFL thickness continuously decreasing pattern on increasing axial length which was statistically significant. The mean nasal pRNFL thickness showed no significant difference, measured by Cirrus HD OCT.
V Sowmya, et al. [10] evaluated 300 eyes of 150 patients for RNFL by high resolution OCT. Effect of axial length on the RNFL thickness was found that mean temporal pRNFL thickness, which showed decreasing pattern but it showed increasing pattern on extremely high axial length, which was statistically significant. The mean superior and inferior pRNFL thickness continuously decreasing pattern which was statistically significant. The mean nasal pRNFL thickness showed no significant difference, measured by TOPCON 3D OCT 2000. Pai Huei, et al. [11] investigated pRNFL thickness by 3D OCT-1000 and found that reduction of RNFL with long AL (> 27 mm; 0.16μm/year) or those with short AL (< 25 mm; 0.22μm/year). For every 1-mm-greater AL, RNFL was thinner by 1.78 μm. The inferior quadrant showed the greatest tendency of RNFL decline with longer AL 4.46 μm/mm. Divya Singh, et al. [12] also evaluated 100 eyes of 100 healthy subjects (age 20-34 years with M/F ratio of 57/43), showed that mean temporal pRNFL thickness, which showed continuously increased pattern on increased axial length which was statistically significant. The mean superior, inferior and nasal pRNFL thickness continuously decreasing pattern which was statistically significant, measured by Cirrus HD OCT.
Our study also showing the mean disc area are showing continuously increasing pattern on increasing axial length which is statistically significant, with the p value of 0.001in different group and the mean CD ratio not showing significant difference with the p value of 0.146. JB Jonas, et al. [4] analyzed 70 subjects morphology of the optic nerve head in south India showed statistically independent with axial length. But mean horizontal cup/disc diameter ratio 0.66 was significantly higher than the mean vertical cup/disc diameter ratio 0.56. Both ratios were highly significantly and positively correlated with optic disc size. A Nagai Kusuhara, et al. [1] evaluated Japanese normal subjects aged between 20 and 83 years, the influenced by axial length, disc area positively correlated, measured with OCT. SA Vernon, et al. [3] evaluated in non-glaucomatous Caucasian subjects with a high degree of myopia and found vertical quadrant, particular superior sector correlated strongly with axial length.
A controversy exists on pRNFL changes and optic disc morphometric changes according to SE and AL. Several studies have shown that the pRNFL thickness measures by OCT forms increasing, decreasing or irregular pattern of mean pRNFL thickness in different quadrant and average pRNFL thickness, according to increasing degree of myopia or increasing axial length.
The Cirrus HD OCT model used in our study is known for its reproducibility and reliability. Only one experimenter tested all 110 subjects. OCT done after fully dilated pupil with ocular magnification. After OCT if the disc center not come to in the range of +0.02 to -0.02 mm then it will be centered manually in OCT, on average Study showed that if the myopia and AL increased, the pRNFL thickness decreased and disc size increased and no association with CD ratio.
There are several limitation in our study, one is the different number of subjects in different group and the number of subject in different group are not equal, so the result of different group relativity not correlated actually.
Conclusion
- Average pRNFL thickness clearly exhibited a decreasing pattern as spherical equivalent and Axial length increases. However on meticulously observing different quadrant, superior and inferior quadrant manifested continuously decreasing pattern as spherical equivalent and Axial length increases, while temporal and nasal quadrant did not shows any fixed pattern of variation in thickness in different spherical equivalent group. Temporal quadrant pRNFL thickness first decreased and then increased as axial length increased. In nasal quadrant thickness was found to be increase first and then decreases as axial length increased.
- The average disc area increases as spherical equivalent increased in our study however CD ratio remain unchanged throughout our study. Thus while evaluating disc in different ocular and systemic affections in subjects having myopia CD ratio should be kept on minute observations.
- Thus in subjects having myopia, evaluation for glaucoma specially observing pRNFL thickness and other changes in pRNFL should be done with extreme caution.
Similarly on the other hand various changes in myopic subject should not be confused with positive finding for glaucoma.
References
-
Nagi-Kusuhara A, Nakamura M, Fujioka M, Tatsumi Y, Negi A (2008) Association of retinal nerve fibre layer thickness measured by confocal scanning laser ophthalmoscopy and Optical Coherence Tomography with disc size and axial length. Br J Ophthalmol 92(2): 186-190.
-
Shin Hee Kang, Seung Woo Hong, Seong Kyu Im, Sang Hyup Lee, Myung Douk Ahn (2010) Effect of Myopia on the Thickness of the Retinal Nerve Fiber Layer Measured by Cirrus HD Optical Coherence Tomography. IOVS 51(8): 4075-4083.
-
Vernon SA, Rotchford AP, Negi A, Ryatt S, Tattersal C (2008) Peripapillary retinal nerve fibre layer thickness in highly myopic Caucasians as measured by Stratus OCT. Br J Ophthalmol 92(8): 1076-1080.
-
Jonas JB, Thomas R, George R, Berenshtein E, Muliyil J (2003) Optic disc morphology in south India: the Vellore Eye Study. Br J Ophthalmol 87(2): 189-196.
-
Tarannum M, Kalluri V, Balakrishna N (2011) Optic disc topography in normal Indian eyes using spectral domain optical coherence tomography. Indian J Ophthalmol 59(1): 23-27.
-
Choi SW, Lee SJ (2006) Thickness changes in the fovea and peripapillary retinal nerve fiber layer depend on the degree of myopia. Korean J Ophthalmol 20(4): 215-219.
-
Wang G, Qiu KL, Lu XH, Sun LX, Liao XJ, et al. (2011) The effect of myopia on retinal nerve fibre layer measurement: a comparative study of spectral domain optical coherence tomography and scanning laser polarimetry. Br J Ophthalmol 95(2): 255-260.
-
Akagi T, Hangai M, Kimura Y, Ikeda HO, Nonaka A, et al. (2013) Peripapillary Scleral Deformation and Retinal Nerve Fiber Damage in High Myopia Assessed With Swept-Source Optical Coherence Tomography. Am J Ophthalmol 155(5): 927-936.
-
Zhao JJ, Zhuang WJ, Yang XQ, Li SS, Xiang W (2013) Peripapillary retinal nerve fiber layer thickness distribution in Chinese with myopia measured by 3Doptical coherence tomography. Int J Ophthalmol 6(5): 626-631.
-
Sowmya V, Venkataramanan R (2015) Effect of Refractive Status and Axial Length on Peripapillary Retinal Nerve Fibre Layer Thickness: An Analysis Using 3D OCT. J Clin Diagn Res 9(9): NC01-NC04.
-
Peng PH, Sheng YH, Wang WS, Ko ML (2017) Age and axial length on peripapillary retinal nerve fiber layer thickness measured by optical coherence tomography in nonglaucomatous Taiwanese participant. PLoS One 12(6): e0179320.
-
Divya Singh, Sanjay K Mishra, Agarwal E, Sharma R, Bhartiya S, et al. (2017) Assessment of Retinal Nerve Fiber Layer Changes by Cirrus High-definition Optical Coherence Tomography in Myopia. J Curr Glaucoma Prac 11(2): 52-57.
- Screening of Hospital Staff During World Glaucoma Week in a Tertiary Eye Care Centre
- Angioid Streaks with Macular Neovascularization: Clinical Insights from Two Cases
- Giant Kissing Naevus: An Oculoplastic Challenge
- Why Freedom of Vision Should Not Cost the Freedom of Feeling - LASIK in the Climate of Change
- Asymmetric Optic Nerve with Small Disc and Large Cup: A Rare and Challenging Case of Unilateral Optic Nerve Hypoplasia
- Large Angle Exotropia in a Child: A Case Report