Down-Regulation of NRF2 Signaling Triggers Cell Death in Y79 Cells upon Copper Chelation
Background: Retinoblastoma is a rare intraocular malignancy that leads to vision loss in children. While copper (Cu) chelation has been reported as a therapy in many cancers, its relevance to retinoblastoma has not yet been explored. Objectives: In this study, we have explored the role of penicillamine (a Cu chelator) as a therapeutic target for retinoblastoma using Y79 cells as a model. Methods: The effect of the Cu chelator on the viability of Y79 was assessed using the MTT assay. Additionally, we performed nuclear fractionation to assess Nuclear factor erythroid 2–related factor 2 (NRF2) activation, evaluated the downstream targets of NRF2 at transcript and protein levels, and measured SOD (superoxide dismutase) activity. Results: Penicillamine (2 mM) induced cell death in Y79 cells, inhibited NRF2 signaling, and reduced SOD activity. Furthermore, the downstream targets of NRF2 namely VEGF as well as PCNA (proliferating cell nuclear antigen) were decreased with penicillamine, which induced cell death in Y79 cells. We observed similar results in HeLa cells (positive control) comparable to Y79 cells. Conclusion: Therefore, we speculate that penicillamine could be a target for retinoblastoma as it induces cell death in Y79 cells by regulating NRF2 nuclear translocation and decreasing its downstream targets.
Abbreviations
Y79: Retinoblastoma Cell Line; ARPE-19: Adult Retinal Pigment Epithelial 19; HNO3: Concentrated Nitric Acid; H2O2: Hydrogen Peroxide; CTR1: Copper Transporter 1; VEGF: Vascular Endothelial Growth Factor; ATP7A & 7B: Copper Transporting ATPase 7A & 7B; SOD1: Superoxide Dismutase 1; NRF2: Nuclear Factor Erythroid 2–Related Factor 2; NQO1NAD(P)H: Quinone Acceptor Oxidoreductase; HO1: Heme Oxygenase; MDM2: Mouse Double Minute 2 Homolog; GST: Glutathione S-Transferase; PCNA: Proliferating Cell Nuclear Antigen; KEAP1: Kelch-like ECH Associated Protein 1; ARE: Antioxidant Response Element; HepG2 & Hep3B: Human Liver Cancer Cells.
Introduction
Retinoblastoma (RB) is an ocular cancer that predominantly affects children, one case per 15,000–20,000 live births [1]. Nearly 45% of RB cases are hereditary, initiated by deactivation of both copies of the retinal RB1 gene (located at 13q14) [2]. An earlier study from our institute showed increased SOD (superoxide dismutase) expression in RB tumor tissues, suggesting active involvement of redox signaling pathways in RB pathogenesis. Y79 cells subjected to H2O2 treatment exhibited increased levels of the SOD1 enzyme, as indicated by microarray analysis [3]. The SOD helps in preventing oxidative damage by converting free radical into hydrogen peroxide. SOD1, SOD2, and SOD3 are the three SOD subtypes [4]. SOD1, a major cytosolic enzyme, accounts for 80% of cellular SOD activity and is rapidly emerging as a novel target for cancer therapy [5, 6, 7]. Copper (Cu) is a required cofactor for the enzymatic activity of SOD1 [8]. Cu chelation has been widely used as a cancer therapy [9]. In retinoblastoma, although the levels of Cu are unknown, increased parental Cu intake has been associated with child’s risk of sporadic bilateral retinoblastoma resulting from a new germline RB1 mutation [10].
NRF2 is a transcription factor in humans belonging to the Cap ‘n’ Collar (CNC) subfamily [11]. Modifying cysteine residues of KEAP1 by oxidative and electrophilic stress is a principal mechanism by which NRF2 is activated [12]. NRF2 knockout mice show decreased levels of SOD1 expression, thereby abolishing the cytoprotective role against H2O2 stress in cardiomyocytes [13]. Copper (Cu) is one of the main factors reported to induce NRF2 in many cancers [14]. In normal physiological circumstances, proteosomal degradation of NRF2 is mediated by KEAP1 which marks ubiquitin to NRF2 in the cytoplasm. KEAP1/NRF2 complex is separated when faced with stress. NRF2 has been shown to be activated by PKC, JNK, PIK3, and ERK. Transcription of downstream genes like HO-1, NQO1, GCLM, and GCLC was initiated when the NRF2 combines with MAF and ARE in the nucleus [12]. Among these, HO1 and MDM2 are associated with cancer progression [15, 16]. HO1 is reported to be elevated in various tumor cell types, including hepatoma, gastric cancer, lung cancer, and breast cancer, and it stimulates rapid cell growth, promotes angiogenesis, and aids in tumor metastasis [17]. MDM2 is present at high levels in some cancers, suppresses p53 activity, and functions as an independent oncogene [16]. Therefore, in this study, we aimed to identify the role played by the Cu chelator penicillamine in regulating NRF2 expression and SOD activity in Y79 cells as a model for retinoblastoma. Similarly, we also examined the role of Cu chelator in regulating NRF2 expression in HeLa cells.
Materials and Methods
Cell Culture
The human-derived metastatic RB cell line Y79 and the cervical carcinoma cell line HeLa were kindly provided by Dr. V. Umashankar, Vision Research Foundation. Y79 cells were grown in RPMI-1640 with 10% FBS (Gibco, USA) at 37°C in 5% CO2. HeLa cells were grown in Dulbecco’s modified Eagle’s medium (DMEM, Gibco, USA) with 10% FBS (Gibco, USA) at 37°C in 5% CO2. Both cell lines were serum-starved for 4 hours using their respective media supplemented with 1% FBS before exposure. The treatment conditions included 50 μM copper (Cu), 2 mM penicillamine (P), a co-treatment of Cu and penicillamine (Cu+P), and untreated cells as controls (CTRL). Adult human Retinal Pigment Epithelial cells (ARPE- 19, ATCC – CRL 2302) were cultured in DMEM-F12 (Sigma, USA) medium supplemented with 10% FBS (Gibco, USA) and 0.1x antimycotic and antibacterial solution (Gibco, USA). The ARPE-19 cells were treated with varying concentrations of penicillamine in DMEM-F12 supplemented with 1% FBS and antimycotic and antibacterial solution (Gibco, USA).
Viability Assay
To assess cell viability, we conducted the MTT (3-(4,5-dimethylthiazol-2)-2,5-diphenyltetrazolium bromide) assay under different treatment conditions and with varying concentrations of penicillamine (ranging from 50 μM to 500 μM and from 1 mM to 4 mM) for 24 hours in ARPE-19, HeLa, and Y79 cells. Post-treatment, the cells were exposed to MTT and the resulting formazan crystals were dissolved in DMSO and measured at 570 nm using a Spectramax M2e spectrophotometer from Molecular Devices, located in California.
Estimation of Copper in Y79 Cells
Intracellular Cu was measured using an atomic absorption spectrophotometer (AAS) Analyst 700 (Perkin Elmer, USA). After exposure, the cells were washed with PBS and lysed using a 5:1 mixture of HNO3 and perchloric acid (Merck, India) and ashed in a Bunsen flame. The ashed samples were dissolved in 1 ml of 0.2% HNO3, centrifuged, and the supernatant was used to estimate Cu. The AAS parameters for the assay included a Cu hollow cathode lamp at a wavelength of 324.8 nm with a slit width of 0.7 nm. The sample Cu was atomized at 2300°C using a graphite furnace, and the absorbance was recorded. The concentration of Cu was calculated after calibration with a known Cu standard from Perkin Elmer (20-100 μg/L).
RNA Extraction and Polymerase Chain Reaction
Total RNA was extracted using TRIzol reagent (Sigma, USA) according to the manufacturer’s protocol, and 1 μg of the RNA was converted to cDNA using the iScript cDNA synthesis kit (Bio-Rad, USA). Quantitative PCR (qPCR) was performed using SYBR chemistry. The list of primers used is provided in Table 1. The specificity of the amplified products was confirmed based on the melting curve, and the fold change was calculated using the 2^∆Ct (treated – untreated) method. 18S rRNA was used for normalization [18].
Nuclear Localization Studies
Nuclear fractionation and western blotting were performed on Y79 cells, while immunocytochemistry was conducted on HeLa cells. The nuclear fractionation protocol was based on the Abcam nuclear extraction and fractionation protocol (https://www.abcam.com/protocols/nuclear- extraction-protocol-nuclear-fractionation-protocol). Post- treatment, Y79 cells were centrifuged, and the pellet was resuspended in fractionation buffer A (10 mM HEPES, 1.5 mM MgCl2, 10 mM KCl, 0.5 mM DTT, 0.05% NP40; pH 7.9) with a protease inhibitor cocktail. The suspension was placed on ice for 10 minutes, followed by centrifugation at 3000 rpm for 10 minutes at 4°C. The supernatant containing the cytosolic fraction was preserved. The pellet was resuspended in fractionation buffer B (5 mM HEPES, 1.5 mM MgCl2, 0.2 mM EDTA, 0.5 mM DTT, 26% glycerol; pH 7.9, 4.6 M NaCl) and homogenized using a 21-gauge syringe, then placed on ice for 30 minutes, followed by centrifugation at 24,000 g for 20 minutes at 4°C. The supernatant was aliquoted and used for western blotting.
For immunocytochemistry, coverslips were placed in a 24-well plate, and HeLa cells grown on them were exposed to the conditions mentioned above for 24 hours. Post- treatment, the cells were fixed with 4% formaldehyde and permeabilized with 0.1% Triton X-100. The cells were stained with NRF2 antibody (1:200; Santa Cruz Biotechnology, USA), and images were captured using a Carl Zeiss microscope (100x) (Zeiss Axio Observer Z1, Jena, Germany).
Western Blot Analysis
Y79 cells were lysed using RIPA buffer with a protease inhibitor cocktail (Roche, Switzerland). Protein estimation was performed using a BCA kit (Thermo Scientific, USA), 35– 40 μg of protein were subjected to 12% resolving gel SDS- PAGE then the blot was transferred to a PVDF membrane (GE Healthcare, USA) using a semi-dry transfer method. 5% of non-fat dry milk in TBST was used as a blocking agent. The appropriate dilution of primary antibodies: CTR1 (1:1000; polyclonal, rabbit, Pierce, Thermo Scientific, USA), HO1 (1:500; monoclonal, mouse, Santa Cruz Biotechnology, USA), VEGF (1:1000; polyclonal, rabbit, Cell Science), NRF2 (1:500; monoclonal, mouse, Santa Cruz Biotechnology, USA), PCNA (1:3000; monoclonal, rabbit, Cell Signaling Technology), H3 (1:1000; monoclonal, mouse, Cell Signaling Technology) and β-actin (1:1000; monoclonal, mouse, Santa Cruz Biotechnology, USA) were used and kept at 2-8°C for overnight. After incubation, the blot was washed using TBST and incubated for 2 hours with the appropriate secondary antibody (sc-2005 & sc-2357, Santa Cruz Biotechnology, USA). ECL substrate (Bio-Rad, USA) was used to detect the bands on the membrane, visualized with a FluorChem FC3 Gel Documentation System. β-actin was used for normalization, and H3 was used as a normalization control for fractionation studies.
SOD Activity Assay
SOD is an antioxidant and has been shown to inhibit the auto-oxidation of epinephrine. The SOD activity under copper and penicillamine-treated conditions was measured using the epinephrine auto-oxidation method based on the protocol by Mishra H.P. and Fridovich I [19]. The protein was extracted by lysing the cells in RIPA buffer (pH 8.0) via sonication on ice for a minimum of 2 × 30 seconds. Samples were centrifuged for 10 minutes at 10,000 rpm at 4°C (5810R Eppendorf, Hamburg, Germany) and the protein concentration in the supernatant was determined using the BCA protein assay kit. Forty micrograms of protein were used for the assay. The lysates containing SOD were tested for inhibition of epinephrine auto-oxidation in 50 mM carbonate buffer (pH 9.8) at 480 nm at 15-second intervals up to 4 minutes (kinetic method) in a spectrophotometer (M2 Spectrmax, USA) and the results were expressed as percent inhibition of auto-oxidation.
Detection of Reactive Oxygen Species (ROS)
ROS production in Y79 cells on treatment with copper and a co-treatment of Cu and penicillamine (Cu+P), was detected by measuring the fluorescent signal using the DCFDA assay (redox-sensitive-fluoroprobe- 2′, 7′-dichlorofluorescein- diacetate). The Y79 cells were treated with the conditions along with the DCFDA (10 mM) and incubated in the dark for 30 min at 37 ◦C in 96 well plates. Post-treatment, the cells were washed with PBS, and the fluorescence of DCF was detected with 525 nm as an emission wavelength and 485 nm as an excitation wavelength.
Statistical Analysis
All experiments were done as biological triplicates. Statistical analysis was performed using Graphpad Software version 8. Results were expressed as mean ± standard deviation. One-way ANOVA followed by Dunnett’s post hoc test was used. A p-value < 0.05 was considered statistically significant.
Results
Expression Pattern of CTR1 in Y79 Cells
Initially, since there are no reports on the expression of Cu transporter (CTR1) in Y79 cells, we compared the protein levels of CTR1 in these cells with those in the normal ocular cell line ARPE19, which forms the blood-retinal barrier. We found that CTR1 expression was increased in Y79 cells compared to ARPE19. Furthermore, Cu uptake in Y79 cells was assessed using atomic absorption spectroscopy. Intracellular Cu accumulation was higher in Y79 cells (37 µg/L) compared to ARPE19 cells (24 µg/L) (Figure 1A & B). Additionally, we measured the mRNA levels of CTR1 and intracellular copper in HeLa cells and found that both were elevated compared to ARPE19 cells (1.8-fold increase for CTR1 and 42 µg/L for intracellular copper) (Figure S1A & B).
Cell Cytotoxicity Assay with Penicillamine
The dosage of the copper chelator penicillamine for Wilson’s disease ranges from 750 mg to 1500 mg per day, which corresponds to approximately 5 to 10 mM [20]. About 250 mg per day has been used for copper depletion and anti-angiogenesis treatment in glioblastoma [21]. Therefore, we used varying concentrations of penicillamine (50 μM to 4 mM) to assess cell viability in Y79 cells using the MTT assay. Significant cell death was observed at 2 mM and 4 mM concentrations of penicillamine (32% and 52%, respectively) which was confirmed by BAX & BCL2 expression in penicillamine with and without Cu co treatment (Figure S2). Consequently, further experiments were conducted with a 2 mM concentration of penicillamine. Additionally, we evaluated cell viability and the efficacy of penicillamine in inducing cell death by co-treating with Cu (50 μM, a concentration observed in the serum of cancer patients [22, 23, 24], and found it to be cytotoxic (35% in P+Cu) (Figures 1C & D). We also found that 2 mM and 4 mM concentrations of penicillamine were cytotoxic in HeLa cells (25% in P and 31% in P+Cu) but non-toxic to ARPE19 cells (Figures S1C-F).
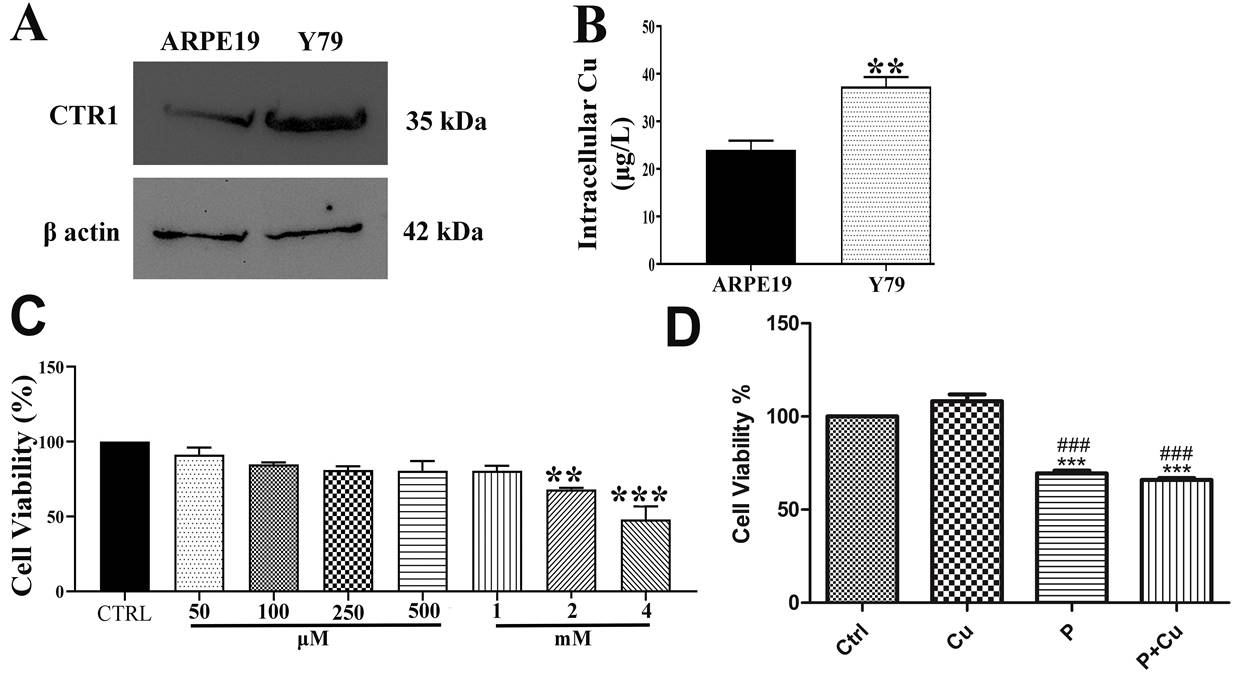
Figure 1: CTR1 expression, Intracellular copper concentration and Cytotoxicity: (A) CTR1 expression in Y79 compared to ARPE19 cells; (B) Intracellular copper concentration in Y79 compared to ARPE-19 cells using AAS; (C) Cell viability was measured at varying concentrations of penicillamine in Y79 cells at 24 h; (D) Cell viability on penicillamine co-treatment with Cu in Y79 cells; p < 0.01; * p < 0.001; when compared to control. # p < 0.05; when compared Cu.
Regulation of Cu Homeostasis by Penicillamine in Y79 Cells
Further, Cu accumulation in Y79 cells was significantly increased with Cu treatment, whereas it was inhibited by penicillamine, both with and without Cu co-treatment. Penicillamine-Cu co-treatment significantly reduced copper accumulation compared to penicillamine treatment alone (42 µg/L with Cu, 23 µg/L with penicillamine, and 20 µg/L with penicillamine-Cu co-treatment) (Figure 2A). The Cu influx transporter CTR1 expression was elevated with Cu treatment, whereas penicillamine with copper significantly reduced its expression (1.3-fold increase with Cu and 0.6-fold decrease with penicillamine-Cu co-treatment) (Figures 2B & C). The transcript levels of efflux chaperones ATP7A and ATP7B were increased with penicillamine and penicillamine-Cu co-treatment compared to control (ATP7A was 5-fold higher with penicillamine and 9-fold higher with penicillamine-Cu co-treatment, while ATP7B was 4-fold higher with penicillamine-Cu co-treatment alone). Penicillamine-Cu co-treatment significantly increased the mRNA levels of efflux chaperones compared to Cu alone and penicillamine alone (Figure 2D).
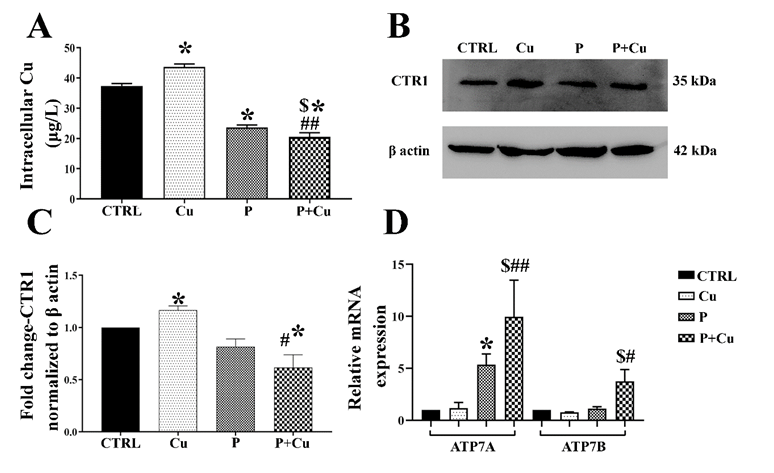
Figure 2: Copper transport chaperones: (A) Intracellular copper concentration measured using AAS; (B) CTR1 western blot in the treatment conditions; (C) CTR1 densitogram of western blot normalized to β actin; (D) Transcript levels of efflux chaperones ATP7A and 7B; * p < 0.05; when compared to control. # p < 0.05; ## p < 0.01; when compared Cu. $ p < 0.05; when compared to penicillamine
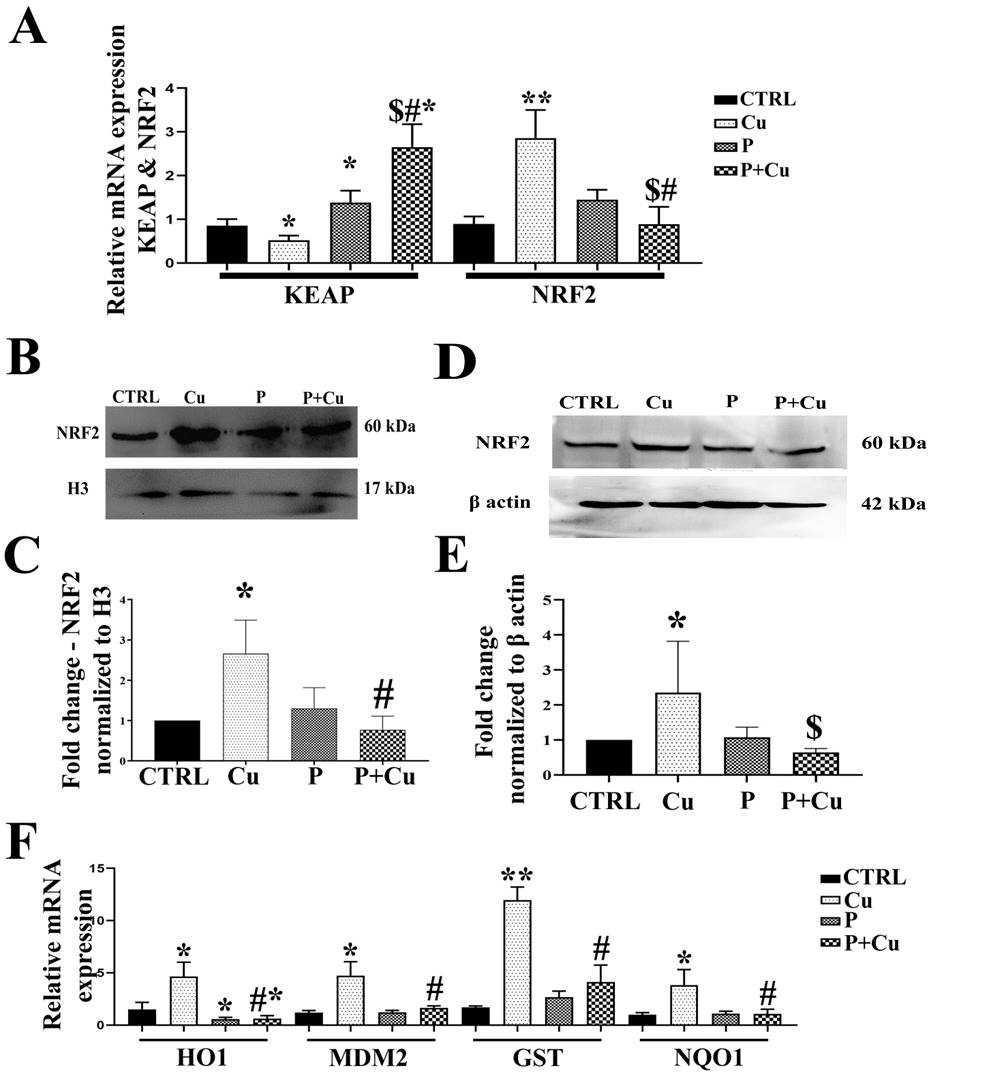
Figure 3: NRF2 activation and its downstream molecules: (A) Transcript levels of KEAP1 and NRF2; (B) NRF2 western blot showing nuclear fractionation; (C) NRF2 densitogram normalized to H3; (D) Western blotting for total protein lysate; (E) NRF2 densitogram normalized to β actin; (F) Transcript levels of downstream targets of NRF2; * p < 0.05; ** p < 0.01; when compared to control. # p < 0.05; ## p < 0.01; when compared Cu. $ p < 0.05; when compared to penicillamine.
Effect of Penicillamine of SOD and NRF2 Activity
Cu is known to modulate the transcription factor NRF2, whose activation is inhibited by binding to KEAP1. Transcript levels of KEAP1 were significantly decreased with Cu treatment (0.7-fold) but significantly increased with penicillamine, both with (1.3-fold) and without (2.7-fold) Cu co-treatment. The increase in KEAP1 transcript levels with penicillamine-Cu co-treatment was also significantly higher compared to penicillamine alone. Similarly, Cu treatment significantly increased NRF2 transcript level by 2.9-fold but significantly decreased with penicillamine treatment (Figure 3A). Cu treatment induced NRF2 nuclear translocation in Y79 cells and total protein lysates also showed increased NRF2 levels with Cu treatment, while NRF2 levels were decreased with penicillamine and penicillamine-Cu co- treatment in both nuclear and cytoplasmic fractions (Figures 3B-E). Additionally, we have also verified in HeLa cells that NRF2 nuclear translocation was inhibited with penicillamine treatment (Figure S3). Further transcript levels of downstream targets of NRF2, namely NQO1 (3.2- fold), HO1 (4.3-fold), MDM2 (5-fold), and GST (13-fold), were significantly decreased with penicillamine, both with and without Cu co-treatment, compared to Cu treatment in Y79 cells (Figure 3F).
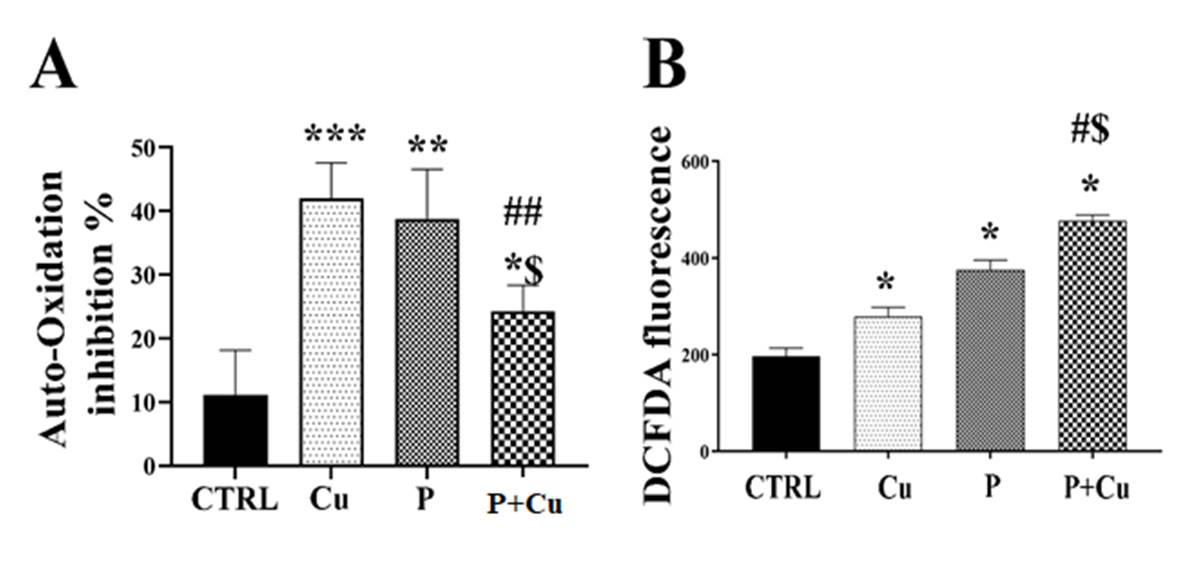
As NRF2 inhibition has been reported to reduce SOD1 expression levels, we assessed the activity of SOD in Cu and penicillamine treatments. SOD activity was measured as the percentage inhibition of epinephrine auto-oxidation. We observed increased inhibition of epinephrine auto- oxidation with Cu treatment but a significant decrease with penicillamine co-treatment, indicating that penicillamine may inhibit SOD activity in Y79 cells (Figure 4A). Cu chelation reduces NRF2 translocation and also decreases SOD activity in Y79 retinoblastoma cells. Since NRF2 and SOD are known to decrease ROS levels, we measured ROS levels under the different treatment conditions. Cu, penicillamine, and penicillamine-Cu co-treatment all showed significant increases in ROS levels compared to the control (Figure 4B). Notably, penicillamine-Cu co-treatment resulted in a significant increase in ROS levels compared to Cu and penicillamine-alone treatments. It us well studied and established that copper generates ROS through Fenton’s reaction. Further the generation of ROS by penicillamine is reported due to reduction of Cu(II) to Cu(I) that catalyze oxidation that leads to the generation of reactive oxygen species (ROS) such as superoxide radicals, H2O2, and hydroxyl radicals [25]. ROS is suggested as an important factor which can induce apoptosis by increasing the ubiquitination of Bcl- 2, protein that prevents apoptosis and increases the levels of Bax and caspases which are proopptotic factors [26]. We also observed increased BAX/BCL2 ratio in this study and speculate the increase in ROS levels could be the reason for the cell death.
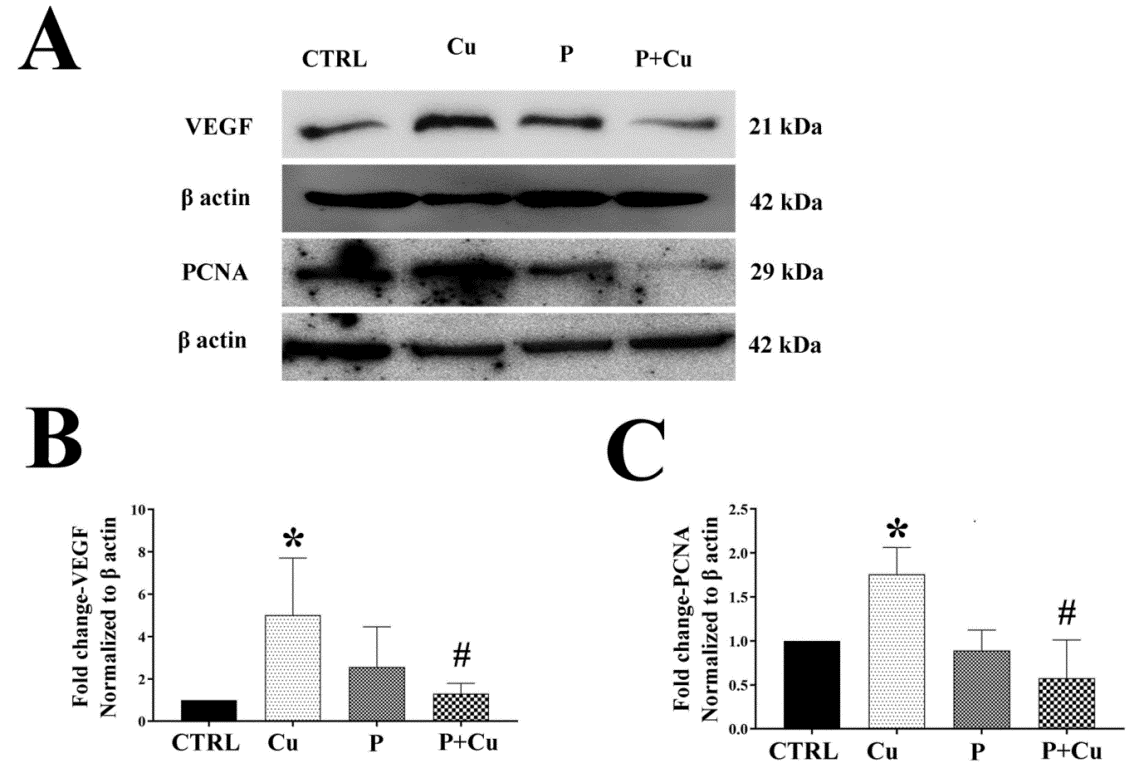
Effect of Penicillamine on HO1 and MDM2
Two main downstream targets of NRF2 well-studied in cancer cells are heme oxygenase-1 (HO1) and Mouse double minute 2 homolog (MDM2). VEGF, a downstream target of HO1, also showed a similar decrease in expression in penicillamine alone and with Cu co-treatment (Figures 5A & B), indicating that Cu chelation decreases cell proliferation through the HO1–VEGF axis. This was further confirmed in HeLa cells, where a significant decrease in VEGF protein levels was observed with penicillamine treatment (Figures S4A & B). PCNA, a downstream target of MDM2, also showed decreased levels with penicillamine and co-treatment compared to Cu treatment (Figures 5A & C). Additionally, HeLa cells also exhibited a significant decrease in PCNA protein levels under co-treatment conditions (Figure S4A & C). Our study indicates that both VEGF and PCNA expression was significantly reduced by the Cu chelator penicillamine.
Discussion
Retinoblastoma management is based on the severity and extent of the disease, the status of the other eye, the child’s overall health, socioeconomic background, and access to expert care [27]. Primary treatments include enucleation, intravenous chemotherapy combined with focal therapy (such as laser therapy or cryotherapy), intra-arterial chemotherapy combined with focal therapy, and focal therapy alone for small tumors at diagnosis [28]. New treatment regimens targeting retinoblastoma cell proliferation and tumorigenesis are being explored for improved disease management [29]. Intracellular Cu accumulation with increased CTR1 levels has been reported in various cancers, including breast, ovarian, gallbladder, stomach, and lung cancers [9, 30]. Cu chelation has been utilized as a therapy in multiple cancers [31]. However, there are no reports so far on Cu chelation therapy specifically for retinoblastoma.
In this study, we have demonstrated that there is increased expression of CTR1 and elevated Cu accumulation in Y79 cells compared to the normal ocular cell line ARPE19.
Cu is known to modulate the transcription factor NRF2, which is crucial for the ARE-mediated response [14]. NRF2 nuclear translocation has been reported in various cancers and is a critical factor for cancer progression. The activation of the NRF2 transcription factor depends on KEAP1 regulation, which forms a complex with NRF2, leading to the ubiquitination and proteasome-dependent degradation of NRF2 [32]. KEAP1 is reported to maintain a steady state kinetics of NRF2 under basal homeostatic conditions [33]. Under stress or cancer conditions, NRF2 is released from the KEAP1-NRF2 complex, activated, and translocated into the nucleus to induce its downstream targets which are cytoprotective genes [34]. Disulfiram complex has been shown to inhibit NRF2 expression and induce apoptosis in leukemia [35], while tetra-thiomolybdate has also been reported to decrease NRF2 expression in neuroblastoma cell lines [36]. In our study, we observed an increase in KEAP1 transcript levels and a decrease in NRF2 transcript levels with penicillamine treatment and also a decreased nuclear translocation of NRF2 in both Y79 and HeLa cells with this Cu chelator.
NRF2 knockdown has been reported to reduce SOD1 expression levels in cardiomyocytes of mice [13]. SOD1 expression has been shown to be increased in retinoblastoma [3]. SOD1 was found to be overexpressed in lung adenocarcinoma [37], and inhibition of SOD1 by a tetra- thiomolybdate analogue, a Cu chelator, induced cell death in non-small cell lung cancers [38]. Inhibition of SOD1 in nasopharyngeal carcinoma leads to cell death and apoptosis [39]. Further small molecules that inhibit SOD1 are reported to induce cell death in lung adenocarcinoma cells [40]. A decrease in SOD1 results in excess ROS, which induces cell death by augmenting protein dysfunction and altered cellular metabolism [41]. In our study, we demonstrate that Cu chelation with penicillamine decreases SOD1 activity, leading to an increase in ROS levels in both Y79 and HeLa cells, which in turn induces cell death.
The reduction in NRF2 translocation was further reflected in the inhibition of its downstream targets, including NQO1, MDM2, HO1, and GST. Increased HO1 expression in squamous cell carcinoma, colorectal cancer, prostate cancer, and breast cancer has been shown to promote cancer cell growth. Cu- based nanoparticles have been reported to enhance chemo- dynamic therapy by inhibiting HO1 in tumor cells [42]. The Cu chelator bathocuproine disulfonic acid (BCS) has been reported to decrease HO1 expression in HepG2 and Hep3B cells [43]. HO1 is known to induce VEGF and promote cell proliferation in non-small cell lung carcinoma [44]. Brusatol, an NRF2 inhibitor, has been shown to target the NRF2-HO1 axis, thereby reducing VEGF and angiogenesis in gastric cancer [45]. The induction of angiogenesis through NRF2-HO1 pathways has also been reported in various cancers, including gastric cancer, breast cancer, papillary thyroid cancer, and bladder cancer [45, 46, 47, 48]. In our study, we demonstrate that Cu chelation decreases NRF2-HO1- mediated increases in VEGF in both Y79 and HeLa cells.
Cu binding agents, such as dithiocarbonates and zinc metallochaperones, diminish the expression of MDM2 by increasing the expression of the tumor suppressor gene p53 [49, 50]. The isatin-Schiff base derivative Cu(II) complex promotes p53-dependent gene expression and apoptosis through MDM2 suppression [51]. Cu oxide nanoparticles have been shown to increase p53 levels, arrest the cell cycle, and induce apoptosis by suppressing PCNA in breast cancer cells [52]. In our study, we demonstrate that Cu chelation with penicillamine reduces the expression of transcript levels of MDM2 and decreases PCNA protein expression. Thus, we hypothesize that the Cu chelator penicillamine induces cytotoxicity by decreasing SOD activity, increasing intracellular ROS, reducing angiogenesis and diminishing cell proliferation through the NRF2-HO1-VEGF pathway. We propose that copper chelation could be explored as a therapeutic strategy for retinoblastoma, pending further evaluation of its efficacy in animal models.
Conclusion
From this study we speculate that chelation of copper by penicillamine could be a strategy in managing retinoblastoma. Limitation of the study: The long term impact of NRF2 inhibition in normal retinal cells is still not clear and therefore the effect of NRF2 inhibition in normal retinal cells has to be validated in animal models.
Availability of Data and Materials
The datasets generated during and/or analyzed during the current study are available from the corresponding author upon reasonable request.
• Acknowledgements: We would like to thank Dr. V. Umashankar for gifting us the cell lines. • Ethics Approval: Not Applicable • Funding: The work was funded by 1. Department of Science and Technology sanction number SB/YS/LS- 122/2014, Indian council of medical research fellowship number 2019-3886/CMB/BMS and Department of Biotechnology sanction number BT/PR41359/ MED/30/2301/2020. • Competing interests: The authors have no relevant financial or non-financial interests to disclose. • Author contribution: Study conception and design: SRB; Data collection: AD,KA; Analysis and interpretation of results: AD, KA; Draft manuscript preparation: SRB, AD. All authors reviewed the results and approved the final version of the manuscript.
References
-
Wang YZ, Zhang Y, Huang DS, Shi JT, Ma JM, et al. (2021) Clinical characteristics, treatment and prognosis of children with unilateral retinoblastoma and intracranial segment of Retrobulbar optic nerve invasion. BMC Ophthalmol 21: 38.
-
Cruz-Gálvez CC, Ordaz-Favila JC, Villar-Calvo VM, Cancino- Marentes ME, Bosch-Canto V (2022) Retinoblastoma: Review and new insights. Front Oncol pp: 12.
-
Vandhana S, Lakshmi TSR, Indra D, Deepa PR, Krishnakumar S (2012) Microarray analysis and biochemical correlations of oxidative stress responsive genes in retinoblastoma. Curr Eye Res 37: 830-841.
-
Fukai T, Ushio-Fukai M (2011) Superoxide dismutases: Role in redox signaling, vascular function, and diseases. Antioxidants Redox Signal pp: 15.
-
Alateyah N, Gupta I, Rusyniak RS, Ouhtit A (2022) SOD2, a Potential Transcriptional Target Underpinning CD44- Promoted Breast Cancer Progression. Molecules 27: 811.
-
Xiang L, Yuanyuan C, Jidong Z, Jiayuan S, Mingfang W, et al. (2019) The Specific Inhibition of SOD1 Selectively Promotes Apoptosis of Cancer Cells via Regulation of the ROS Signaling Network. Oxid Med Cell Longev 2019.
-
Xiaowen W, Hong Z, Russell S, Jun Y, Justin W, et al. (2021) SOD1 regulates ribosome biogenesis in KRAS mutant non-small cell lung cancer. Nat Commun pp: 12.
-
Boyd SD, Ullrich MS, Skopp A, Winkler DD (2020) Copper sources for sod1 activation. Antioxidants 9: 1-14.
-
Shanbhag VC, Gudekar N, Jasmer K, Papageorgiou C, Singh K, et al. (2021) Copper metabolism as a unique vulnerability in cancer. Biochim Biophys Acta - Mol Cell Res 1868(2): 118893.
-
Bunin GR, Li Y, Ganguly A, Meadows AT, Tseng M (2013) Parental nutrient intake and risk of retinoblastoma resulting from new germline RB1 mutation. Cancer Causes Control 24: 343-355.
-
He F, Ru X, Wen T (2020) NRF2, a Transcription Factor for Stress Response and Beyond. Int J Mol Sci 2020; 21: 4777.
-
Yu C, Xiao JH (2021) The Keap1-Nrf2 System: A Mediator between Oxidative Stress and Aging. Oxid Med Cell Longe 2021: 1-16.
-
Dreger H, Westphal K, Weller A, Baumann G, Stangl V, et al. (2009) Nrf2-dependent upregulation of antioxidative enzymes: a novel pathway for proteasome inhibitor- mediated cardioprotection. Cardiovascular Research 83(2): 354-361.
-
Song MO, Mattie MD, Lee C-HH, Freedman JH (2014) The role of Nrf1 and Nrf2 in the regulation of copper- responsive transcription. Exp Cell Res 322(1): 39-50.
-
Nitti M, Ivaldo C, Traverso N, Furfaro AL (20210 Clinical significance of heme oxygenase 1 in tumor progression. Antioxidants 10: 789.
-
Wang W, Albadari N, Du Y, Fowler JF, Sang HT, et al. (2024) MDM2 Inhibitors for Cancer Therapy: The Past, Present, and Future. Pharmacol Rev 76: 414-453.
-
Luu Hoang KN, Anstee JE, Arnold JN (2021) The Diverse Roles of Heme Oxygenase-1 in Tumor Progression. Front Immunol 12: 1037.
-
Rebouças E de L, Costa JJ do N, Passos MJ, Passos JR de S, Hurk R van den,et al. (2013) Real time PCR and importance of housekeepings genes for normalization and quantification of mRNA expression in different tissues. Brazilian Arch Biol Technol 56: 143-154.
-
Mishra HP, Fridovich I (1972) The role of superoxide anion in the autoxidation of epinephrine and a simple assay for superoxide dismutase 247(10): 3170-3175.
-
Mohr I, Weiss KH (2019) Current anti-copper therapies in management of Wilson disease. Ann Transl Med 7: 69- 69.
-
Brem S, Grossman SA, Carson KA, New P, Phuphanich S, et al. (2005) Phase 2 trial of copper depletion and penicillamine as antiangiogenesis therapy of glioblastoma. Neuro Oncol 7: 246.
-
Zhang M, Shi M, Zhao Y (2018) Association between serum copper levels and cervical cancer risk: a meta- analysis. Biosci Rep 38: 20180161.
-
Feng Y, Zeng JW, Ma Q, Zhang S, Tang J, et al. (2020) Serum copper and zinc levels in breast cancer: A meta-analysis. J Trace Elem Med Biol 62: 126629.
-
Zhang X, Yang Q (2018) Association between serum copper levels and lung cancer risk: A meta-analysis. J Int Med Res 46: 4863.
-
Gupte A, Mumper RJ (2007) An investigation into copper catalyzed D-penicillamine oxidation and subsequent hydrogen peroxide generation. J Inorg Biochem 101: 594-602.
-
Ali D, Tripathi A, Al Ali H, Shahi Y, Mishra KK, et al. (2018) ROS-dependent Bax/Bcl2 and caspase 3 pathway-mediated apoptosis induced by zineb in human keratinocyte cells. Onco Targets Ther 11: 489-497.
-
Shields CL, Fulco EM, Arias JD, Alarcon C, Pellegrini M, et al. (2013) Retinoblastoma frontiers with intravenous, intra-arterial, periocular, and intravitreal chemotherapy. Eye Nature Publishing Group 27: 253-264.
-
Dimaras H, Corson TW, Cobrinik D, White A, Zhao J, et al. (2015) Retinoblastoma. Nat Rev Dis Prim 1: 15021.
-
Schefler AC, Kim RS (2021) Recent advancements in the management of retinoblastoma and uveal melanoma. Fac Rev 10(51): 1-15.
-
Lelièvre P, Sancey L, Coll JL, Deniaud A, Busser B (2020) The Multifaceted Roles of Copper in Cancer: A Trace Metal Element with Dysregulated Metabolism, but Also a Target or a Bullet for Therapy. Cancers (Basel) 12: 3594.
-
Shanbhag VC, Gudekar N, Jasmer K, Papageorgiou C, Singh K, et al. (2021) Copper metabolism as a unique vulnerability in cancer. Biochim Biophys Acta - Mol Cell Res 1868: 118893.
-
Baird L, Yamamoto M (2020) The Molecular Mechanisms Regulating the KEAP1-NRF2 Pathway. Mol Cell Biol 40(13): e00099.
-
Tong KI, Padmanabhan B, Kobayashi A, Shang C, Hirotsu Y, et al. (2007) Different electrostatic potentials define ETGE and DLG motifs as hinge and latch in oxidative stress response. Mol Cell Biol 27: 7511-7521.
-
Kansanen E, Kuosmanen SM, Leinonen H, Levonenn AL (2013) The Keap1-Nrf2 pathway: Mechanisms of activation and dysregulation in cancer. Redox Biol 1: 45- 59.
-
Xu B, Wang S, Li R, Chen K, He L, et al. (2017) Disulfiram/ copper selectively eradicates AML leukemia stem cells in vitro and in vivo by simultaneous induction of ROS- JNK and inhibition of NF-κB and Nrf2. Cell Death Dis 8: e2797.
-
Chin TY, Wang CC, Ma KH, Kuo CW, Hu MK, et al. (2021) Antioxidative effect of DJ-1 is enhanced in NG108-15 cells by DPMQ-induced copper influx. Am J Physiol - Cell Physiol 320: C635-c651.
-
Liu S, Li B, Xu J, Hu S, Zhan N, et al. (2020) SOD1 Promotes Cell Proliferation and Metastasis in Non-small Cell Lung Cancer via an miR-409-3p/SOD1/SETDB1 Epigenetic Regulatory Feedforward Loop. Front Cell Dev Biol 8.
-
Glasauer A, Sena LA, Diebold LP, Mazar AP, Chandel NS (2014) Targeting SOD1 reduces experimental non- small-cell lung cancer. J Clin Invest 124: 117-128.
-
Li S, Fu L, Tian T, Deng L, Li H, et al. (2018) Disrupting SOD1 activity inhibits cell growth and enhances lipid accumulation in nasopharyngeal carcinoma. Cell Commun Signal 16: 1-13.
-
Somwar R, Erdjument-Bromage H, Larsson E, Shum D, Lockwood WW, et al. (2011) Superoxide dismutase 1 (SOD1) is a target for a small molecule identified in a screen for inhibitors of the growth of lung adenocarcinoma cell lines. Proc Natl Acad Sci 108: 16375-16380.
-
Circu ML, Aw TY (2010) Reactive Oxygen Species, Cellular Redox Systems And Apoptosis. Free Radic Biol Med 48(6): 749-762.
-
Runxiao Z, Yan C, Fan Q, Yunyun W, Xiaoqing H, et al. (2021) Biodegradable Copper-Based Nanoparticles Augmented Chemodynamic Therapy through Deep Penetration and Suppressing Antioxidant Activity in Tumors. Adv Healthc Mater 10(14): 2100412.
-
Hait-Darshan R, Babushkin T, Malik Z (2009) Regulation of heme synthesis and proteasomal activity by copper: Possible implications for Wilson’s disease. J Environ Pathol Toxicol Oncol 28: 209-221.
-
Tertil M, Skrzypek K, Florczyk U, Weglarczyk K, Was H, et al. (2014) Regulation and Novel Action of Thymidine Phosphorylase in Non-Small Cell Lung Cancer: Crosstalk with Nrf2 and HO-1. PLoS One 9: e97070.
-
Huang Y, Yang Y, Xu Y, Ma Q, Guo F, et al. (2021) Nrf2/ ho-1 axis regulates the angiogenesis of gastric cancer via targeting vegf. Cancer Manag Res 13: 3155-3169.
-
Kim EH, Kim SJ, Na HK, Han W, Kim NJ, et al. (2021) 15-Deoxy-Δ12,14-prostaglandin J2 Upregulates VEGF Expression via NRF2 and Heme Oxygenase-1 in Human Breast Cancer Cells. Cells 10: 526.
-
He L, Zhang T, Sun W, Qin Y, Wang Z, et al. (2020) The DPP-IV inhibitor saxagliptin promotes the migration and invasion of papillary thyroid carcinoma cells via the NRF2/HO1 pathway. Med Oncol 37: 1-12.
-
Mukae Y, Miyata Y, Nakamura Y, Araki K, Otsubo A, et al. (2020) Pathological roles of c-Met in bladder cancer: Association with cyclooxygenase-2, heme oxygenase-1, vascular endothelial growth factor-A and programmed death ligand 1. Oncol Lett 20: 135-144.
-
Zaman S, Yu X, Bencivenga AF, Blanden AR, Liu Y, et al. (2019) Combinatorial therapy of zinc metallochaperones with mutant p53 reactivation and diminished copper binding. Mol Cancer Ther 18: 1355-1365.
-
Wang T, Liu Y, Fu Y, Huang T, Yang Y, et al. (2017) Antiproliferative activity of di-2-pyridylhydrazone dithiocarbamate acetate partly involved in p53 mediated apoptosis and autophagy. Int J Oncol 51(6): 1909-1919.
-
Bulatov E, Sayarova R, Mingaleeva R, Miftakhova R, Gomzikova M, et al. (2018) Isatin-Schiff base-copper (II) complex induces cell death in p53-positive tumors. Cell Death Discov 2018 41 4: 1-9.
-
Awny ME, Naglaa MS, Nahla SH, Fayez A, Nemany ANH, et al. (2021) Novel quercetin encapsulated chitosan functionalized copper oxide nanoparticles as anti-breast cancer agent via regulating p53 in rat model. Int J Biol Macromol 185: 134-152.
- Screening of Hospital Staff During World Glaucoma Week in a Tertiary Eye Care Centre
- Angioid Streaks with Macular Neovascularization: Clinical Insights from Two Cases
- Giant Kissing Naevus: An Oculoplastic Challenge
- Why Freedom of Vision Should Not Cost the Freedom of Feeling - LASIK in the Climate of Change
- Asymmetric Optic Nerve with Small Disc and Large Cup: A Rare and Challenging Case of Unilateral Optic Nerve Hypoplasia
- Large Angle Exotropia in a Child: A Case Report