Application of 2D-DIGE in Identification of Differentially Expressed Proteins of Mycobacterium Bovis BCG in Nonculturable and Rpf Mediated Resuscitation Phase
Prolonged incubation of Mycobacterium tuberculosis and Mycobacterium bovis BCG culture in stationary phase induces a true dormancy generating nonculturable (NC) cells. Recovery of NC cells to replicating phase can be promoted by resuscitation promoting factor (Rpf) of Micrococcus luteus. There are five homologs of Rpf proteins in M. tuberculosis and M. bovis BCG and all are individually able to resuscitate the nonculturable cells of mycobacteria. In this study, we have exploited fluorescent 2D-DIGE technique to compare the protein expression profile in nonculturable and resuscitation phase cells of M. bovis BCG. The study led us to identify eight proteins that were abundantly expressed in resuscitation phase and eight proteins with pronounced expression in nonculturable state. The differential expression of corresponding genes in two phases of growth was also analyzed at mRNA level using real time-PCR analysis. The study suggests several differentially expressed proteins belonging to intermediary metabolism and respiration, lipid metabolism, information pathway, virulence detoxification and adaptation, cell wall and cell processes categories at protein as well as RNA level that intend their role in the resuscitation phase, which might be crucial in exit from dormancy.
Introduction
Latency and reactivation of M. tuberculosis are two significant aspects of tuberculosis; however, very little is known about the factors or mechanism involved in their regulation [1, 2] and Wayne, Sohaskey. The majority of infected people carry the tubercle bacilli in the dormant or latent form. These people have 5-10% risk of developing active tuberculosis (WHO, 2006). Understanding the entry and exit from dormancy is important for development of new therapies. Resuscitation promoting factors (Rpf) have been recently identified which signal bacteria to exit from dormancy by regulating the cell division [3]. Rpf protein was originally identified as a secretory protein from the culture supernatant of Micrococcus luteus and was found to promote the recovery of dormant Micrococcus luteus, BCG and M. tuberculosis from a viable non-replicating to a replicating phase [4, 5]. Micrococcus luteus has a single essential rpf gene, however, M. tuberculosis and M. bovis BCG have five homologs of rpf designated as rpfA-E that bear significant similarity to the Rpf protein of Micrococcus luteus [6]. Studies on the growth stimulating activity of Micrococcus luteus Rpf and other Rpf-like proteins from M. tuberculosis and BCG on dormant cultures of Micrococcus luteus, M. smegmatis, M. bovis BCG and M. tuberculosis strongly suggest that Rpf-like proteins play potential role in recovery from dormancy and reactivation of latent infection [2, 5]. Recently, expression of Rpf in human lung granuloma has been demonstrated which lends support to its suggested role in persistence and reactivation [7]. Several models have been developed to simulate dormancy in vitro [7, 8]. However, prolonged incubation of the culture in stationary phase induces a true dormancy generating nonculturable (NC) cells that have to be resuscitated before resuming active growth [6, 8]. Although stationary phase or extended stationary phase (ESP) mimicking dormancy has been studied by proteomics and transcriptomics [9, 10], resuscitation phase (RSP) remains poorly studied. In the present investigation, we have explored the repertoire of proteins, which are differentially expressed during ESP and RSP starting from nonculturable cells of M. bovis BCG as ESP and following its resuscitation by recombinant Rpf protein of Micrococcus luteus. The expression profile of proteins in ESP and RSP was done by differential in gel electrophoresis (DIGE) which allows multiplexing of samples on the same gel. The study led to identification of several differentially expressed proteins with the criteria of more than 1.5 fold difference in expression level. The differentially expressed proteins belonged to intermediary metabolism and respiration, lipid metabolism, information pathway, virulence detoxification and adaptation, cell wall and cell processes categories and were validated by transcriptional profiling. Thus, the study could contribute significantly in the understanding of our knowledge of reactivation of dormant Mycobacteria and development of new strategies to control latency and reactivation of tuberculosis. However, significantly expressed proteins in the resuscitation phase needs further investigation to confirm their role in the resuscitation phenomenon.
Materials and Methods
Bacterial Strains and Culture Conditions
M. bovis BCG Pasteur strain (isolate 1173P2) was grown in Sauton’s medium containing ADC (Becton Dickinson, USA) and tween-80 (0.05% v/v) without shaking at 37 0C. For the resuscitation of nonculturable (NC) cells of M. bovis BCG, N-terminal his-tagged recombinant Micrococcus luteus Rpf protein without secretory signal was produced as described by Mukamolova et al., 1998 and used within 2 days.
Formation of Nonculturable Cells and Rpf Mediated Resuscitation
Actively growing M. tuberculosis and M. bovis BCG cells have been reported to convert in the nonculturable state during prolonged stationary phase of growth. Nonculturable (NC) state was achieved as described for M. tuberculosis by Shleeva, et al. [5]. Briefly, NC cells of M. bovis BCG were obtained by prolonged incubation of culture in Sauton’s medium containing tween-80 (0.05% v/v) and ADC for 6 months at 37 0C without shaking. Samples were taken at regular intervals and passed through 23-gauge syringe before plating to make the culture homogenous. Plating was done on MB7H10 agar medium containing OADC (Becton Dickinson, U.S.A.). After 6 months of incubation, M. bovis BCG became nonculturable as CFU detection was less than 5 cells/ml; this state of culture we called as extended stationary phase (ESP). Resuscitation of NC cells was induced by purified recombinant Rpf protein of Micrococcus luteus. The NC cells were removed by centrifugation at 6000 g for 10 minutes and 100 cells/ml were aliquoted into two 100 ml fresh Sauton’s medium supplemented with ADC. In one of the flask filter sterilized recombinant Micrococcus luteus Rpf protein (100 pmol/L) was added and in other flask, no protein was added. Both the flask was incubated at 37 0C without shaking. Resuscitation was observed by increase in optical density at 600 nm. After eight days of incubation, resuscitation phase (RSP) cells were harvested from the two flasks for protein and RNA isolation. The experiment was repeated three times independently.
Preparation of Whole Cell Protein Extract and Protein Labeling
M. bovis BCG culture of extended stationary phase (ESP) and resuscitated phase (RSP) were harvested by centrifugation at 6000g for 10 min at 4oC. Cells were washed twice with phosphate-buffered saline (PBS pH 7.2), suspended in lysis buffer containing 7 M urea, 2 M thiourea, 4% w/v CHAPS, 50 mM DTT, protease inhibitor cocktail (Roche, Louis, U.K.), vortexed and sonicated. The suspension was centrifuged at 17000g for 30 min at 4oC and supernatant was kept as protein extract [11]. Proteins from ESP and RSP samples were precipitated with 80% acetone, suspended in lysis buffer and stored at -80oC until use. The protein concentration was determined by copper iron assay (2D Quant kit, GE Healthcare, U.S.A.).
Protein Labeling with Cyanine Dye
For CyDye labeling, 50 mM Tris-Cl (pH 9.0) was added to adjust the samples pH 8.5. Three different cultures grown at different times for each ESP and RSP were used in this study. 50 µg protein of each sample was labeled separately with 200 pmol Cy3 and Cy5 dyes and incubated in ice for 30 min in the dark. An internal standard consisting of a mixture of equal amounts of protein from ESP and RSP samples was prepared by labeling with Cy2 dye and dye swapping was carried out in all the three sets of samples so that Cy3 and Cy5 dyes were distributed equally among both ESP and RSP groups. This experimental design thus contains three biological replicates and three technical replicates making six gels to be run. When imaged for different dyes, each gel will create three images. After scanning with Ettan DIGE Typhon Imager (GE Healthcare, U.S.A.) three images corresponding to the three samples (ESP, RSP and internal standard) were generated for each gel. Thus, in total 18 images were generated.
Two-dimensional difference Gel Electrophoresis
Isoelectric focusing (IEF) was conducted as described [12]. For each gel, an immobilized dry strip (pH 4.0-7.0 NL, 13 cm; GE Healthcare, U.S.A.) was rehydrated with 250 µl Cy-labeled protein samples. Briefly 50 µg of each Cy3, Cy5 and Cy2 labeled protein samples were combined with rehydration buffer (8 M Urea, 2 % w/v CHAPS, 0.002% Bromophenol blue, 0.003% (w/v) DTT and 0.5% IPG buffer (pH 4-7) was added to make up a final volume of 250 µl and used for rehydrating IPG strips for 10-16 h at 20oC in dark. The rehydrated strips were subjected to IEF for 1 h at 150V, 30 min at 500V and 30 min at 1000V; then a gradient was applied from 1000 to 8000V for 1 h 30 min and finally at 8000 V for 6 h to reach a total of 30 KVhT. All IEFs were carried out at 20oC and 50 µA per strip. The IPG strips were loaded onto 10% homogenous gels for second dimension separation. Prior to SDS-PAGE, each strip was equilibrated with SDS equilibration buffer A consisting of 6M Urea, 30% glycerol, 2% w/v SDS, 50 mM Tris-Cl, pH 6.8, 1% w/v DTT for 15 min followed by another 15 min in equilibration buffer B which contained iodoacetamide (2.5%) in place of DTT. The equilibrated strips were loaded onto a 10% homogenous SDS-PAGE (SE 600 Ruby gel apparatus, GE Healthcare, U.S.A.) and run at 20oC, 15 mA per gel for 30 min followed by 30 mA per gel until the bromophenol blue dye front run off the gel. Triplicate gels were run per sample. The Cy2, Cy3 and Cy5 labeled proteins of each analysis gels were imaged individually using Typhoon TRIO Variable Mode Imager (GE Healthcare, U.S.A.). The two preparative gels were stained using a colloidal commassie staining solution and scanned using a Typhon imager (GE Healthcare U.S.A.).
Image Acquisition and DeCyder Analysis
Gels were scanned for Cy2, Cy3 and Cy5 using Typhon trio (GE Healthcare, USA) at 200 µm resolutions. Imaging for Cy2 at 488-nm laser/ 520-nm band pass (BP) 40; Cy 3, 532-nm laser/ 580-nm BP 30 and for Cy 5, 633-nm laser / 670-nm BP 30 were carried out. The spots were detected and quantified with Differential In-gel Analysis (DIA) mode in DeCyder software 6.5 (GE Healthcare, U.S.A.). The spots on gels were co-detected automatically as 2D-DIGE image pairs, intrinsically linking the samples to its in-gel standard. The estimated number of spots for the detection procedure was set to 1250. Dust particles and protein streaks were manually removed. The intensity of spots in the Cy3 and Cy5 images were normalized to that of Cy2 image in same gel. Any differences observed between gels were due to electrophoretic artifacts and could be compensated by normalization. For each spot the ratio of Cy3:Cy2 and Cy5:Cy2 known as DIA ratio decides the fold- expression values for each spot in the given gel. Biological Variation Analysis (BVA) mode in DeCyder software was used to simultaneously match all 16 protein-spot maps from six gels. Using Cy3:Cy2 and Cy5:Cy2 DIA ratios, average abundance changes and student’s t-test with P- values were calculated. Only those spots ≥ 1.5 fold difference in volume after normalization and a P- value of <0.05 between Cy3 and Cy5 were defined as spots of interest. Spot patterns were matched by comparing fluorescent images of analytical gel and colloidal coomassie stained preparative gel. Spots of interest were then excised manually from preparative gels.
MS/MS Analysis and Database Searches
The spots of interest were picked manually from the corresponding colloidal coomassie stained preparative gel and destained with 50% v/v acetonitrile (ACN) and 25
mM ammonium bicarbonate (NH4HCO3) solution. The destained spots were treated sequentially with 100 µl of 100 mM NH4HCO3 and 50% v/v ACN for two cycles and dried completely in the Speedvac evaporator to remove any residual ACN. The gel pieces were immersed in the digestion buffer 20 µl (25 mM NH4HCO3) containing 10 ng/µL of trypsin (Promega, USA) in ice for 45 min followed overnight incubation at 37ºC. The peptides were extracted from the gel pieces with 50 µl of 50% ACN, 5% formic acid (FA) solution and lyophilized. Peptides were reconstituted in 10 µl of 50% ACN and 0.1% FA solution, loaded in a silica capillary (Proxeon Biosystem, USA) and fixed to a QSTAR XL quadruple/time-of-flight tandem mass spectrometer (Applied Biosystem, U.S.A.). Nanospray ionization was carried out using an ion spray voltage of 900. The progress of each run was monitored by recording the total ion current (TIC) for positive ions as a function of time for ions in the m/z range of 400- 1600 for MS and 140-1600 for MS/MS. Mass spectra were acquired for 10 min setting the parameters by information-dependent acquisition (IDA) method. All spectra were searched against MSDB. Database searching was done using MASCOT search program (Version 1.6, Matrix Science, UK). Modifications considered were oxidation of methionine and carbamidomethylation of cysteine while searching. Search was further refined to include peptides with charged state from +2 to +3. The peptide mass tolerance range was ±1.2 KDa and fragment mass tolerance was ±0.6 KDa. Hits with a probability based Mowse score more than the designated value were considered successfully identified. All the selected hits had a P-value of < 0.05.
RNA Isolation and Real Time-PCR
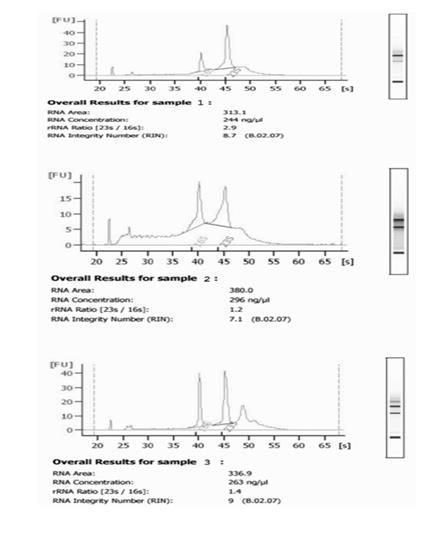
RNA was isolated from ESP, RSP and replicating phase (O.D.600 ~ 0.5) cells of M. bovis BCG. From various growth phases described above 10 ml culture was harvested in triplicate from three independent experiment setup. RNA isolation was done according to kit protocol (RNeasy Mini Kit, Qiagen) and quantified by Qubit fluorometer (Invitrogen). Each RNA sample was treated with DNaseI, RNase-free (Fermentas) and heat inactivated according to manufacturer’s instructions. RNA integrity was checked by Bioanalyzer (Agilent Technologies, USA) (Figure 1). DNA contamination was checked by (no-RT) PCR for each RNA sample in a gradient cycler (Master-cycler Gradient, Eppendorf, Germany) using 16S rRNA primer. No amplification was seen after 30 cycles of PCR. 300-400 ng RNA was used for cDNA synthesis using random hexamer primers by RevertAidTm first strand H-minus cDNA synthesis kit (Fermentas). Real-time quantitative PCR was performed as described earlier [13] in Light Cycler 480II instrument (Roche) using Light Cycler 480 SYBR Green I Master kit (Roche). Internal primers for each gene were designed using DNA star primer design software and purchased from Sigma-Aldrich. All primer sets were optimized for annealing temperature and concentration to ensure that only a single product of the correct size should be amplified. For Light Cycler reaction, a master mix of the following components was prepared: 7.0 µl PCR grade water, 1.0 µl (0.5 µM) forward primer, 1.0 µl (0.5 µM) reverse primer, 10 µl 2X master mix, 1.0µl cDNA (50-100 ng). Sealed the multi well plate with sealing foil, centrifuged at 1500 g for 1 min and loaded in the Light Cycler 480II instrument. Amplification was performed in triplicate wells for each sample analyzed; control reaction consisting of no template (water) was run with all reactions. In each set of reaction, 16S rRNA was used as a reference gene for normalization of cDNA amount. Relative quantification analysis was done as described previously [13] using efficiency calibrated model [14]. Melting curve analysis was done for each reaction product to ensure the specificity of amplified product. The results were expressed as mean relative expression ratio $$ \mathrm {E} = \frac {1}{2} \mathrm {A} ^ {2} + \mathrm {B} ^ {2} $$ standard deviation for each gene between ESP and RSP using replicating phase RNA as a reference level. Student t-test was performed for significance of relative expression ratio. P < 0.05 was considered significant (*), P < 0.01 was considered highly significant (**) and P > 0.05 was considered not significant.
Results
Proteins Differentially Expressed in ESP and RSP
Comparative proteome analysis was carried out between extended stationary phase and resuscitation phase by 2D-DIGE analysis. The differentially expressed protein spots in ESP and RSP phases were identified by DeCyder V 5.02 software (GE Healthcare, U.S.A.). A total of 848 to 1054 spots were co-detected. Quantification of a given spot in the gel was done in terms of the ratios of Cy3 and Cy5 sample volumes to the standard Cy2 volume. The fold difference in the expression level for each spot was calculated in each gel set. All the gels were matched against the master gel (chosen by the software) using the Cy2 standard gel of the corresponding gels. Matching was further improved by manually checking and confirming the potential spots of interest. A total of 682 to 747 spots were matched with the master gel from each Cy2 gel. Majority of the spots (698 spots) had an average ratio between -1.5 and +1.5. Protein spots that exhibited an average fold change of ≥1.5 were selected for further analysis. Student t-test was performed by the DeCyder software (GE Healthcare, U.S.A.) to test whether the protein spot is actually varying in its abundance in ESP
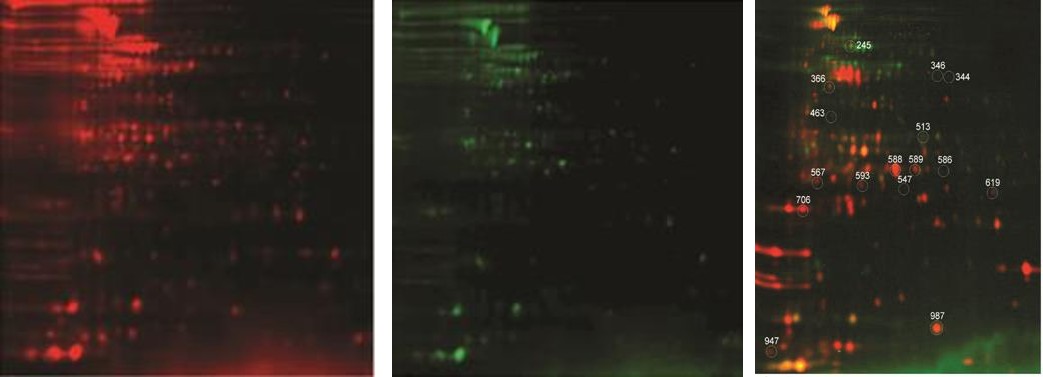
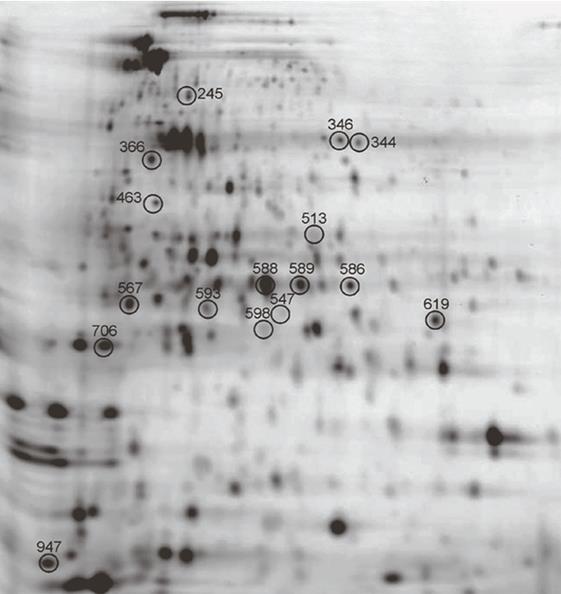
and RSP. The software calculates the mean and SD of the standardized log abundance for this protein spot in each group, performs a student t-test, and obtains a P-value. The P-value less than 0.05, signifies statistically significant difference in the expression levels of the protein in the two groups. If a P-value is more than 0.05, it may not be significant and indicates that there is no difference in the expression of protein in two groups. Statistical analysis was performed for every matched spot-set, comparing the average and SD of protein abundance for a given spot. After excluding the streaks and manually confirming potential spots of interest, a total of 25 spots were found to be differentially expressed on the basis of criteria of more than 1.5 fold differences in expression level and a P-value <0.05 (Figure 2, Table 1). Preparative gels were run and stained with colloidal coomassie staining solution for picking of 25 spots (Figure 3). Out of 25 spots, 16 were successfully identified by Mass spectra analysis (Table 1). Out of the sixteen proteins, differentially expressed eight proteins were more abundantly expressed in resuscitation phase and eight proteins had pronounced expression in nonculturable state. The predicted functions of all the identified proteins and average relative expression ratio were given in Table 2.
2a 2b 2c Figure 2a- c: 2D-DIGE gel images of fluorescent Cy dye labeled ESP and RSP protein samples. (a) ESP protein samples labeled with Cy5. (b) RSP protein samples labeled with Cy3. (c) Overlay image of ESP and RSP gels showing differential expression of proteins in two conditions with each protein spot having specific spot no. mentioned in Table 1.
| Spot | Protein Name | Rv No.a | Av- | Mass/pI | Scorec | Sequence | ||||||||
|---|---|---|---|---|---|---|---|---|---|---|---|---|---|---|
| No | Ratiob | theoretical | Coverage%d | |||||||||||
| 344 | Beta-ketoacyl- ATP synthase | Rv 2246 | -1.63 | 46.563/5.29 | 43 | 18 | ||||||||
| 346 | Probable Glyceraldehyde3-phosphate Dehydrogenase | Rv 4136 | -1.66 | 36.105/5.19 | 29 | 18 | ||||||||
| 366 | Molybdopterin biosnthetase | Rv 0994 | -1.75 | 44.480/6.13 | 25 | 8 | ||||||||
| 463 | Hypothetical Oxidoreductase | Rv 3230c | 1.99 | 30.516/4.70 | 30 | 16 | ||||||||
| 513 | Conversed hypothetical Protien | Rv 2623 | -1.86 | 35.255/5.18 | 26 | 6 | ||||||||
| 567 | Probable L-aspirate Oxidase | Rv 1595 | -4.94 | 54.379/6.24 | 33 | 30 | ||||||||
| 586 | probable Fumarate reductase (FrdA) | Rv 1552 | 2.73 | 64.123/5.88 | 28 | 9 | ||||||||
| 588 | Probable Thiosulfate Sulfurtranferase (CysA2) | Rv 0815c | 3.6 | 31.110/5.14 | 100 | 49 | ||||||||
| 589 | Elongation factor (Tsf) | Rv 2889c | 1.91 | 28.881/5.26 | 41 | 32 | ||||||||
| 619 | Conversed hypothetical | Rv 2739c | -1.86 | 35.255/5.18 | 26 | 6 | ||||||||
| 706 | Possible CoA- Transferase beta subunit | Rv 3552 | 5.44 | 27.574/5.97 | 26 | 3 |
Table 1: Summary of proteins differentially expressed in extended stationary and resuscitation phase of M. bovis BCG by 2D-DIGE a
Average relative expression ratio
Average relative expression ratio of the genes by real time-PCR GENES
of the proteins identified in 2D-
DIGE experiments
Predicted Function
ESP RSP ESP RSP
Rv 2246 1.63 1.0 0.484 0.186 Involved in the synthesis of mycolic acids Rv 1436 (GAPDH) 1.66 1.0 0.538 0.229 Probable glyceraldehyde 3- phosphate Rv 0994 1.75 1.0 5.501 0.426 Involved in molybdopterin biosynthesis protein MOEA 1 Rv 3230c 1.0 1.99 0.660 3.072 Hypothetical oxidoreductase Rv 2623 1.86 1.0 7.418 4.305 Universal stress protein Rv 1595 4.94 1.0 0.339 2.044 Probable L-aspirate oxidase (nadB) Rv 1552 1.0 2.73 9.376 23.322 Probable fumerate reductase Rv 0815c 1.0 3.60 0.227 0.395 Probable thiosulfate sulfurtransferase Rv 2739c 1.86 1.0 24.554 3.904 Probable alanine rich transferase Rv 3552 1.0 5.44 5.485 28.003 Probable CoA-transferase (Beta subunit) Rv 1926c 1.99 1.0 3.479 0.748 Immunogenic protein, mpt63 Rv 3248c 1.6 1.0 0.198 0.263 probable adenosyl homocysteinase (SAHH) Rv 1070c 1.0 1.55 0.269 0.359 Probable enoyl-CoA hydratase (ECHA8) dehydrogenase
- Rv 1636
- 1.0 2.12
- 0.479 0.599
- Iron-regulated conversed hypothetical protein
- Rv 3804c
- 1.0 1.68
- 0.022 0.279
- Secreted antigen 85-A, FBPA (mycolyl trasferase 85a)
- Rv 2889c
- 1.0 1.91
- 1.764 7.502
- Probable elongation factor tsf (EF-TS)
Table 2: Average relative expression ratio and probable functions of differentially identified proteins in 2D-DIGE and real
Proteome Analysis was Accompanied by Transcriptional Analysis
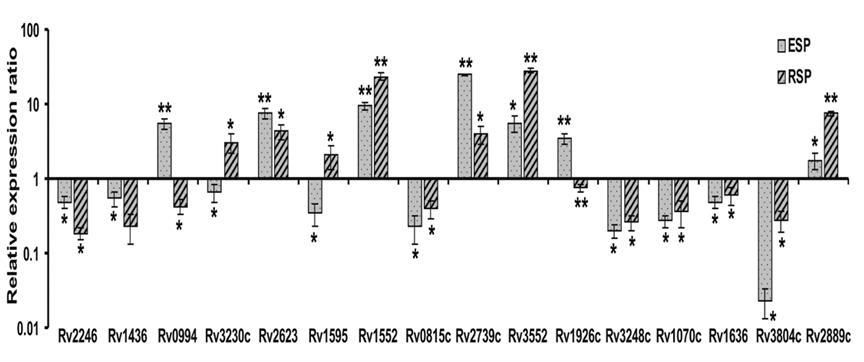
The 16 differentially expressed proteins identified in this study, were further analysed by real time-PCR to have an insight at transcriptional level (Figure 4). The relative expression ratio of all the sixteen genes was observed in ESP and RSP phases using log phase RNA as a positive reference and 16S rRNA for normalization of cDNA. Average relative expression ratio of all the genes have been in given in Figure 3 and Table 2. For fourteen genes, differential expression profile was similar to that found with 2D-DIGE, except the relative expression ratio varied. Rv1595 has 4.94 fold expression in RSP than ESP in 2D- DIGE analysis whereas at RNA level it has 0.339 average relative expression in ESP and 2.044 average relative expression in RSP compared to log phase. Rv3248c has 1.60 fold expressions in ESP than RSP in 2D-DIGE analysis whereas at transcriptional level it has 0.1984 average relative expression in ESP and 0.2625 average relative expression in RSP compared to log phase.
Discussion
M. bovis BCG and M. tuberculosis upon prolonged incubation (~6 months) in stationary phase become nonculturable but can be resuscitated to resume active growth upon addition of resuscitation promoting factors (Rpf) from Micrococcus luteus or M. tuberculosis. The morphological, physiological and molecular similarity of BCG to closely related pathogenic M. tuberculosis accredited its use as a model for the in vitro analysis of the tubercle bacillus and was used for the analysis of the proteins expressed in extended stationary phase [15]. The recombinant Rpf from Micrococcus luteus was cloned and expressed in E. coli and used for resuscitation experiments. The differentially expressed proteins were identified by 2D-DIGE. The 2D-DIGE is a sensitive method for the relative comparison of the expression levels of the same protein in different samples because of the use of two different dyes for the labeling of the two samples separated in a single gel and thereby eliminating the fundamental variation between the two samples [16, 17]. Using this technique, we could successfully identify 16 spots as differentially expressed in the two phases, which were found to be statistically significant by mass spectroscopy. Extended stationary phase is defined to the cells with minimum metabolic state, keeping only those functions necessary to persist and, upon environmental stimuli, activate growth. Cells growth arrest by oxygen limitation, nutrient starvation, secondary metabolite production and pH changes. ESP cells were harvested after the prolonged stationary phase. These cells had characteristic feature of negligible CFU on solid agar plate (< 5 cells/ml). The ESP cells were resuscitated using Micrococcus luteus recombinant Rpf protein. The cells were incubated in fresh Sauton’s medium with ADC and 100 pmol/L freshly prepared recombinant Micrococcus luteus Rpf protein for eight days. Resuscitation was observed by increase in optical density at 600 nm compared to control (Figure 5). The results revealed several proteins differentially regulated in two phases (Figure 1). The proteins upregulated in nonculturable phase belonged to conserved hypothetical, lipid metabolism, intermediary metabolism and respiration, virulence detoxification and adaptation, cell wall and cell processes pathways. These included Rv2623, Rv2246, Rv1436, Rv0994, Rv1595, Rv2739c, Rv1926c and Rv3248c.
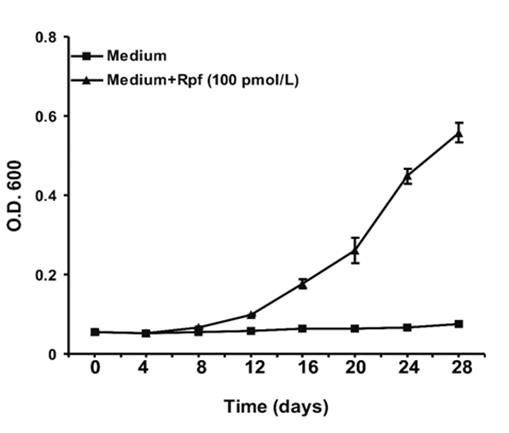
Figure 5: The response of aged M. bovis (BCG) (6 month- old culture) to recombinant Micrococcus luteus Rpf was observed by increase in O.D.600 of culture with time. The NC cells were removed by centrifugation at 6000g for 10 minutes and 100 cells/ml were aliquoted into two 100 ml fresh Sauton’s medium supplemented with ADC. In one of the flask filter sterilized recombinant Micrococcus luteus Rpf protein (100 pmol/L) was added and in other flask, no protein was added. Both the flask were incubated at 37 0C without shaking.
Rv2623 (virulence, detoxification and adaptation) is a conserved hypothetical protein belonging to a family of proteins that function biochemically as ATPase or ATP binding molecular switch for cellular processes [18]. The expression of Rv2623 is upregulated in BCG in standing cultures, in Wayne dormancy model and during infection of the macrophage cell line THP1 and J774.16 macrophages [9, 19]. Rv2623 appears to regulate mycobacterial growth in vitro and in vivo and is required for the entry of the tubercle bacillus into the chronic phase of infection in the host [9]. It is proposed that Rv2623 may function as an ATP-dependent signaling intermediate in a pathway that promotes persistent infection and was also found to be upregulated in our study [20]. Rv2246 (KasB) together with KasA is involved in the synthesis of mycolic acids [10]. KasA has been shown to specifically elongate palmitoyl-CoA to monounsaturated fatty acids averaging 40 carbons in length, and overproduction of KasB in the presence of KasA leads to the production of even longer chains. KasB mutant in Mycobacterium marinum synthesized mycolic acids that were 2-4 carbons shorter than wild-type and grew poorly in macrophages [21] thus the upregulation of KasB in ESP phase may be required to increase full length oxygenated mycolic acids during dormancy, for the requirement of long chain mycolic acids during intracellular growth. We have found some proteins associated with intermediary metabolism and respiration upregulated in ESP, which are necessary for persistence. Rv0994, Rv1436, Rv2739c have been shown to be necessary for the cell survival in anaerobiosis and nutrient starvation. Rv0994 (moeA1) has been annotated as probable molybdopterin biosynthesis protein, involved in the biosynthesis of demolybdo-cofactor (molybdopterin), necessary for molybdo-enzymes (www.sanger.ac.uk). Molybdopterin is a cofactor required for nitrate reductase and other enzymes involved in anaerobic metabolism. M. tuberculosis dedicates 21 genes to the biosynthesis of these cofactors [22]. Rv0994 has been shown to be required for survival in primary murine macrophages in M. tuberculosis H37Rv [23]. Rv1436 has been annotated as probable glyceraldehyde-3-phosphate dehydrogenase (GAPDH). GAPDH is a key enzyme in intermediary metabolism and operates at the sixth step in glycolysis. In yeast, pyruvate can subsequently be anaerobically metabolized to ethanol by the reduction of acetaldehyde by alcohol dehydrogenase and NADH. This reaction regenerates the pool of NAD+, allowing glycolysis to occur under anaerobic conditions. Similarly, in mycobacterium, anaerobic respiration may occur to generate energy for metabolism. The upregulation of GAPDH observed earlier in standing BCG cultures may be necessary to satisfy the energy demands of these bacteria during adjustment to growth under reduced oxygen tension in standing cultures [24]. Rv1436 along with Rv1595 have been classified as essential genes [25] and may require investigation as targets for persistence. Rv1926c (mpt63) which is a 16 KDa immunoprotective extracellular protein, is involved in cell wall and cell process [26]. Thus, the proteins identified in ESP appear to be necessary for the survival of the bacilli in stress conditions namely: nutrient stress, acidic stress and low oxygen stress during incubation of the culture for prolonged period of time. These proteins serve as a marker for dormancy and maintain the minimal growth for the survival of the bacilli. Long-term incubation of mycobacterial culture produces dormant cells in which cell division completely stops and thickening of cell wall occurs. The transfer of cells to fresh aerated medium results in their synchronous division Wayne, Sohaskey, & Wayne LG [8] as dormant cells in Wayne model remain culturable. However, incubation in prolonged stationary phase produces nonculturable cells such cells in contrast to dormant cells in Wayne model completely lose the ability to form colonies on agar medium [5]. These cells can be reactivated by incubation in a liquid nutrient medium having resuscitation promoting factor. It is known that chemical communication of gram +ve bacteria occurs via secreted oligopeptides and proteins Voloshin & kaprelyants. The Rpf protein is also such a mediator of bacterial communication Salina et al., 2006. The important role of Rpf protein in the reactivation of nonculturable cells has been explored by investigating the interacting partner of Rpf protein. Recently, RpfB was shown to interact with a putative mycobacterial endopeptidase, designated as Rpf-interacting protein A (RipA) [3]. The two proteins colocalize to the septa of dividing cells suggesting a role for the RipA-RpfB complex in peptidoglycan hydrolysis during cell division. The peptidoglycan hydrolase activity of Rpf somewhat works in loosening of the thickened cell wall of NC cells, as a result, bacteria would become more sensitive to external environment and trophic stimuli such as amino acids, ions, reactivated oxygen species etc., which may initiate viable activity. The major proteins upregulated in resuscitation phase belonged to intermediary metabolism and respiration, cell wall and cell process category and included Rv0815c, Rv3230c, Rv2889c, Rv3804c, Rv1636, Rv1070c, Rv3552, and Rv1552 (Table S1).
| Genes | Forward and reverse primers (5’-3’) | ||||
|---|---|---|---|---|---|
| Rv2246 | TCGCCGGGTTCGCTCAGATG | ||||
| CGTGCCTTGGCGTGCCTCCTC | |||||
| Rv1436 | AATCCACCGGCCTGTTCACC | ||||
| GTTCTGGCTGCCGTCATACTTGTC | |||||
| Rv0994 | CAATCGGGCTGAGGTCGTGGTGA | ||||
| GGGTTGGCCGGCAGCAGAAAG | |||||
| Rv3230c | ACCGCAGCTGACGTGATGTTC | ||||
| CCTTGTCGGCCTGGTTGAG | |||||
| Rv2623 | CACGGGCGCCACCTGAT | ||||
| ACTTCCGAGACAACCCACGACCAT | |||||
| Rv1595 | CGGCGGGCTCGGGCACCTGTA | ||||
| GGCGCGTCCGGCAAAAAGCATC | |||||
| Rv1552 | TCGACGACGGCAGGGTATGTGG | ||||
| TCTTGACGTTCGCGTTGGTGGTGA | |||||
| Rv0815c | CGGCCATCAACGTCAAGAACCTCA | ||||
| GCGTAAAGCTTGGCCAACTCCTCA | |||||
| Rv2739c | GCCTGGTGGTGTCGCGTTTGAGC | ||||
| GCACCCCGGCCAGCAGCGTCTT | |||||
| Rv3552 | GGCGCCCCAAACAGGATT | ||||
| GCCCGAACGCCGAGATG | |||||
| Rv1926c | CAAGTCGTGCTCGGCTGGAAGGTC | ||||
| GGCGGTGCGGGCATTGAACTG | |||||
| Rv3248c | CCGCCCGCCGAGGAGGACGAC | ||||
| CGGCCGCGGCGAATTGGTAGAGC | |||||
| Rv1070c | CGTTCACCGCCGACTTCTTC | ||||
| GCACGCCCAGCTTTATCTCG | |||||
| Rv1636 | TGCACGACGCCAAGGAACGAG | ||||
| CAGACCGACATTGCCGACGACCAG |
| Rv3804c | AGTCGGGCCTGTCGGTGGTC |
|---|---|
| AGCTCGCTGGTCAGGAAGGT | |
| Rv2889c | AAACCGACGGGGACTTC |
| GCCGCCGCGACCACTTG | |
| 16S rRNA | TCCCGGGCCTTGTACACA |
| CCACTGGCTTCGGGTGTTA |
Table S1: Internal primers for the real time-PCR experiment of the identified genes in 2D-DIGE analysis. Primers were designed using DNAstar primer design software. Rv0815c (CysA2) is a part of ABC transporter for the prototrophic acquisition of sulphur as sulphate and disruption in cysA2 has been demonstrated to generate auxotrophy for methionine and appears to be the sole locus encoding inorganic sulphur transport in the M. tuberculosis complex [27]. Sulphur is essential for some of the most vital biological activities such as translation initiation and redox maintenance. An interesting aspect of this enzyme is its possible role in the assembly of iron- sulfur clusters (4Fe-4S) which are identified as biosensors of both oxygen and iron concentrations. This may also be important in the response of M. tuberculosis to low- oxygen environments within macrophages and granulomas, cysA2 gene was shown to be activated during reactivation of M. tuberculosis infection by dexamethasone treatment indicating the importance of both iron and sulfur metabolism in M. tuberculosis during reactivation [28]. Furthermore, CysA2 has been identified as a candidate serodiagnostic marker in M. tuberculosis infection [29] and it was found to be up regulated in RSP by 2D-DIGE and western blot analysis. Rv3230c (Intermediary metabolism and respiration) is a hypothetical oxido-reductase and is involved in lipid metabolism, modification of fatty acids or mycolic acids. The gene is reported to be down regulated during nutrient starvation [30] and is expressed in lungs during infection in mice with M. tuberculosis [31]. Rv1552 is fumarate reductase, an enzyme that plays a central role in the functioning of TCA cycle during anaerobic conditions Segal, et al. Rv2889c probable elongation factor TSF (EF- TS) involve in ribosomal protein synthesis and modification. Rv2889c showed increase level of expression during RSP, which indicates its importance in protein synthesis during resuscitation from non- culturability. Rv2889c is predicted to be an essential gene [25]. Our results also suggest the surprising possibility that some of the most potent mycobacterial antigens are activated during the reactivation. Antigen 85A (Rv3804c) play important role in cell wall construction [32] and has been shown to drive human T-cells to differentiate towards a Th1 phenotype in in vitro models [33]. When Ag85A is injected into C57 BL/6 mice, an elevated IFN-γ response is generated that is protective against i.v. challenge with wild type M. tuberculosis [12]. Thus, the up regulation of this protein in resuscitation phase may play important role in cell wall formation and make the cells susceptible to the drugs against replicating mycobacteria. The proteins identified by DIGE were found to be regulated at transcriptional level as determined by qPCR except for two genes Rv1595 and Rv3248c, which showed differing results. The discrepancy was observed in relative fold expression between 2D-DIGE and qPCR. The inconsistency may be because, in 2D-DIGE experiments, multiple spots are observed for same protein with different pI values and differential expression was observed by comparing 18 gels at the same time whereas transcriptional analysis represents total mRNA of the cell. Furthermore, the discrepancy could be either due to different sensitivity of two methods or different regulation. In addition, the effect of post-transcriptional modification and stability of RNA could not be neglected. The study led us to identify several proteins, differentially expressed at proteome as well as RNA level and needs to be examined for their role in the resuscitation phase, which might be crucial in exit from dormancy and could thus become potential targets. Rv0815c (CysA2) has been identified as a candidate serodiagnostic marker in M. tuberculosis infection was found to be up regulated in RSP by 2D-DIGE. Although the study do not reveal complete proteome of ESP and RSP cells but some of the proteins identified may be evaluated further for their role in resuscitation of dormant M. tuberculosis and serve as targets for persistence and reactivation of the tuberculosis [34, 35, 36, 37, 38, 39, 40].
Acknowledgement
We thank Director for facilities and support. 2D-DIGE analysis and mass spectroscopic identification of proteins were carried out at the Clinical Proteomic Facility at AIIMS (a facility supported by the Department of Biotechnology, Government of India). AY and RKG were SRF, CSIR. Support from CSIR (NIF) and DBT is acknowledged. This is the CDRI communication number 7690.
Conclusion
Dormancy and reactivation are two important aspects of pathogenesis in tuberculosis. In an in- vitro model, dormant non culturable Mycobacterium bovis BCG cells were generated by prolonged incubation in stationary phase which could be reverted to replicating phase by addition of resuscitation promoting factor (Rpf) protein isolated from Micrococcus luteus. Using fluorescent 2D- DIGE technique, protein expression profile in non culturable and resuscitation phase revealed differential expression of proteins at proteome as well as RNA level. The proteins thus identified may represent targets for persistence and reactivation.
References
-
Flynn JL, Chan J (2001) Tuberculosis: latency and reactivation. Infect Immun 69(7): 4195-4201.
-
Manabe YC, Bishai WR (2000) Latent Mycobacterium tuberculosis-persistence, patience, and winning by waiting. Nat Med 6(12): 1327-1329.
-
Hett EC, Chao MC, Steyn AJ, Fortune SM, Deng LL, et al. (2007) A partner for the resuscitation-promoting factors of Mycobacterium tuberculosis. Mol Microbiol 66(3): 658-668.
-
Mukamolova GV, Kaprelyants AS, Young DI, Young M, Kell DB (1998) A bacterial cytokine. Proc Natl Acad Sci U S A 95(15): 8916-8921.
-
Shleeva MO, Mukamolova GV, Telkov MV, Berezinskaia TL, Syroeshkin AV, et al. (2003) Formation of nonculturable Mycobacterium tuberculosis and their regeneration. Mikrobiologiia 72(1): 76-83.
-
Mukamolova GV, Turapov OA, Young DI, Kaprelyants AS, Kell DB, et al. (2002) A family of autocrine growth factors in Mycobacterium tuberculosis. Mol Microbiol 46(3): 623-635.
-
Russell-Goldman E, Xu J, Wang X, Chan J, Tufariello JM (2008) A Mycobacterium tuberculosis Rpf double- knockout strain exhibits profound defects in reactivation from chronic tuberculosis and innate immunity phenotypes. Infect Immun 76(9): 4269- 4281.
-
Wayne LG, Hayes LG (1996) An in vitro model for sequential study of shift down of Mycobacterium tuberculosis through two stages of non replicating persistence. Infect Immun 64(6): 2062-2069.
-
Boon C, Li R, Qi R, Dick T (2001) Proteins of Mycobacterium bovis BCG induced in the Wayne dormancy model. J Bacteriol 183(8): 2672-2676.
-
Schaeffer ML, Agnihotri G, Volker C, Kallender H, Brennan PJ, et al. (2001) Purification and biochemical characterization of the Mycobacterium tuberculosis beta-ketoacyl-acyl carrier protein synthases KasA and KasB. J Biol Chem 276(50): 47029-47037.
-
Jungblut PR, Schaible UE, Mollenkopf HJ, Zimny-Arndt U, Raupach B, et al. (1999) Comparative proteome analysis of Mycobacterium tuberculosis and Mycobacterium bovis BCG strains: towards functional genomics of microbial pathogens. Mol Microbiol 33(6): 1103-1117.
-
Tanghe A, Content J, Van Vooren JP, Portaels F, Huygen K (2001) Protective efficacy of a DNA vaccine encoding antigen 85A from Mycobacterium bovis BCG against Buruli ulcer. Infect Immun 69(9): 5403-5411.
-
Gupta A, Kaul A, Tsolaki AG, Kishore U, Bhakta S (2012) Mycobacterium tuberculosis: immune evasion, latency and reactivation. Immunobiology 217(3): 363-374.
-
Pfaffl MW (2001) A new mathematical model for relative quantification in real-time RT-PCR. Nucleic Acids Res 29(9): e45.
-
Lim A, Eleuterio M, Hutter B, Murugasu-Oei B, Dick T (1999) Oxygen depletion-induced dormancy in Mycobacterium bovis BCG. J Bacteriol 181(7): 2252- 2256.
-
Tonge R, Shaw J, Middleton B, Rowlinson R, Rayner S, et al. (2001) Validation and development of fluorescence two-dimensional differential gel electrophoresis proteomics technology. Proteomics 1(3): 377-396.
-
Patton WF (2000) A thousand points of light: the application of fluorescence detection technologies to two-dimensional gel electrophoresis and proteomics. Electrophoresis 21(6): 1123-1144.
-
Zarembinski TI, Hung LW, Mueller-Dieckmann HJ, Kim KK, Yokota H, et al. (1998) Structure-based assignment of the biochemical function of a hypothetical protein: a test case of structural genomics. Proc Natl Acad Sci U S A 95(26): 15189- 15193.
-
Monahan IM, Betts J, Banerjee DK, Butcher PD (2001) Differential expression of mycobacterial proteins following phagocytosis by macrophages. Microbiology 147(2): 459-471.
-
Drumm JE, Mi K, Bilder P, Sun M, Lim J, et al. (2009) Mycobacterium tuberculosis universal stress protein Rv2623 regulates bacillary growth by ATP-Binding: requirement for establishing chronic persistent infection. PLoS Pathog 5(5): e1000460.
-
Gao LY, Groger R, Cox JS, Beverley SM, Lawson EH, et al. (2003) Transposon mutagenesis of Mycobacterium marinum identifies a locus linking pigmentation and intracellular survival. Infect Immun 71(2): 922-929.
-
Cole ST, Brosch R, Parkhill J, Garnier T, Churcher C, et al. (1998) Deciphering the biology of Mycobacterium tuberculosis from the complete genome sequence. Nature 393(6685): 537-544.
-
Rengarajan J, Bloom BR, Rubin EJ (2005) Genome- wide requirements for Mycobacterium tuberculosis adaptation and survival in macrophages. Proc Natl Acad Sci USA 102(23): 8327-8332.
-
Florczyk MA, McCue LA, Stack RF, Hauer CR, McDonough KA (2001) Identification and characterization of mycobacterial proteins differentially expressed under standing and shaking culture conditions, including Rv2623 from a novel class of putative ATP-binding proteins. Infect Immun 69(9): 5777-5785.
-
Sassetti CM, Boyd DH, Rubin EJ (2003) Genes required for mycobacterial growth defined by high density mutagenesis. Mol Microbiol 48(1): 77-84.
-
Horwitz MA, Lee BW, Dillon BJ, Harth G (1995) Protective immunity against tuberculosis induced by vaccination with major extracellular proteins of Mycobacterium tuberculosis. Proc Natl Acad Sci U S A 92(5): 1530-1534.
-
Wooff E, Michell SL, Gordon SV, Chambers MA, Bardarov S, et al. (2002) Functional genomics reveals the sole sulphate transporter of the Mycobacterium tuberculosis complex and its relevance to the acquisition of sulphur in vivo. Mol Microbiol 43(3): 653-663.
-
Talaat AM, Ward SK, Wu CW, Rondon E, Tavano C, et al. (2007) Mycobacterial bacilli are metabolically active during chronic tuberculosis in murine lungs: insights from genome-wide transcriptional profiling. J Bacteriol 189(11): 4265-4274.
-
Choi GE, Eom SH, Jung KH, Son JW, Shin AR, et al. (2010) CysA2: A candidate serodiagnostic marker for Mycobacterium tuberculosis infection. Respirology 15(4): 636-642.
-
Betts JC, Lukey PT, Robb LC, McAdam RA, Duncan K (2002) Evaluation of a nutrient starvation model of Mycobacterium tuberculosis persistence by gene and protein expression profiling. Mol Microbiol 43(3): 717-731.
-
Dubnau E, Fontán P, Manganelli R, Soares-Appel S, Smith I (2002) Mycobacterium tuberculosis genes induced during infection of human macrophages. Infect Immun 70(6): 2787-2795.
-
Armitige LY, Jagannath C, Wanger AR, Norris SJ (2000) Disruption of the genes encoding antigen 85A and antigen 85B of Mycobacterium tuberculosis H37Rv: effect on growth in culture and in macrophages. Infect Immun 68(2): 767-778.
-
Russo DM, Kozlova N, Lakey DL, Kernodle D (2000) Naive human T cells develop into Th1 effectors after stimulation with Mycobacterium tuberculosis- infected macrophages or recombinant Ag85 proteins. Infect Immun 68(12): 6826-6832.
-
Biketov S, Mukamolova GV, Potapov V, Gilenkov E, Vostroknutova G, et al. (2000) Culturability of Mycobacterium tuberculosis cells isolated from murine macrophages: a bacterial growth factor promotes recovery. FEMS Immunol Med Microbiol 29(4): 233-240.
-
Biketov S, Potapov V, Ganina E, Downing K, Kana BD, et al. (2007) The role of resuscitation promoting factors in pathogenesis and reactivation of Mycobacterium tuberculosis during intra-peritoneal infection in mice. BMC Infect Dis 7: 146.
-
Chan J, Flynn J (2004) The immunological aspects of latency in tuberculosis. Clin Immunol 110(1): 2-12.
-
Gupta RK, Srivastava BS, Srivastava R (2010) Comparative expression analysis of rpf-like genes of Mycobacterium tuberculosis H37Rv under different physiological stress and growth conditions. Microbiology 156(9): 2714-2722.
-
Manabe YC, Kesavan AK, Lopez-Molina J, Hatem CL, Brooks M, et al. (2008) The aerosol rabbit model of TB latency, reactivation and immune reconstitution inflammatory syndrome. Tuberculosis (Edinb) 88(3): 187-196.
-
Shleeva MO, Bagramyan K, Telkov MV, Mukamolova GV, Young M, et al. (2002) Formation and resuscitation of "non-culturable" cells of Rhodococcus rhodochrous and Mycobacterium tuberculosis in prolonged stationary phase. Microbiology 148(5): 1581-1591.
-
Tufariello JM, Mi K, Xu J, Manabe YC, Kesavan AK, et al. (2006) Deletion of the Mycobacterium tuberculosis resuscitation-promoting factor Rv1009 gene results in delayed reactivation from chronic tuberculosis. Infect Immun 74(5): 2985-2995.
- Bedside Pulmonary Rehabilitation – Mandatory and Cost- Effective Tools
- The Role of Chest Radiology in Traumatic Injuries: A Comprehensive Narrative Review
- Pseudosepsis in Acute Inflammation of the Lung
- An Overview of Lung Injury in Covid-19: Evaluating the Impact of Re-Exposure and Emerging Variants
- Fibreoptic Bronchoscopy-its Role in Pulmonary Medicine-Current Trends in Intensive Care Unit
- Retrospective Study on the Efficacy of Homoeopathic Medicines in the Treatment of Acute Rhinitis