Serum Soluble Interleukin 2 Receptor Alpha vs. Urinary Parameter and Serum Immunological Markers as a Monitoring Tool of Treatment Response of Lupus Nephritis and their Relation to Lupus Nephritis Class on Renal Biopsy
Background: Lupus Nephritis (LN) is one of the most common and serious manifestations in SLE patients that causes significant morbidity and mortality. Current conventional biomarkers for LN are sometimes unable to predict treatment response of lupus nephritis. Recently serum soluble interleukin-2 receptor alpha (sIL-2 R alpha) is shown to be a good marker to predict treatment response of LN. Objective: To compare serum sIL-2R alpha with other commonly used markers as a marker of treatment response of LN and their relation to the LN class in renal biopsy. Methods: This prospective observational study was conducted in the Department of Nephrology, Bangabandhu Sheikh Mujib Medical University (BSMMU), Dhaka, Bangladesh from July 2018 to August 2019. Twenty seven patients who were diagnosed with lupus nephritis after kidney biopsy were included in this study. Serum soluble interleukin-2 receptor alpha, 24 hrs UTP, anti-dsDNA, complements level (C3 & C4) were measured in all patient at baseline, 3-months and 6- months after treatment. Serum soluble interleukin-2 receptor alpha level was measured by ELISA and is expressed as pg/mg. Serum sIL-2R alpha as well as conventional biomarker value were compared before and after treatment and in between treatment response and non-response group. Results: Serum sIL-2R alpha levels were significantly higher in patients of proliferative lupus nephritis (Class III & Class IV) than non-proliferative lupus nephritis (Class V) at baseline (3934.3 ± 1095.2, 3934.3 ± 1095.2 & 1801.98 ± 205.8 pg/L respectively) and levels were decreased significantly 6 months after treatment (p <0.001). Serum sIL-2R alpha levels were also significantly higher in non-remission proliferative group then remission proliferative group (4071.60 ± 769.91 vs 5169.20 ± 394.76) with p value 0.008 at baseline. In contrast no significant difference were observed for 24 hrs UTP levels at baseline between this group which suggest that serum sIL-2R alpha are more sensitive marker than 24 hrs UTP in predicting treatment response of lupus nephritis. Conclusions: Serum sIL-2R alpha might be a valuable serological biomarker to diagnose and to predict and monitor the treatment response of lupus nephritis.
Introduction
Systemic Lupus Erythematosus (SLE) is a chronic autoimmune disease which affects almost every system in the body with different degrees of severity [1]. One of the most common manifestations of SLE is lupus nephritis [2]. Up to 50% of SLE patients will have clinically evident kidney disease at presentation and 60% during follow-up [3]. Though renal biopsy is the gold standard for providing information on the histological classes of lupus nephritis, the relative degree of activity and chronicity in the glomeruli and assessing response to therapy but frequently repeating biopsies is an unrealistic management tool to monitor response [4]. Treatment response in lupus nephritis (LN) is defined clinically, without consideration of renal histology [5]. However, these traditional markers are often not as specific as desired in situations of diagnostic dilemma [6]. In addition, persistent proteinuria does not always reflect ongoing disease activity and could also be due to renal damage. Repeat kidney biopsy, though useful, is an invasive procedure with its own complications [7]. Furthermore, none of these traditional markers has been shown to possess the ability to predict histology [2]. Thus, future research should be undertaken to evaluate novel biomarkers that can facilitate early diagnosis, assessing disease severity and predict and monitor treatment response and disease progress are clearly necessary [8, 9]. One of this biomarker is soluble Interleukin-2 receptor alpha. Previous studies have reported that IL-2R levels were higher in patients with SLE than that in controls [10]. Higher levels of 1L-2R in the serum was found to be related to severe lupus nephritis, serum IL-2R levels was found to be correlated positively with anti-dsDNA titers and negatively with serum C3 and C4 levels in such patients10. Serum sIL-2R correlated to the activity of the disease as well [11]. Follow up of the lupus nephritis patients after treatment showed decreased serum 1L-2R levels with reduction of disease activity [10]. Serum soluble IL-2a receptor is more sensitive markers of disease activity than C3 or C4 in predicting improvement [10]. Thus this marker may have the potential to serve as novel marker for detection of lupus nephritis and assessment of its activity and treatment response. In this study serum sIL-2R alpha has been evaluated as a marker for diagnosis and prediction of treatment response of lupus nephritis.
Materials and Method
This prospective observational study was conducted in the Department of Nephrology and Department of Rheumatology, Bangabandhu Sheikh Mujib Medical University (BSMMU), Dhaka, Bangladesh from July 2018 to August 2019 among twenty seven patients (27) who were diagnosed with lupus nephritis after kidney biopsy. All participants were explained about the natural history, pathophysiology, relevant investigations, current treatment options and outcome of lupus nephritis prior to enrollment. Renal biopsy was done after taking informed written consent who willingly agreed to participate in this study.
Inclusion Criteria
- Age ≥18 years of both sexes
- Diagnosed case of SLE with lupus nephritis, according to revised ACR criteria.
- Biopsy proven class III, IV & V lupus nephritis.
Exclusion Criteria
- Pregnant and lactating women.
- Patients with malignancy.
- Patients with active infection.
- Patients with autoimmune disease other than SLE.
- End stage renal disease or dialysis dependent patients.
The renal histology was classified according to the International Society of Nephrology/Renal Pathology Society. According to the abbreviated version of the classification, combined classes III/V or IV/V will be considered as class III or IV, respectively. Out of those patients who were class III, IV and V LN diagnosed histologically without any features of exclusion criteria and willing to participate in this study were finally enrolled for this study. Renal SLEDAI (rSLEDAI) was used to assess kidney disease activity. The score consists of the four kidney-related parameters: hematuria, pyuria, proteinuria, and urinary casts. Scores for the renal SLEDAI can range from 0 (inactive renal disease) to a maximum of 16. Active lupus nephritis was those with an rSLEDAI score of 4 or more. Then they were thoroughly appraised about the study as well as drug treatment and follow up. Before starting the treatment base line levels of CBC, ESR, CRP, Urine R/M/E, UTP, S. Creatinine, S. Electrolytes, S. ALT, ANA, Anti-dsDNA, C3, C4, Serum levels of soluble interleukin-2 receptor alpha was measured and after starting the treatment levels of CBC, ESR, Urine R/M/E, UTP, S. Creatinine, Anti-dsDNA, C3, C4, and serum levels of soluble interleukin-2 receptor alpha was measured at 3rd and 6th month. Patients were received either intravenous Cyclophosphamide (NIH protocol) or Mycophenolatemofitel (MMF) -2 gm/day) as induction therapy for 6 months.
Computer based statistical analysis was carried out with appropriate techniques and systems. All data were recorded systematically in preformed data collection form. Quantitative data were expressed as mean and standard deviation and qualitative data were expressed as frequency distribution and percentage. Statistical analyses were performed by using windows based computer software with Statistical Packages for Social Sciences (SPSS-23) (Armonk, NY: IBM Corp). Level of significant were seen by pair t-tests, unpair t-test and Youden index for best cut-off value. Correlation between variable was examined by Pearson’s correlation test. For all statistical tests, we considered p value <0.05 as statistically significant.
| Frequency (n) | Percentage (%) | |
|---|---|---|
| Age | ||
| ≤20 | 8 | 29.6 |
| 21-30 | 12 | 44.4 |
| >30 | 7 | 25.9 |
| Gender | ||
| Male | 3 | 11.1 |
| Female | 24 | 88.9 |
| ISN/RPS classification | ||
| Class III | 5 | 18.5 |
| Class IV | 13 | 48.1 |
| Class V | 9 | 33.3 |
Table 1: Baseline characteristics of the study subjects.
Table 2 shows urine RME findings of 27 lupus nephritis patients at baseline, after 3 months and after 6 months. At baseline protein was three plus in 16 (59.3%) case which is the highest rate. After 6 months of treatment protein was one plus in 11 (40.7 %) case which is the highest rate. The mean RBC were at baseline, after 3 and 6 months of treatment were 41.07 ± 51.49, 4.29 ± 7.22 and 2.11 ± 3.6 per high power field respectively and WBC counts were at baseline, after 3 and 6 months of treatment were 13.74 ± 15.38, 5.62 ± 5.73 and 3.37 ± 1.33 per high power field respectively.
Results
A total number of 27 patients were evaluated over a period of July 2018 to August 2019. Table 1 shows maximum patients (44%) were in the age group of 21-30 years. Females were predominant to males and most patients were in class IV group 13 (48.1%).
| Baseline | After 3 months | After 6 months | |
|---|---|---|---|
| Pus cell (cells per HPF) | 13.74 ± 15.38 | 5.62 ± 5.73 | 3.37 ± 1.33 |
| RBC (cells per HPF) | 41.07 ± 51.49 | 4.29 ± 7.22 | 2.11 ± 3.60 |
| Protein Nil | 0 (0.0) | 2 (7.4) | 7 (25.9) |
| + | 0 (0.0) | 7 (25.9) | 11 (40.7) |
| ++ | 10 (37.0) | 12 (44.4) | 6 (22.2) |
| +++ | 16 (59.3) | 6 (22.2) | 3 (11.1) |
| ++++ | 1 (3.7) | 0 (0.0) | 0 (0.0) |
| CAST | 6 (22.2) |
Table 2: Urine RME of the study subjects at baseline, after 3 month and 6 month of treatment. SD: Standard deviation, RME: Routin
Table 3 shows Urine abnormalities at baseline according to different classes of lupus nephritis. In Class III lupus nephritis most of the patients (80%, n=4) had 24-hour urinary total protein of >500 mg/day – 2.9 gm/day. In Class IV lupus nephritis most of the patients (53.8%, n=7) had 24-hour urinary total protein of >500 mg/day – 2.9 gm/ day and in Class V lupus nephritis all patient (100%, n=9) patient had proteinuria > 3 gm/day. In Class III & Class IV
- lupus nephritis 100 % patients had RBC > 5/HPF and in class
- V lupus nephritis most of the patient 7 (77.8%) had RBC ≤5/
- HPF.
- Class III
- Class IV
- Class V p-value
- Proteinuria (24 hour UTP)
- 500 mg/day -3 gm/day
- 4 (80.0)
- 7 (53.8)
- 0 (0.0)
- 0.006
- >3 gm/day
- 1 (20.0)
- 6 (46.2)
- 9 (100.0)
- RBC
- >5/HPF
- 5 (100.0)
- 13 (100.0)
- 2 (22.2)
- 0.001
- <5/HPF
- 0 (0.0)
- 0 (0.0)
- 7 (77.8)
Table 3: Urine abnormalities at baseline according to classes of lupus nephritis (n=27).
Table 3: Urine abnormalities at baseline according to classes of lupus nephritis (n=27). UTP: Urinary total protein, HPF: High power field. Chi-square test Table 4 shows laboratory parameter of the study subjects at baseline. At baseline Serum sIL-2Ra level is significantly higher (p=<0.001) in proliferative (class III+IV) then membranous (class V) lupus nephritis but 24 hrs UTP is significantly higher (p=<0.001) in membranous (class V) then proliferative (class III+IV).
| Proliferative (class III+IV) | Non proliferative (class V) | p-value | |
|---|---|---|---|
| sIL-2Ra (pg/ml) | 4376.49 ± 843.20 | 1801.98 ± 205.82 | <0.001 |
| UTP (gm/day) | 2.84 ± 1.00 | 5.07 ± 2.06 | 0.001 |
| S.Creatinine (mg/dl) | 1.15 ± 0.37 | 0.86 ± 0.15 | 0.036 |
| C3 (g/l) | 0.47 ± 0.32 | 0.89 ± 0.43 | 0.009 |
| C4 (g/l) | 0.10 ± 0.06 | 0.24 ± 0.26 | 0.04 |
| Anti-ds DNA | 162.45 ± 146.00 | 95.83 ± 74.31 | 0.212 |
| Renal SLEDAI | 12.22 ± 3.21 | 5.33 ± 2.83 | <0.001 |
| SLEDAI | 21.33 ± 4.34 | 10.44 ± 5.64 | <0.001 |
Table 4: Laboratory parameter of the study subjects at baseline (n=27). Unpaired ‘t’ test was done to examine the level of signif
Table 4: Laboratory parameter of the study subjects at baseline (n=27). Unpaired ‘t’ test was done to examine the level of significance Table 5 show pre-treatment (at baseline) and post treatment (after 6 month) value of different parameter in proliferative (Class III & Class IV) and membranous (Class V) lupus nephritis. The value of serum sIL-2Ra, 24hr UTP and Anti ds DNA were significantly different before and after treatment with p value <0.05 in both group but C3 & rSLEDAI only significant in proliferative group. C4 was not significant in both groups.
| Proliferative (Class III+IV) n=18 | Non Proliferative (Class V) n=9 | |
|---|---|---|
| IL-2R | ||
| Baseline | 4376.49 ± 843.20 | 1801.98 ± 205.82 |
| After 6 months | 1563.26 ± 1126.89 | 753.62 ± 299.47 |
| % change | 65.99 ± 20.28 | 57.66 ± 16.64 |
| p-value | <0.001 | <0.001 |
| 24 hr UTP | ||
| Baseline | 2.84 ± 1.00 | 5.07 ± 2.06 |
| After 6 months | 1.53 ± 1.50 | 1.37 ± 1.12 |
| % change | 46.12 ± 47.94 | 72.89 ± 24.76 |
Table 5: IL-2R level at baseline and after 6 months proliferative and non-proliferative patients (n=27). Paired t test was done t
- p-value
- 0.003
- <0.001
- Anti-ds DNA
- Baseline
- 162.45 ± 146.00
- 95.83 ± 74.31
- After 6 months
- 68.90 ± 73.54
- 33.32 ± 33.28
- % change
- 41.78 ± 42.05
- 48.17 ± 33.72 p-value
- 0.002
- 0.031
- C3
- Baseline
- 0.47 ± 0.32
- 0.89 ± 0.43
- After 6 months
- 0.85 ± 0.22
- 0.99 ± 0.18
- % change
- -129.46 ± 101.66
- -29.43 ± 48.11 p-value
- <0.001
- 0.385
- C4
- Baseline
- 0.10 ± 0.06
- 0.24 ± 0.26
- After 6 months
- 0.31 ± 0.58
- 0.44 ± 0.81
- % change
- -339.74 ± 976.55
- -139.04 ± 236.71 p-value
- 0.141
- 0.476 rSLEDAI
- Baseline
- 12.22 ± 3.21
- 5.33 ± 2.83
- After 6 months
- 4.22 ± 3.99
- 3.11 ± 1.76
- % change
- 64.81 ± 31.26
- 35.19 ± 44.45 p-value
- <0.001
- 0.051
Table 6: IL-2R level at baseline and after 6 months proliferative and non-proliferative patients (n=27).
Table 6 shows correlation between serum IL-2R alpha with UTP, Anti-ds DNA, C3, C4, SLEDAI and rSLEDAI at baseline, after 3 month and after 6 months. There were positive but insignificant correlations at base line with 24hrsUTP and anti-ds DNA but positive and significant correlations with rSLEDAI and SLEDAI. There were negative but significant correlations with C3 and insignificant correlations with C4. After 6 month of treatment there were positive and significant correlations with 24hrs UTP, anti- ds DNA, rSLEDAI and SLEDAI and negative but significant correlations with C3 (r = - 0.650 ; p= <0.001) and insignificant correlations with C4 (r = - 0.380; p= 0.051).
| Baseline | After 3 months | After 6 months | ||||
|---|---|---|---|---|---|---|
| r | p-value | r | p-value | r | p-value | |
| UTP(gm/day) | 0.16 | 0.424 | 0.337 | 0.085 | 0.709 | <0.001* |
| Anti-dsDNA (U/ml) | 0.183 | 0.362 | 0.234 | 0.24 | 0.507 | 0.007ns |
| C3 g/l | -0.42 | 0.029 | -0.379 | 0.051 | -0.65 | <0.001* |
| C4 g/l | -0.324 | 0.099 | 0.199 | 0.32 | -0.38 | 0.051ns |
| Renal SLEDAI | 0.726 | <0.001 | 0.627 | <0.001 | 0.876 | <0.001* |
| SLEDAI | 0.635 | <0.001 | 0.51 | 0.007 | 0.864 | <0.001* |
Table 7: Correlation of Serum IL-2 receptor alpha with different parameter at baseline, after 3 month and 6 month of treatment (n
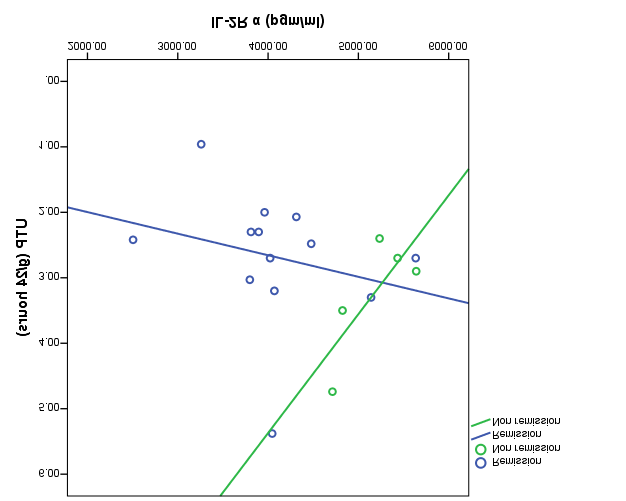
Table 7 shows serum soluble IL-2R alpha level and 24 hrs UTP at baseline (before treatment) and after treatment in remission and no remission group of proliferative lupus nephritis (class III and class IV). The difference of serum soluble IL-2R alpha level was significant between remission and non-remission group at baseline p value 0.008. In case of 24 hrs UTP the difference were not significant at base line but after 6 months of treatment the difference were significant in both group.
| Remission (n=13) | No-remission (n=5) | p-value | |
|---|---|---|---|
| IL-2R | |||
| Baseline | 4071.60 ± 769.91 | 5169.20 ± 394.76 | 0.008 |
| After 6 months | 925.98 ± 363.10 | 3220.18 ± 499.85 | <0.001 |
| p-value | <0.001 | 0.002 | |
| UTP (g/24 hours) | |||
| Baseline | 2.68 ± 1.01 | 3.25 ± 0.93 | 0.292 |
| After 6 months | 0.69 ± 0.48 | 3.71 ± 0.81 | <0.001 |
| p-value | <0.001 | 0.42 |
Table 8: Correlation of IL-2R with UTP at baseline in proliferative lupus nephritis patients. Paired t test was done to see the l
Table 8 shows, in remission group there is a positive correlation but in non-remission group there is negative correlation.
| Remission | No remission | ||
|---|---|---|---|
| r | p-value | r | p-value |
| 0.251 | 0.408 | -0.774 | 0.124 |
Table 9: Correlation between IL-2R and UTP in remission and no remission group of proliferative Lupus nephritis (class III & clas
According to Youden Index best cutoff value for IL-2R is 4595.4 mg/ml in prediction of remission in proliferative group. Sensitivity of this test to prediction of reemission was found to be 92.6 % and specificity was found to be 84.6 % (Figure 1).
Discussion
Systemic Lupus Erythematosus (SLE) is a chronic autoimmune disease which affects almost every system in the body with different degrees of severity [1]. Renal involvement in SLE is known as lupus nephritis, manifested by persistent proteinuria ≥0.5 gm/ 24 hours or active sediment in urine [presence of glomerular hematuria ≥5 RBC/hpf, with ≥2 acanthocytes/hpf and/ or ≥1 RBC cast, WBC cast (no infection), or both] (Ref. ACR -2012) (Tables 9 & 10).
| Histological Renal Pathology | |
|---|---|
| Class I | Minimal mesangial LN |
| Class II | Mesangial proliferative LN |
| Class III | Focal LN |
| III (A):III (A/C)III (C):Focal proliferative LNFocal proliferative and sclerosing LNFocal sclerosing LN | |
| Class IV | Diffuse LN |
| Diffuse segmental proliferative LNDiffuse global proliferative LNDiffuse segmental proliferative and sclerosing LNDiffuse global proliferative and sclerosing LNDiffuse segmental sclerosing LNDiffuse global sclerosing LN | |
| Class V | Membranous LN |
| Class VI | Advanced sclerosing LN |
Table 10: International Society of Nephrology and the Renal Pathology Society (ISN/RPS) 2004 Classification of Lupus Nephritis. Th
| Definition | Points | |
|---|---|---|
| Seizure | Recent onset. Exclude metabolic, infectious or drug causes. | 8 |
| Psychosis | Altered ability to function in normal activity due to severe disturbance in the perception of reality. Include hallucinations, incoherence, marked loose associations, impoverished thought content, marked illogical thinking, and bizarre, disorganized or catatonic behavior. Exclude uremia and drug causes. | 8 |
| Organic brain syndrome | Altered mental function with impaired orientation, memory or other intellectual function with rapid onset and fluctuating clinical features. Including clouding of consciousness with reduced capacity to focus and inability to sustain attention to environment plus at least 2 of the following: perceptual disturbance, incoherent speech, insomnia or daytime drowsiness, or increased or decreased psychomotor activity. Exclude metabolic, infectious or drug causes. | 8 |
| Visual disturbance | Retinal changes of SLE. Include cytoid bodies, retinal hemorrhages, serous exudate or hemorrhages in the choroid or optic neuritis. Exclude hypertension, infectious or drug causes. | 8 |
| Cranial nerve Disorder | New onset of sensory or motor neuropathy involving cranial nerves | 8 |
| Severe persistent headache; may be migrainous but must be nonresponsive to narcotic analgesia | 8 | |
| Vasculitis | Ulceration, gangrene, tender finger nodules, periungualinfarction, splinter hemorrhages, or biopsy or angiogram proof of vasculitis | 8 |
| Arthritis | More than 2 joints with pain and signs of inflammation (i.e., tenderness, swelling or effusion). | 4 |
| Myositis | Proximal muscle aching or weakness associated with elevated creatine phosphokinase or aldolase, or electromyogram changes, or a biopsy showing myositis | 4 |
| Urinary casts | Heme-granular or red blood cell casts. | 4 |
| Hematuria | >5 red blood cells per high power field. Exclude stone, infection or other causes | 4 |
| Proteinuria | >0.5 g per 24 hours. New onset or recent increase of more than 0.5 g per 24 hours. | 4 |
| Pyuria | >5 white blood cells per high power field. Exclude infection. | 4 |
| New rash | New onset or recurrence of inflammatory type rash. | 2 |
| Alopecia | New onset or recurrence of abnormal patchy or diffuse loss of hair. | 2 |
| Mucosal ulcers | New onset or recurrence of oral or nasal ulcerations | 2 |
| Pleurisy | Pleuritic chest pain with pleural rub or effusion or pleural thickening. | 2 |
| Pericarditis | Pericardial pain with at least 1 one of the following: rub, effusion or electrocardiogram confirmation. | 2 |
| Low complement | Decrease in CH50, C3 or C4 below the lower limit of normal for testing laboratory. | 2 |
| Increased DNA Binding | >25% binding by Farr assay or above normal range for testing laboratory. | 2 |
| Fever | >38°C. Exclude infectious cause. | 1 |
| Thrombocytopenia | Thrombocytopenia < 100,000 platelets per mm3. | 1 |
| Leukopenia | <3,000 white blood cells per mm3. Exclude drug causes | 1 |
Table 11: SELENA-SLEDAI.
Interpretation
Activity [12]
- Active disease: Patients with SLEDAI score ³6
- Inactive disease: Patient with SLEDAI score <6 Flare [13]
- Mild to Moderate flare: Change in SLEDAI >3-12
- Severe flare: Change in SLEDAI >12 points
Renal SLEDAI (rSLEDAI)
The score consists of the four kidney-related parameters: hematuria, pyuria, proteinuria, and urinary casts. Each parameter consists of 4 point. Scores for the renal SLEDAI can range from 0 (inactive renal disease) to a maximum of 16. Active lupus nephritis was those with an rSLEDAI score of 4 or more. Apart from current conventional biomarkers for lupus nephritis like urine sediments, proteinuria, anti- dsDNA antibodies and C3 or C4 are sometimes mislead for prediction of treatment response. Recently IL-2 R alpha has shown to be a good marker to predict treatment response of lupus nephritis. Serum sIL-2R alpha is a good marker of lupus nephritis for follow-up as it falls in patients with good response and stays raised or rises when there is poor response. In this study, the clinical implications of serum IL-2R alpha as disease activity and assessment of treatment response tool have been assessed [14, 15].
In this prospective observational study, a total of 27 patients with lupus nephritis were recruited. Most of the study subjects were females 24 (88.9%). Maximum were in the age group of 21-30 (44.4%) years. It was similar to other study [16, 17, 18]. This can be explain by lupus nephritis is more common in female. Renal biopsy was done in all patients. Among 27 lupus nephritis patients, the most common histopathological type was class IV (48.1%) followed by class V (33.3%) and class III (18.5%). Near similar findings were observed in a study done [19] where the most common histopathological type was class IV (50%), followed by class III (17.6%) and class V (9%) and where Proliferative glomerulonephritis (class III and IV) was detected in 31 (68.8%) patients and class II and class V LN was detected in seven (15.5%) patients each7. In both study number of class V lupus nephritis patient is less then class III probably due to two factors. Firstly, in both study all class of LN patients were include and secondly, combined class (III + V) and class (IV + V) lupus nephritis patient was more in both group.
In our study serum sIL-2R alpha levels were high in proliferative (Class III+IV) lupus nephritis at baseline then membranous lupus nephritis (Class - V). The concentration of serum sIL-2R alpha in proliferative lupus nephritis is higher than that in non-proliferative lupus nephritis. This agrees with studies conducted [7, 10, 20, 21, 22] and found the similar association too. Increased levels of IL-2Rα in biological fluids correlate with increased T & B cell activation. In our study serum sIL-2R alpha level was found to be significantly higher in both proliferative and non-proliferative lupus nephritis patient at baseline and after 6 month of treatment mean serum sIL-2R alpha level was decreased significantly in both group. Similar findings were observed in a study [10] where 19 patients from lupus nephritis group were assessing at presentation and 6 month after treatment. Serum soluble sIL-2R alpha levels were higher in patients with lupus nephritis before treatment and decreased significantly 6 months after treatment. Another study done by Gupta R [7] which recruited 45 patient and renal biopsy done all patients and similar result was observed.
The same difference was found for 24 hrs UTP, anti-dsDNA in both group but C3 and rSLEDAI decreased significantly in only proliferative group. No difference was found for C4 levels in both groups. Similar findings were observed in another study done by Davas [10]. Several published studies/ data have evaluated IL-2R levels in relation to other serologic tests in lupus nephritis. Decreased levels of C3 and C4, elevated anti-ds DNA and increased proteinuria correlated with elevated sIL-2R levels. The present study confirmed these findings, in which elevated soluble IL-2R alpha levels were found to strongly correlate with decreased levels of C3 and proteinuria. This finding correlated with study done by Davas [10]. From the above results it seems that the soluble receptors are as sensitive markers of disease activity as C3 and proteinuria. This study revealed that the difference of baseline serum sIL-2R levels at base line between remission group (complete and partial) and no remission group of proliferative lupus nephritis was statically significant but the difference of 24 hrs UTP was not statically significant. By measuring the baseline serum sIL-2R levels we can predict the treatment response before starting the treatment in case of proliferative which was not possible by measuring the 24 hrs UTP and the best cut-off value for IL-2R may be around 4595.4 mg/ml in prediction of remission in proliferative group with sensitivity 92.6 % and specificity 84.6 %. At the end of his study, it was shown that serum sIL-2R alpha level can detect proliferative and non-proliferative lupus nephritis and can predict treatment response with their base line value and their level significantly decrease after treatment in case of remission group which is comparable to the results in the study conducted by Davas [10] and Gupta [7].
Conclusion
This study permits to conclude that serum soluble IL- 2R alpha in patients with proliferative lupus nephritis (Class III & Class IV), is significantly higher than those with non- proliferative lupus nephritis and correlates significantly with disease activity. After 6 months of treatment serum soluble IL-2R alpha level was significantly decreased in remission group in compression to non-remission group. In case of proliferative lupus nephritis (Class III & Class IV) patient serum soluble IL-2R alpha level at baseline is significantly higher in non-remission group then remission group but 24 hrs UTP is not significant. Hence, serum soluble IL-2R alpha might be a valuable monitoring tool to detect disease severity and to predict and monitor treatment response of lupus nephritis.
Funding
No funding sources.
Conflict of Interests
None declared.
Ethical Approval
Approved by ethical review committee, BSMMU, Dhaka, Bangladesh.
Informed Consent
Taken from each patients enrolled.
Limitation of Study
It was a single center study with a relatively small sample size.
References
-
Gurevitz S, Snyder J, Wessel E, Frey J, Williamson B (2013) Systemic lupus erythematosus: a review of the disease and treatment options. The Consultant Pharmacist 28(2): 110-121.
-
Reyes-Thomas J, Blanco I, Putterman C (2011) Urinary biomarkers in lupus nephritis. Clinical reviews in allergy & immunology 40(3): 138-150.
-
Bomback AS, Appel GB (2010) Updates on the treatment of lupus nephritis. Journal of the American Society of Nephrology 21(12): 2028-2035.
-
Rovin BH, Zhang X (2009) Biomarkers for lupus nephritis: the quest continues. Clinical Journal of the American Society of Nephrology 4(11): 1858-1865.
-
Malvar A, Pirruccio P, Alberton V, Lococo B, Recalde C, et al. (2015) Histologic versus clinical remission in proliferative lupus nephritis. Nephrology Dialysis Transplantation 32(8): 1338-1344.
-
Bertsias GK, Tektonidou M, Amoura Z, Aringer M, Bajema I, et al. (2012) Joint European League Against Rheumatism and European Renal Association–European Dialysis and Transplant Association (EULAR/ERA- EDTA) recommendations for the management of adult and paediatric lupus nephritis. Annals of the rheumatic diseases 71(11): 1771-1782.
-
Gupta R, Yadav A, Misra R, Aggarwal A (2015) Urinary sCD25 as a biomarker of lupus nephritis disease activity. Lupus 24(3): 273-279.
-
Mok CC (2010) Biomarkers for lupus nephritis: a critical appraisal. BioMed Research International 2010: 638413.
-
Zeid MMH, Baddour NM, El-Neily DAEM, Elshair HS, Mamdouh M (2018) Study of urinary interferon gamma- induced protein 10 (IP-10) and urinary soluble CD 25 (sCD25) as markers of lupus nephritis and their relation to histological class. Alexandria journal of medicine 54(4): 647-653.
-
Davas EM, Tsirogianni A, Kappou I, Karamitsos D, Economidou I, et al. (1999) Serum IL-6, TNFα, p55 srTNFα, p75 srTNFα, srIL-2α levels and disease activity in systemic lupus erythematosus. Clinical rheumatology 18(1): 17-22.
-
Laut J, Senitzer D, Petrucci R, Sablay LB, Barland P, et al. (1992) Soluble interleukin-2 receptor levels in lupus nephritis. Clinical nephrology 38(4): 179-184.
-
Petri MA, Martin RS, Scheinberg MA, Furie RA (2017) Assessments of fatigue and disease activity in patients with systemic lupus erythematosus enrolled in the Phase 2 clinical trial with blisibimod. Lupus 26(1): 27-37.
-
Bombardier C, Gladman DD, Urowitz MB, Caron D, Chang CH (1992) Derivation of the SLEDAI. A disease activity index for lupus patients. The Committee on Prognosis Studies in SLE. Arthritis Rheum 35(6): 630-640.
-
Pitashny M, Schwartz N, Qing X, Hojaili B, Aranow C, et al. (2007) Urinary lipocalin‐2 is associated with renal disease activity in human lupus nephritis. Arthritis & Rheumatism 56(6): 1894-1903.
-
Mustafa AS (2014) Urinary Monocyte Chemoattractant Protein-1 (mcp-1) Level among Lupus Nephritis Patient and Its Correlation with Disease Activity Markers in Hospital University Sains Malaysia, Kelantan. Doctoral dissertation, University Sains Malaysia, Malaysia.
-
El-Shafey EM, Abdou SH, Shareef MM (2010) Is mycophenolatemofetil superior to pulse intravenous cyclophosphamide for induction therapy of proliferative lupus nephritis in Egyptian patients? Clinical and experimental nephrology 14(3): 214-221.
-
Gunes C, Keles M, Uyanik A, Cetinkaya R, Sari RA (2010) Treatment Results of Patients With Lupus Nephritis: A Single Center’s Experience. The Eurasian journal of medicine 42(3): 132-136.
-
Rabrenović V, Poskurica M, Kovačević Z, Nešić V, Savin M, et al. (2010) Treatment of lupus nephritis by mycophenolatemofetil. Kidney and Blood Pressure Research 33(4): 297-303.
-
Sharma M, Das HJ, Doley PK, Mahanta PJ (2019) Clinical and histopathological profile of lupus nephritis and response to treatment with cyclophosphamide: A single center study. Saudi Journal of Kidney Diseases and Transplantation 30(2): 501-507.
-
EL Shaffy EM, EL Nagar GF, EL Bendary AS, Sabry AA, Selim AGA (2008) Serum soluble interleukin-2 receptor alpha in systemic lupus erythematosus. Iran J Kidney Dis 2(2): 80-85.
-
Brugos B, Vincze Z, Sipka S, Szegedi G, Zeher M (2012) Serum and urinary cytokine levels of SLE patients. Pharmazie 67(5): 411-413.
-
Guleria A, Phatak S, Dubey D, Kumar S, Zanwar A, et al. (2018) NMR-Based Serum Metabolomics Reveals Reprogramming of Lipid Dysregulation Following Cyclophosphamide-Based Induction Therapy in Lupus Nephritis. Journal of proteome research 17(7): 2440- 2448.
- Results of 6-Month Follow-Up of Patients After B-Turp and Thulep
- The Effect of Drinking Water with a High Content of Antimony and Arsenic on the Dynamics of their Distribution in the Kidneys and the Renal Excretory Function in Rats
- Effectiveness and Safety of Tansurethral Thulium Laser Enucleation of the Prostate in the Treatment of BPH: Review
- A Systematic Review on Molecular Pathophysiology Involved in Chronic Kidney Disease and the Role of Animal Models in Drug Discovery to Manage in Chronic Kidney Disease - An Update
- Functional Development of Kidneys in Human Ontogenesis
- Testicular Metastasis: Uncommon Prostate Cancer Case Report