Trends of Tuberculosis Prevalence, Treatment and Prevention Efforts in Yenagoa, Bayelsa State
Background: Tuberculosis is still rampant in Nigeria, and contributes significantly to TB burden globally. This study was conducted with the main objective of determining the trends of TB prevalence, treatment and preventive efforts by the government of Bayelsa State, and providing insight into the level of progress in the fight against TB in the State. Methods: It is a retrospective study of TB programme data consisting of 10,512 patients who accessed healthcare services at the health facilities from 2017 to 2021. Enrolment registers, TB Treatment registers, Test Result Request Forms and Laboratory registers were consulted to obtain accurate data. Additionally, observation of the processes at the various health facilities and the review of TB programme documents, including periodic reports, training manuals, presentation slides and the Information, Education and Communication (IEC) materials were conducted to garner information about TB prevention and control efforts in the state. Results: This study finds that there is a consistent reduction in TB prevalence rates from 2017 (23.2%) to 2021 (17.6%). The average cumulative five-year prevalence for all TB cases is 22.4% and 2.8% for Drug-Resistant TB (DR-TB). The results further indicated that less females (9.3%) than males (13.8%) were infected with TB (p<0.05), while the age group 25-34 years recorded the highest TB prevalence. The study participants had a mean age of 31.67 ± 18.59 years. There is a strong evidence that difference in prevalence is statistically significant across sex/gender (X2 = 22.011, df = 4, p-value = 0.0002), age groups (F(7, 24) = 13.871, p = 0.0001), and years ((F(4, 24) = 80.925, p = 0.0001). TB Treatment initiation rate is optimal but declined by 1.7% in 2021. Conclusion: TB Prevalence in Yenagoa is high and intensified TB Case finding, contact tracing efforts are necessary to quickly curb transmission rate. Systematic screening and presumptive TB identification appears inadequate compared to the number of TB cases detected each year.
Introduction
Mycobacterium tuberculosis is the causative organism of Tuberculosis (TB), which is currently regarded as one of the world’s most serious public health issues. It most commonly affects the lungs, and this is called Pulmonary Tuberculosis (PTB). Similarly, it can also infect other parts of the body like the kidneys, spine, bone, brain and the meninges; this is referred to as Extra-pulmonary Tuberculosis (EPTB) [1]. Not everyone who has tuberculosis infection gets sick, and this is what is referred to as Latent TB Infection (LTBI). LTBI can become active TB disease once the immune system gets weakened by any of the various factors [1]. Nonetheless, Tuberculosis can be treated and avoided [2, 3]. Although a quarter of the world’s population has latent tuberculosis, only a tiny percentage of this will develop active tuberculosis disease but the risk of having TB is substantially higher in people with immune suppression or compromised immune systems [3].
Furthermore, 4.1 percent of new TB cases and 19 percent of previously treated cases, has multiple drug resistant tuberculosis (MDR-TB) with an estimated 240,000 fatalities attributable to MDR-TB per year [4]. The human immunodeficiency virus (HIV) damages CD4 cells, lowering HIV-positive person’s resistance to tuberculosis infection, and increasing their chances of contracting TB by 16 to 27 times higher than HIV-negative individuals [5]. The World Health Organization estimates that 4.5 million people worldwide are HIV and tuberculosis co-infected [2, 3, 5].
High Prevalence of drug-resistant TB and its co-infection with HIV/AIDS epidemic has continued to increase the burden of TB in Nigeria [6]. Each year, an estimated four hundred and seven thousand (407,000) Nigerians contract tuberculosis [6]. The preparation of the National Strategic Plan for Tuberculosis Control, which sort to offer Universal Access to Prevention, Diagnosis, and Treatment by 2020 by the National Tuberculosis and Leprosy Control Program (NTBLCP) is a laudable effort in the fight against TB [7]. The low case detection rate for both adults and children with TB is a significant problem for Nigeria’s TB program. In 2017, only 25.8% of the estimated 407,000 all TB cases and 34.8% of the estimated 5,200 Drug Resistant TB (DR-TB) cases were reported, leaving a substantial number of TB cases either undetected or detected but not reported [8]. “Active Case- Finding” (ACF) is a proven strategy for closing these gaps. According to the 2020 NTBLCP annual report, active house- to-house TB case searching, identified over eleven thousand five hundred (11,500) TB cases in 2017 [9]. In this study, TB prevention efforts refer to all actions geared towards halting or slowing down TB transmission rate, increasing knowledge about TB, reducing risk of contracting TB both at the health facility and the community levels, and ultimately reducing the burden of the disease. TB related strategic technical meetings, supply of TB infection prevention and control (IPC) commodities, outreaches, health education, case search and case identification, constitute parts of this effort. We reviewed relevant TB programme documents to uncover the common TB preventive efforts demonstrated in Bayelsa State.
Bayelsa is a Niger Delta oil-rich state with Yenagoa as its capital city but the state continues to be afflicted by poverty and pollution caused by oil spills. Although Yenagoa is largely accessible by boat, it is bordered by marshes, mangroves, and tropical rain forests. Residents may be predisposed to a variety of health risks and diseases, including diabetes and tuberculosis, due to these factors. By GeneXpert alone, the prevalence of tuberculosis in the state was reported to be 49% in a recent study [10]. Similarly, diabetes is a socioeconomic and public health challenge in Bayelsa State, at a prevalence of 8.4% and pre-diabetes at 3.7% [11]. There is almost no study on the trends of TB prevalence, treatment and prevention efforts in Yenagoa LGA. This study is set to address this gap for researchers, guideline creators, and policymakers.
Materials and Methods
The Study Location
Bayelsa State is situated between Latitudes 40 151 North and 50231 South. Additionally, it lies between longitudes 50 221 West and 60 451 East. The size of Yenagoa LGA is 742 square kilometers (sq.km), with a population of 524,400 people. 75% of Bayelsa State is riverine with only Yenagoa and other 3 LGA Headquarters accessible by land transportation as against the common water transport [12]. Yenagoa LGA is the capital of Bayelsa State and it is home for most of the primary, secondary and tertiary health facilities in the state. As a result, many people travel from other LGAs for clinic attendance in Yenagoa.
Study Design and Setting
This research is a retrospective cohort study of TB programme data from 2017 to 2021, to evaluate the trends of tuberculosis prevalence, treatment and prevention efforts in Yenagoa, Bayelsa State, Nigeria. Observation of activities at the various health facilities and the desk review of TB programme documents, including but not limited to periodic reports (monthly, quarterly & annual reports) and IEC materials were conducted to garner information about the TB prevention and control efforts in the state. Data collection was done in all Directly Observed Treatment, Short-Course (DOTS) clinics including that of Niger Delta Teaching Hospital (NDUTH), Federal Medical Centre (FMC), and the Tuberculosis and Leprosy (TBL) Referral Hospital.
Study Population (Participants)
The study population is made up of 10,512 individuals who were screened and documented as presumptive for TB from 2017 to 2021, at all the TB DOTS Centers in Yenagoa.
Inclusion & Exclusion Criteria
The inclusion criteria for this study were patients having complete records of their sex, age, test results, TB treatment regimen and the start date of their therapy. Patients with incomplete demographic data and indeterminate test results were excluded.
Sample Size and Sampling Technique
All 10,512 presumptive TB cases documented in the registers across all DOTS centers were enrolled in the study. Enrolment Registers, TB Central Registers, Treatment Cards, Laboratory registers, and Result Request forms were also triangulated with pharmacy records to validate diagnosis and treatment records. Both pulmonary and extra-pulmonary TB cases, diagnosed either bacteriologically (GeneXpert and AFB) or clinically (X-ray examinations), were taken into the study.
Data Collection Technique
The study retrospectively gathered data from all DOTS clinics in Yenagoa LGA for the years 2017 to 2021, encompassing a total of 10,512 presumptive TB cases. Data collection utilized a standardized Microsoft Excel template. Categorical variable proportions were assessed using descriptive analysis, Fisher’s exact test, ANOVA, and Chi- square test when suitable, applying SPSS version 21 and “R” for statistical analysis, with a significance level of 5%.
Results
A total of 10,512 records of individuals who accessed healthcare services at all the DOTS centers in Yenagoa from 2017 to 2021 were taken into this study. The study participants had a mean age of 31.67 ± 18.59 years and were categorized based on sex, 4,818 (45.8%) male and 5,694 (54.2%) female subjects. The results are presented in Tables 1-5 and Figure 1 below.
| Year | 2017 | 2018 | 2019 | 2020 | 2021 | Total | |
|---|---|---|---|---|---|---|---|
| TB Prevalence (%) | MTB Detected (DS- TB + DR-TB) | 401 (23.2%) | 537 (31.0%) | 335 (22.0%) | 473 (22.8%) | 605 (17.6%) | 2,351 (22.4%) |
| DR-TB Detected* | 13 (3.2%) | 11 (2.0%) | 11 (3.3%) | 17 (3.6%) | 10 (1.7%) | 62 (2.8%) | |
| MTB NOT Detected | 1,331 (76.8%) | 1,195 (69.0%) | 1,190 (78.0%) | 1,603 (77.2%) | 2,844 (82.5%) | 8,163 (77.6%) | |
| Total | 1,732 (100.0%) | 1,732 (100.0%) | 1,525 (100.0%) | 2,076 (100.0%) | 3,447 (100.0%) | 10,512 (100.0%) |
Table 1: Trend of Tuberculosis Prevalence in Yenagoa LGA, 2017 - 2021.
(F(4, 24) = 80.925, p = 0.0001). *This data is a subset of the MTB Detected Table 1: Trend of Tuberculosis Prevalence in Yenagoa LGA, 2017 - 2021.
The data indicates that the prevalence of MTB Detected cases decreased over the years, from 23.2% in 2017 and 31.0% in 2018 to 17.6% in 2021. DR-TB cases account for a small proportion of the overall TB cases, ranging from 1.7% to 3.2% of the total notified cases during the study period. The difference in prevalence across the years indicates a strong evidence of statistical significance (p<0.05).
| Year | 2017 | 2018 | 2019 | 2020 | 2021 | Total | |
|---|---|---|---|---|---|---|---|
| TB Prevalence by Gender | Male | 247 (14.3%) | 323 (18.6%) | 188 (12.3%) | 260 (12.5%) | 359 (10.4%) | 1,377 (13.1%) |
| Female | 154 (8.9%) | 214 (12.4%) | 147 (9.6%) | 213 (10.3%) | 246 (7.1%) | 974 (9.3%) | |
| Total | 401 (23.2%) | 537 (31.0%) | 335 (22.0%) | 473 (22.8) | 605 (17.6%) | 2,351 (22.4%) |
Table 2: Sex Disaggregation of the Trend of TB Prevalence in Yenagoa, 2017 to 2021.
X2 = 22.011, df = 4, p-value = 0.0002. Table 2: Sex Disaggregation of the Trend of TB Prevalence in Yenagoa, 2017 to 2021.
The data shows the distribution of TB cases by gender over the years, indicating a higher prevalence among males compared to females for each year. The overall percentage of TB cases among males (13.1%) is higher than among females (9.3%), suggesting that males may be more affected by TB in this population during the study period. Pearson’s Chi- squared test indicates that there is a statistically significant difference in TB prevalence between males and females (p<0.05).
| Year | Sex (M - Male, F - Female) | Age Group in Years | Total | ||||||||
|---|---|---|---|---|---|---|---|---|---|---|---|
| M | F | 0-4 | 14-May | 15–24 | 25–34 | 35–44 | 45–54 | 55–64 | > 65 | ||
| 2017 | 247 (14.3%) | 154 (8.9%) | 11 (0.6%) | 26 (1.5%) | 65 (3.8%) | 122 (7.0%) | 97 (5.6%) | 44 (2.5%) | 25 (1.4%) | 11 (0.6%) | 401 (23.2%) |
| 2018 | 323 (18.6%) | 214 (12.4%) | 21 (1.2%) | 32 (1.8%) | 90 (5.2%) | 151 (9.7%) | 114 (6.6%) | 64 (3.7%) | 44 (2.5%) | 21 (1.2%) | 537 (31.0%) |
| 2019 | 188 (12.3%) | 147 (9.6%) | 5 (0.3%) | 26 (1.7%) | 42 (2.8%) | 92 (6.0%) | 71 (4.7%) | 47 (3.1%) | 25 (1.6%) | 27 (1.8%) | 335 (22.0) |
| 2020 | 260 (12.5%) | 213 (10.3%) | 17 (0.8%) | 22 (1.1%) | 97 (4.7%) | 110 (5.3%) | 99 (4.8%) | 67 (3.2%) | 36 (1.7%) | 25 (1.2%) | 473 (22.8%) |
| 2021 | 359 (10.4%) | 246 (7.1%) | 20 (0.6%) | 26 (0.8%) | 112 (3.2%) | 165 (4.8%) | 129 (3.7%) | 68 (2.0%) | 45 (1.3%) | 40 (1.2%) | 605 (17.6%) |
| Total | 1,377 (13.1%) | 974 (9.3%) | 74 (0.7%) | 132 (1.3%) | 406 (3.9%) | 640 (6.1%) | 510 (4.9%) | 290 (2.8%) | 175 (1.7%) | 124 (1.2%) | 2,351 (22.4%) |
Table 3: Sex and Age Group Distribution of TB Cases in Yenagoa, 2017-2021.
(F(7, 24) = 13.871, p = 0.0001). Table 3: Sex and Age Group Distribution of TB Cases in Yenagoa, 2017-2021.
The data indicates that TB cases were reported for both males and females in all age groups. The highest prevalence of TB cases was observed in the 25-34 age group in each year, followed by the 45-54 age group. The overall prevalence of TB cases varied from year to year, with the highest prevalence in 2018 (31.0%) and the lowest in 2021 (17.6%). The difference in prevalence across the age groups indicates a strong evidence of statistical significance (p<0.0001).
| 2017 | 2018 | 2019 | 2020 | 2021 | |
|---|---|---|---|---|---|
| TB Cases Diagnosed | 401 | 537 | 335 | 473 | 605 |
| Patients on TB Treatment | 401 | 537 | 335 | 472 | 595 |
| Treatment Initiation Rate (%) | 100 | 100 | 100 | 99.8 | 98.3 |
Table 4: TB Treatment Initiation Rates in Yenagoa, 2017 – 2021.
The data suggests that all diagnosed TB cases were put on treatment immediately in 2017 and 2018, with a treatment initiation rate of 100%. In the subsequent years (2019, 2020, and 2021), the treatment initiation rate remained very high, with a rate of 100% in 2019 and 99.8% in 2020. In 2021, the treatment initiation rate decreased slightly to 98.3%, indicating a small delay in treatment initiation for 1.7% of diagnosed cases.
The TB cascade data in Table 5, suggests that the healthcare system responded effectively to presumptive TB cases by testing all individuals suspected of having TB. The number of MTB detected cases (both DS-TB and DR-TB) increased over the years, reaching a peak of 605 in 2021, indicating an increase in the detection and notification of TB cases during the period under study. The number of DR-TB cases remained relatively low throughout the years, ranging from 10 to 17 cases annually. The majority of TB cases diagnosed were DS-TB cases, with numbers ranging from 388 to 595 cases annually. The data shows that all detected TB cases were promptly commenced on treatment, which is crucial for effective TB management and control.
| Year | TB Presumptive | Examined for Diagnosis | MTB Detected | Commenced on Treatment | ||
|---|---|---|---|---|---|---|
| DS-TB Cases | DR-TB Cases | DS-TB + DR-TB Cases | ||||
| 2017 | 1732 | 1727 | 388 | 13 | 401 | 401 |
| 2018 | 1732 | 1295 | 526 | 11 | 537 | 537 |
| 2019 | 1525 | 1525 | 324 | 11 | 335 | 335 |
| 2020 | 2076 | 2068 | 456 | 17 | 473 | 472 |
| 2021 | 3447 | 3447 | 595 | 10 | 605 | 595 |
| Total | 10,512 | 10,062 | 2,289 | 62 | 2,351 | 2,204 |
Table 5: The Overview of TB Cascade Data in Yenagoa, 2017 – 2021.
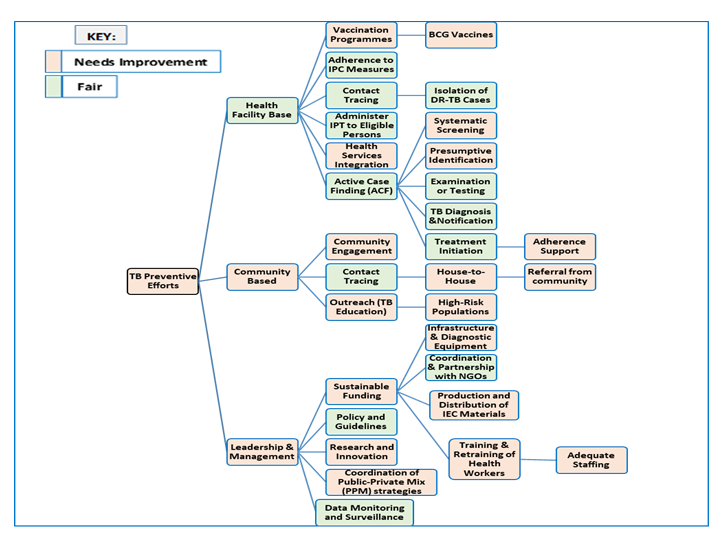
In this study, TB Prevention efforts are categorized into three broad domains: the Health Facility, the Community and the Leadership & Management domains. Under each domains are some expected TB preventive activities, as shown in the flowchart above. While the light green colour boxes indicate a fair TB preventive effort for the associated activities, the pink colour boxes mean that improvement is required for that activity or domain. From Figure 1, TB prevention efforts in Yenagoa needs improvement generally. Although there is a fair record of TB prevention efforts at the Health facility level, ‘vaccination programmes’, ‘integration of TB services with other health services’, ‘systematic TB screening’, ‘presumptive TB identification’ and ‘adherence supports’ need to be improved on. It is noteworthy that, the marker, ‘Need Improvement’ does not connote absence of commendable efforts, but it simply points to the fact that there are weaknesses in the process which demands attention and strengthening. For instance, ‘Outreach (TB Education)’ under the ‘Community Based’ domain, needs improvement because, though there are TB outreaches and community awareness campaigns yearly, the frequency, spread and output of such outreaches are generally low. Similarly, under the Leadership & Management domain, ‘Research and Innovation’ activities need improvement; in order to adequately guide policy makers on TB preventive strategies to be deploy from time to time for maximum results. The effects of poor funding of the TB programme can be seen in limited availability of infrastructural and diagnostic equipment, training and retraining of health workers, production and distribution of IEC materials and even the coordination and implementation of Public-Private Mix (PPM) hub &spokes strategy.
Discussion
This study reports a five-year prevalence of tuberculosis in Yenagoa, Bayelsa State, with an average of 22.4% for all TB cases and 2.8% for DR-TB cases Table 1. The former is higher than the prevalence of 19.3% found in a similar study involving 456 patients at the Federal Medical Center (FMC) Yenagoa Etim NG, et al. [13], as well as the 10.3% prevalence reported by Azuonwu, et al. [14] in another investigation of rifampicin resistance strains among patients accessing healthcare services at FMC Yenagoa, Bayelsa State. However, the observed prevalence is lower than the 22.9% reported in a study conducted at the TB Referral Hospital, Yenagoa Ikuabe PO, et al. [15]. Furthermore, the prevalence rate obtained in this study is higher than the 12% prevalence in Enugu State Wali YS, et al. [16] and the 11% prevalence in Eastern Amhara, Ethiopia [17].
This study demonstrates a statistically significant decreasing trend of TB prevalence in Yenagoa, from 23.2% in 2017 to 17.6% in 2021. These findings are consistent with the report by the World Health Organization [18], which indicates a global decrease in TB incidence at an approximate rate of 2% per year, amounting to an overall reduction of 11% between 2015 and 2020. Notably, the year 2018 recorded the highest TB prevalence of 31%. This observation may be attributed to potential shortcomings in TB clinical screening practices across health facilities. The selective identification of TB presumptive cases, focusing on clients with classical TB signs and symptoms or a high certainty of TB infection, could contribute to an increase in the number of diagnosed TB cases among the identified few presumptive TB cases [19].
The results indicate that the End TB Strategy milestone of a 20% reduction between 2015 and 2020 was more than halfway achieved in Yenagoa. However, there are concerns regarding the ability of Bayelsa State to attain the End TB strategy’s goals, which aim to reduce TB incidence by 80%, TB-related mortalities by 90%, and abolish the financial burden for TB-affected households by 2030.
Socioeconomic variables, such as sex, age, income, education, quality of place of residence, and final consumption expenditure (FCE), are associated with TB prevalence [20]. In this study, TB prevalence was significantly higher in males (13.1%) compared to females (9.3%) Table 2. This disparity might be linked to reduced clinic visits and medical check- ups among men, as well as increased social engagements among Bayelsan men compared to women. Regular clinic visits and optimized personal health behaviors are essential for early detection and control of TB. As breadwinners in African culture and society, men are more socially engaged, while women often stay at home to care for the family.
Regarding age groups, TB prevalence was statistically significant (p < 0.05) across different age groups Table 3. The highest TB prevalence was observed in the 25-34 age group each year, followed by the 45-54 age group. These findings differ from studies by Singh, et al. [21] and Li, et al. [22], which reported higher TB prevalence in the elderly compared to middle-aged individuals. Co-morbidities were found to increase with age among research participants, aligning with the work of Bates, et al. [23, 24], which suggested that older individuals are more susceptible to co-morbid health conditions, potentially increasing TB vulnerability. On the other hand, higher TB prevalence among the youthful population might be due to increased social engagements, fear of stigmatization, and reluctance to adhere to infection prevention and control practices, driven by youthful exuberance.
In Yenagoa, the treatment initiation rate among TB patients on free anti-TB drugs was generally optimal (Table 4), declining slightly from 100% to 99.8% in 2020 and 98.3% in 2021, likely influenced by the impact of the COVID-19 pandemic at that time. However, these rates remain higher than those reported for Nigeria by Oga-Omenka C, et al. [25] and the Niger Delta Region by Alphonsus, et al. [26]. Prompt initiation of TB treatment is critical in reducing TB transmission and enhancing TB control. Delay in treatment commencement can lead to increased lost-to-follow-up (LTFU) cases, contributing to TB transmission and higher TB incidence. The TB cascade shown in Table 5 reflects commendable efforts in TB case detection, examination for diagnosis and treatment initiation in Yenagoa. However, TB Prevention efforts generally need improvements (Figure 1). The integration and uptake of TB preventive services, such as systematic TB screening offered to all clinic attendees in the study area, should be strengthened. Effective systematic TB screening directly improves presumptive TB identification strides. Relying solely on screening symptomatic clinic attendees may lead to missed TB cases, acting as a reservoir for TB transmission. Community engagement and community participation through referrals can considerably enhance TB prevention and control efforts. As highlighted by Cattamanchi, et al. [27], enhancing coordination between hospitals and service administration is crucial for delivering and upholding TB services effectively at health facilities.
Conclusion
Findings from this study, shows a trend of consistent reduction in TB prevalence rate from 2017 (23.2%) to 2021 (17.6%). With a cumulative average TB prevalence of 22.4%. It confirms that TB is still a serious public health issue in Nigeria and specifically in Bayelsa State. The younger population within the age groups of 25-34 and 45-54 had the highest TB prevalence rates each year. This can have some implications on the transmission rate and even livelihood of families, just as TB prevalence rate was also higher in male than the female gender, despite recording more female participants than the male. This study shows a trend of increasing number of TB presumptive and diagnosed TB cases from 2017 to 2021. Therefore, identification of more TB presumptive presents a higher chance of detecting more TB cases. The TB cascade data suggests that there is a good effort and effective TB Control system in Yenagoa, but systematic TB screening and presumptive identification need to be improved. TB prevention efforts, treatment initiation for newly identified TB cases should be intensified, despite the progress made so far.
Acknowledgement
This authors are grateful to the research assistants, the laboratory scientists and the Bayelsa State TB Programme Manager and the Management of the Hospitals involved in this research.
Contributors
The lead author (Aghedo, O.G.) conceive, designed, implemented the project, collected the data, analyzed the data and drafted the manuscript. The second author and former Deputy Vice-Chancellor, Academic, NOUN, (Prof. Okoronkwo M. O.) supervised the project and reviewed the manuscript. The final manuscript has been reviewed and approved by both authors.
Funding
The research was solely funded by the lead author (Aghedo O.G.). No external individuals or corporate organizations was responsible or contributed to the funding of the research.
Competing Interests
The authors do not have any conflict of interest in this research.
Ethics Approval
The Health Research and Ethics Committee of Bayelsa State Ministry of Health (SMoH), Yenagoa issued the Ethical Clearance (Authorization or Reference Number: BSHREC/ Vol.1/22/05/02). Management of the various hospital also granted verbal permission on siting the ethical clearance letter. An Informed Consent was not applicable since we did not need to contact any patients, and no personal identifying information was collected. The researcher fully demonstrated the principle of non-maleficence.
Data Availability Statement
All relevant data in this study have been analyzed and reported in the article but not uploaded as online supplemental information. Though the data are available publicly at https://ntblcp.org.ng/data-centre/, permission may be required to assess the raw state level data. We do not have the permission to share the data beyond this article publication.
Supplemental Material
Not applicable
References
-
World Health Organization (2020) Global Tuberculosis Report 2020.
-
Centers for Disease Control and Prevention CDC (2016) Basic TB facts.
-
World Health Organization (2017) Global Tuberculosis Report.
-
World Health Organization (2019) Global TB Report 2019.
-
Alvarez-Uria G, Azcona JM, Midde M, Naik PK, Reddy S, et al. (2012) Rapid diagnosis of pulmonary and extra pulmonary tuberculosis in HIV-infected patients. Comparison of LED fluorescent microscopy and the GeneXpert MTB/RIF Assay in a district hospital in India. Tuberc Res Treat 2012: 932862.
-
Kannabus A (2022) Information about Tuberculosis. TB facts.org.
-
World Health Organization (2021) Nigeria records gain in fight against tuberculosis amidst coronavirus pandemic.
-
Kannabus A (2022) Drug resistant TB - different types & latest statistics.
-
National Tuberculosis and Leprosy Control Programme NTBLCP (2019). NTBLCP Annual TB Report. pp: 2-42.
-
Enoch A, Silas G, Pius M, Nwozuke A (2021) Cross- Sectional Study of Tuberculosis and HIV/AIDS Co- Infections among Patients Attending Directly Observed Treatment Centers in Bayelsa State, Nigeria. J Tuberc Res 9: 131-145.
-
Kasia BE, Oyeyemi AS, Opubiri I, Azonobi RI (2020) Prevalence and Risk Factors of Diabetes Mellitus and Pre-diabetes in Rural Communities in Bayelsa State, Niger Delta Region of Nigeria. Niger Delta Medical Jounal.
-
Bayelsa State Ministry of Health (2010) Bayelsa State Strategic Health Development Plan (2010-2015).
-
Etim NG, Briyai FO (2017) Prevalence of Pulmonary and Rifampicin-resistant Tuberculosis Among Patients Attending Federal Medical Centre, Yenagoa, Bayelsa State, Nigeria. Int J Healthc Med Sci 3(11): 85-92.
-
Azuonwu O, Ihua N, Kpomasiruchi W (2017) Molecular Detection of Mycobacterium tuberculosis (MTB) and Rifampicin Resistant Strain among Subjects Accessing Health Care at Federal Medical Centre, Yenegoa, Bayelsa State; Nigeria. Transl Biomed 8(3): 120.
-
Ikuabe PO, Ebuenyi ID (2018) Prevalence of rifampicin resistance by automated GeneXpert rifampicin assay in patients with pulmonary tuberculosis in Yenagoa, Nigeria. Pan Afr Med J 29: 204.
-
Wali YS, Effiong EC, Agujiobi IM (2019) Assessment of tuberculosis prevalence in Enugu State – A 5-year case study (2014 – 2018). Discovery 55(285): 490-495.
-
Wasihun AG, Hailu GG, Dejene TA (2021) Prevalence of Mycobacterium tuberculosis (Rifampicin-Resistant MTB) and Associated Risk Factors among Pulmonary Presumptive TB Patients in Eastern Amhara, Ethiopia: 2015-2019. Infect Dis Ther 10(3): 1299-1308.
-
World Health Organization (2022) Tuberculosis.
-
Brett K, Dulong C, Severn M (2020) Identification of Tuberculosis: A Review of the Guidelines. Ottawa (ON): Canadian Agency for Drugs and Technologies in Health.
-
Onyechege DC, Mohamed Nor N, Ngah WAS, Naseem NAM (2022) Tuberculosis and its socioeconomic determinants in Nigeria: An empirical investigation using ARDL approach. Eur J Public Health 7(1): em0126.
-
Singh SK, Kashyap GC, Puri P (2018) Potential effect of household environment on prevalence of tuberculosis in India: evidence from the recent round of a cross- sectional survey. BMC Pulm Med 18: 66.
-
Li SJ, Li YF, Song WM, Zhang QY, Liu SQ, et al. (2021) Population aging and trends of pulmonary tuberculosis incidence in the elderly. BMC Infect Dis 21: 302.
-
Aghedo OG (2023) A Cross-Sectional Observational Study Probing Post COVID-19 Pandemic Prevalence of Tuberculosis in Bayelsa State: Yenagoa LGA as a Case Study. Int J Sci Res 12(7): 1588-1595.
-
Bates M, Marais BJ, Zumla A (2015) Tuberculosis Comorbidity with Communicable and Non- communicable Diseases. Cold Spring Harb Perspect Med 5(11): a017889.
-
Oga-Omenka C, Zarowsky C, Agbaje A, Kuye J, Menzies D (2019) Rates and timeliness of treatment initiation among drug-resistant tuberculosis patients in Nigeria- A retrospective cohort study. PLoS One 14(4): e0215542.
-
Alphonsus C, Chukwu JN, Pande T, Nwafor CC, Meka AO, et al. (2020) Investigating Barriers and Challenges to Tuberculosis Service Delivery in Hard-to-Reach Riverine Areas: A Mixed-Methods Study in the Niger Delta Region of Nigeria. Research Square.
-
Cattamanchi A, Miller CR, Tapley A, Haguma P, Ochom E, et al. (2015) Health worker perspectives on barriers to delivery of routine tuberculosis diagnostic evaluation services in Uganda: a qualitative study to guide clinic- based interventions. BMC Health Serv Res 15: 10.
- Intersecting Epidemics and Climate Vulnerabilities in Conflict- Driven Displacement: Epidemiology, Systemic Challenges, and One Health Gaps in South Sudan
- Advancing Domestic Health Financing for Community Health System Sustainability in South Sudan: The Boma Health Initiative Model (2025–2035)
- Prevalence and Correlates of Post-Exposure Prophylaxis Uptake among Men Who Have Sex with Men in Kisumu County, Kenya
- Medical, Ethical, and Legal Conflicts Surrounding Euthanasia in Argentina. Its Global Implications
- Knowledge and Attitude on Menstrual Hygiene among Adolescent Girls Studying in Secondary Level in Public Schools of Chitwan District, Nepal
- Biological Efficacy of an Adulticide Mixture (clothianidin + deltamethrin) as an Indoor Residual Spray against Adult Anopheles flavirostris in Palawan, the Philippines