Seroepidemiology of Asymptomatic Plasmodium falciparum Co- Infections with Hepatitis B And C Virus among Blood Donors in Modakeke Area Office, Ile Ife, Osun State, Nigeria
Despite the remarkable achievements in the reduction of malaria mortality, the disease had remained the most common cause of morbidity and mortality. Infection with hepatitis B virus (HBV) and hepatitis C virus (HCV) might associate with increased mortality rate as the infections may predisposes to the development of serious liver diseases such as liver cirrhosis, liver failure and hepatocellular carcinoma (HCC). The aim of the present study was to determine the Asymptomatic Plasmodium falciparum co-infections with hepatitis B and C viruses among blood donors in Modakeke Area Office, Ile Ife, Osun State, Nigeria. The study was conducted in Modakeke Area Office, Ile Ife, Osun State. The study was conducted in Modakeke health facility, Ile Ife, Osun State. Five (5) ml of venous blood was obtained from each of 400 blood donors into plain bottles and labeled accordingly. Thick and thin films of the donor’s blood samples were made on slides dried for five minutes at 37°C then stained using Giemsa stain. The slides were then examined microscopically for presence and densities of malaria parasites. Species identification and determination of the Hematological parameters were also conducted on the slides. Sera were separated from the remaining aliquots of the blood and screened for hepatitis-B and C surface antigens (HBsAg and anti-HCV). The overall mean parasitaemia of malarious blood donors was 786.20μl/blood while that of blood donors with hepatitis virus infection was 53 representing 13.3% of the total donor examined. Donors infected with HBV, HCV and co-infection of HBV and HCV had viraemia of 25 (6.3%), 21 (5.3%) and 7(1.8%) respectively. Among the age groups, high prevalence of Hepatitis viral infection rate of 57.9% was recorded among aged group 18-26 years. The infection rate of 15.8%, 13.6% and 10.5% of HBV, HCV was recorded from age group 18-26years respectively. The highest co-infection rate of HBV and HCV of 18.8% was recorded from age group 54-62years, while high mean malaria parasitaemia of 1,882.78 (μl of blood) was also recorded among donors aged 18-26 years. High hepatitis viral infection rate of 22.2% with 16.7% of HCV were recorded among females, while 6.3% of HBV and 1.9% of co-infection was observed among males and the mean malaria parasitaemia of 2,382.80 μl of blood was observed among females. High prevalence of Hepatitis infection rate of 17.1%, 8.6% of HCV, (6.3%) of HBV and 2.3% of co-infection were recorded among single donors. The mean malaria parasitaemia of 786.89 (μl of blood) was observed among married donors, there was significant difference between marital status and hepatitis infection (p= 0.0043) and between HCV (p=0.009). High prevalence of hepatitis viraemia of 21.4% and co-infection 5.6% was recorded among artisans, while 14.6% HBV infection rate was recorded among civil servants and 14.3% of HCV was recorded among donors who are farmers. The mean malaria parasitaemia of 1,150.15 μl/blood was recorded among donors who are traders. Donors that have acquired primary education have high prevalence of hepatitis infection rate of 38.5%, with 15.4% of HBV and (23.1%) co-infection (HBVand HCV). HCV (6.7%) was high among donors with secondary education; high mean malaria parasitaemia of 2,096.84 μl of blood was recorded among donors with primary education. Blood B+ve had high hepatitis viral infection rate of 21.7%, HCV 13.0% and co-infection of 5.8% while 7.8% of HBV was recorded among O+ve donors. The mean malaria parasitaemia of 1,378.50 (μl of blood) was recorded among B-ve donors. The total mean PCV in the study was 42.63, White blood cell count was 5,281.25, lymphocytes count was 42.88, eosinophils was 1.53 and neutrophil count was 55.72. The total percentage of elevated AST was 5.0%, ALT was 6.0% and ALB was 10.5%. There was significant difference between malaria and ALT (p=0.000) also, there was significant difference between HCV and ALB (p=0.000). There was significant difference between HBV and AST (p=0.001), ALT (p=0.028) and ALB (p=0.028).The hepatitis viral infection had significant difference with ALB (p=0.000). The logistic regression shows that there was an association between hepatitis viral infection and aged group 27-35years (p=0.022), female (p=0.006), trading (p=0.001), tertiary (p=0.003) A+ve (p=0.018) and B+ve (p=0.001). In conclusion, Although, the prevalence of malaria was low, while that of hepatitis viral infection was high in the local government area, critical screening of blood donors is of prime importance because they serve as an asymptomatic reservoirs and a potential source of transmission of these infections. The strengthening of creating awareness on the general public regarding Malaria, HBV and HCV transmission and prevention should be embarked on.
Introduction
Despite remarkable achievements in reducing malaria mortality, malaria remains the most common cause of morbidity and mortality in Africa. Coendemic falciparum malaria and acute hepatitis B occur through much of Southeast Asia, Africa, and the tropical Americas. Both diseases represent key threats to public health [1]. The majority of people with malaria are not admitted to the hospital. Instead, they receive oral therapy on an outpatient basis. People who develop severe malaria and enter the hospital represent a minority of patients [2].
In Nigeria, malaria has a high morbidity and mortality rate in children and pregnant women. (In non-immune subjects, infection with a Plasmodium falciparum at any age leads to clinical diseases associated with a high case fatality rate if untreated [3]. Infection with hepatitis B virus (HBV) and hepatitis C virus (HCV) are major global health problems [4]. It is estimated that about 350 million people are chronically infected with HBV and about 200 million people are infected with HCV worldwide [5]. Moreover, infection with these viruses might associate with increased mortality rate as the infection may predispose to the development of serious liver diseases such as liver cirrhosis, liver failure and hepatocellular carcinoma (HCC) [6].
Most regions highly endemic for malaria are also endemic for other infectious diseases, which may affect the malaria infection [7]. Hepatitis B virus (HBV) infections are common in many of the malaria endemic areas. HBV induces a robust pro-inflammatory Type 1 immune response (Th1), which is important for Plasmodium clearance, but is also implicated in disease severity [8]. Therefore, the study was conducted to determine the asymptomatic plasmodium falciparum co_-_ infections with hepatitis b and c virus among blood donors in Ife Central Local Government Area, Ile Ife, Nigeria.
Materials and Methods
Ethical Consideration
Prior to the commencement of the study, the research protocol was submitted and approved by the Ministry of Health Osun State. Nigeria. Written informed consents were obtained from all blood donors and confidentiality was assured by using codes.
Study Area
The study was conducted in Modakeke Health facilities, Ile Ife, Osun State. Modakeke is a town in Osun State, South West Nigeria with a population of close to 500,000 people. It is located in the tropical forest and It is about 45 kilometres from Osogbo, the Osun State. Majority of the inhabitants are skilled workers, e.g. civil servants and artisans while others are unskilled workers, e.g. peasant farmers, traders and transport workers.
Study Population
The study populations comprise of blood donors who came to donate blood at the government approved blood donor’s centers within the local government area. They were approached and the purpose of the study was discussed with them. Thereafter, the procedure to be taken was explained to them. The donors were informed that only those that signed the consent form will be allowed to participate in the study. They were also informed that participation is voluntary.
Study Design
The study was conducted between March 2021 and September 2021. A total of 400 blood samples were collected and prior to the collection of the blood samples structured questionnaire designed to collect basic demographic information including age, residential location, occupation and educational level and other information as regards the study.
Sample Size
A total of 400 blood samples were collected after ethical clearance and verbal consent were obtained from the donors.
Sample Collection and Processing Specimen Collection
Whole venous blood from 400 blood donors were collected randomly into commercially procured EDTA bottles and labeled accordingly. These will later be transported to laboratory for Parasitological and Serological investigations.
Screening for Malaria Parasite
Five (5) ml of venous blood was obtained from 400 blood donors into plain bottles and labeled accordingly. Thick and thin films of the donor’s blood samples were made on a slides, air dried for a few minutes at 370C then stained using Giemsa stain and then examined microscopically for presence and densities of malaria parasites and species identification.
Estimation of Parasite Numbers/µl of Blood
Parts of the thick film where the white cells are evenly distributed and the parasites are well stained were selected. Using the oil immersion objective, 100 white blood cells (WBC) at the same time the numbers of parasites in each field covered were systematically counted. This is repeated in ten good other areas of the film and averages of the three counts were taken. The number of parasites per µl of blood was calculated as follows:
200 200 WBC Count ParasitesCounted against WBC ×
Screening for Hepatitis B Virus (HBV) and Hepatitis C Virus (HCV)
Test to screen the 400 blood samples for HBV and HCV was done based on the detection of hepatitis B surface antigen (HBsAg) and hepatitis-C surface antigen (HCsAg) using rapid immunochromatographic (IC) tests which are in cassette form. The SMI One Step HBsAg and HCsAg Test Devices (Serum/Plasma) is a qualitative, lateral flow immunoassay for the detection of HBV and HCV in serum or plasma.
Determination of Hematological and Serum Biochemical Parameters of the Blood Donors Counting White Cells
0.38 l of diluting fluid (Turk’s solution) was measured and dispensed into a small tube, 0.02 ml of well-mixed EDTA anticoagulated blood of the donors was added and mixed. The counting chamber was assembled and the diluted blood sample using a capillary tube held at an angle of about 45 was used to fill one of the grids of the chamber with the sample taking care not to over fill the area. The chamber was left undisturbed for 2 minutes to allow time for the white cells to settle. The underside of the chamber was wiped dried and place it on the microscope stage and using the X10 objective with the condenser iris closed sufficiently to give good contrast, the cells was focused until they appear as small black dots. The cells in the four large corner squares of the chamber were counted including the cells lying on the lines of two sides of each large square. The reading was done Differential white cell count.
To a well-made and correctly stained thin blood film, a drop of immersion oil was dropped on the lower third of the blood film and cover with a clean cover glass. The film was examined microscopically using X10 objective with the condenser iris closed sufficiently to see the cells clearly and to view the part of the film where the red cells are just beginning to overlap and the x40objective was used to focus the blood film. The blood film was systematically examined and different white cells were counted as seen in each field using an automatic differential cell counter.
Estimation of Packed Cell Volume (PCV)
The packed cell volume of the blood from the donors was done by measuring the relative volume of the blood occupied by erythrocytes in Microhaematocrit tube by using the relation:
( ) ( )
100 Lengthof red cell column mm PCV Lengthof total column mm = ×
Determination of Blood Group of the Donors
Determination of the blood groups of the donors was done using Anti sera A, B, AB and anti D that determine the Rhesus factor as follows:
A glass slide was marked as follows Anti-A, Anti-B, Anti D and each division was pipette into as follows: Anti-A: 1 volume anti-A serum, 1 volume donor’s capillary blood, Anti-B: 1 volume anti-B serum, 1 volume donor’s capillary blood, Anti-AB: 1 volume anti-AB serum, 1 volume donor’s capillary blood, Anti-D: 1 volume anti-D serum, 1 volume donor’s capillary blood. The contents of each division were mixed using a clean piece of stick for each. The slide was tilted from side to side, looking for agglutination and the results recorded after 2 minutes
Data Analysis
Analysis of the data was done using Statistical Package for the Social Sciences tool version 21.0. The prevalence was calculated as the number of serologically positive samples divided by the total number of samples tested. The Chi- square test was used to determine associations between positivity and socio demographic factors. The strength of the associations was assessed by odds ratios and 95% confidence intervals (CI) were calculated.
Results
A total of 400 blood donors; aged 18-62 years had participated in the study. Majority of the donors that participated 91.0% (364/ 400) were male, 56.30% (225/400) were married, 49.50% (198/400) were in the age range 27-35 years, 31.50% (126/400) were artisans, and 67.0% (268/400) were in secondary.
The overall mean parasitaemia of malaria infection among the donors was 786.2025 ± 46.209 (µl/blood) while that of Hepatitis virus infection was 53/400(13.3%), HBV and HCV are 25/400 (6.3%) and 21/400 (5.3%) and co- infection 7(1.8%) respectively Table 1.
| Variables | Number Examined | Percentage (%) in the pool |
|---|---|---|
| Sex of the subjects | ||
| Male | 364 | 91 |
| Female | 36 | 9 |
| Marital Status | ||
| Married | 225 | 56.3 |
| Single | 175 | 43.8 |
| Age group (in years) | ||
| 18-26 | 19 | 4.8 |
| 27-35 | 198 | 49.5 |
| 36-44 | 119 | 29.8 |
| 45-53 | 48 | 12 |
| 54-62 | 16 | 4 |
| Occupation of the subjects | ||
| Artisan | 126 | 31.5 |
| Trading | 88 | 22 |
| Civil Servant | 48 | 12 |
| Driver | 24 | 6 |
| Student | 72 | 18 |
| Farmer | 42 | 10.5 |
| Level of Education of the subjects | ||
| Primary | 13 | 3.3 |
| Secondary | 268 | 67 |
| Tertiary | 119 | 29.8 |
| Total | 400 | 100 |
Table1: Socio-Demographic Characteristics of the Study Population of Donors (N=400) Modakeke Area Office Osun State.
In Table 2, the prevalence of Hepatitis virus infection was highest (57.9%) in donors aged 18-26 years followed by (18.8%) in donors aged 54-62 years and the least (13.4%) in aged 36-44 years. HBV has the highest (15.8%) in donors aged 18-26 years followed by (11.8%) in aged 36-44 years and the least (4.0%) in 27-35 years. The highest HCV (31.6%) was recorded in aged 18-26 years and the least (7.6%) in 27-35 years. The co-infection was highest (18.8%) in donors aged 54-62years and the least (1.7%) was recorded in 36-44years. there is significant difference between Hepatitis (p<0.000), HBV (p<0.005), HCV (p<0.000), Co-infect (p<0.000). The malaria infection was highest with mean parasitaemia 1,882.7895± 4169.33331(µl of blood) in donors aged 18-26 years followed by 1,224.9583± 2714.49894 (µl of blood) in donors aged 45-53 years and the least 145.3125± 102.75454 in 54-62 years (µl of blood) Figure 1.
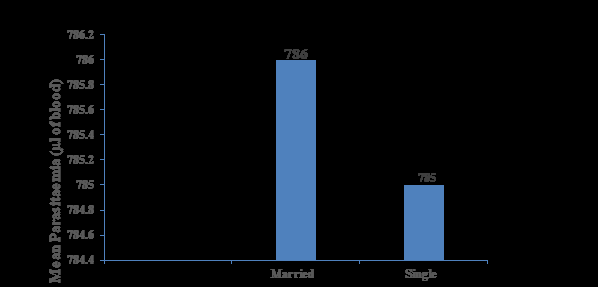
In females, Hepatitis viral infection was highest (22.2%) and HBV (6.3%) while HCV (16.7%) (Table 3), the mean parasitaemia 2,382.8056 ± 4957.86751(µl of blood) was highest among female (Figure 2). There is significant difference between marital status and HCV (p< 0.001). Among single donors, the prevalence of Hepatitis virus infection was highest (17.1%), HCV (8.6%) and HBV (6.3%) and co-infection (2.3%) (Table 4), while the malaria infection was highest with mean parasitaemia 786.8978± 2263.50513(µl of blood) among married donors (figure 3), there is significant difference between marital status and hepatitis infection (p< 0.043) and between HCV (p<0.009). In Table 2, the prevalence of Hepatitis virus infection was highest (21.4%) among artisan followed by (15.3%) among student and the least (2.3%) among trader. The highest HBV (14.6%) was recorded among civil servant followed by (8.7%) among artsan and the least (2.3%) among trader. The highest HCV (14.3%) was recorded among donors who are trader followed by (8.3%) among student and the least (7.1%) among artisan. The highest co-infection (5.6%) was recorded among artisan (Table 5). there is significant difference between Hepatitis (P<0.001), HBV (p<0.017), HCV (p<0.003), and Co- Infection ( P<0.008). The malaria infection was highest with mean parasitaemia 1,150.1591± 3148.98107 (µl/blood) in donors who are trader followed by 76.4306± 2278.26096 (µl/blood) in student and the least 22.6250 ± 151.01189 (µl/blood) among driver (Figure 4).
The prevalence of Hepatitis virus infection was highest (38.5%) in primary education followed by (15.7%) in secondary education and the least (5.0%) in tertiary education. The highest HCV (6.7%) was recorded in secondary education and the least (2.5%) in tertiary education. The highest HBV (15.4%) was recorded in primary education followed by (7.5%) in secondary education and the least (2.5%) in tertiary education. The highest co- infection (23.1%) was recorded in donors with primary education and the least (1.5%) was recorded in secondary education (Table 2). The malaria infection was highest with mean parasitaemia 2,096.8462± 3793.91187(µl of blood) in donors with primary education followed by 817.2015± 2418.19338(µl of blood) in donors with secondary education and the least 573.2101 ± 1155.90451(µl of blood) in donors with tertiary education (Figure 5). There was significant difference between marital status and hepatitis infection (p= 0.000) and between Co-infection (p=0.000).
| No Examined | No Infected (%) HEP | No Infected (%) HBV | No Infected (%) HCV | Co-infection of HBV and HCV | P value | |
|---|---|---|---|---|---|---|
| Age (years) | ||||||
| 18-26 | 19 | 11 (57.9) | 3 (15.8) | 6 (31.6) | 2 (10.5) | Hepatitis X2=41.163, p=0.000 |
| 27-35 | 198 | 23 (11.6) | 8 (4.0) | 15 (7.6) | 0(0.0) | HBV X2=15.044, p=0.005, |
| 36-44 | 119 | 16 (13.4) | 14 (11.8) | 0 (0.0) | 2 (1.7) | HCV X2=38.771, p=0.000 |
| 54-62 | 16 | 3 (18.8) | 0 (0.0) | 0 (0.0) | 3 (18.8) | Co-infect X2=39.790, p=0.000 |
| Sex | ||||||
| Male | 364 | 45 (12.4) | 23 (6.3) | 15 (4.1) | 7 (1.9) | |
| Female | 36 | 8 (22.2) | 2 (5.6) | 6 (16.7) | 0 (0.0) | |
| Marital status | ||||||
| Married | 225 | 23 (10.2) | 14 (6.2) | 6 (2.7) | 3 (1.3) | Hepatitis (X2)=8.389, p=0.004, |
| Single | 175 | 30 (17.1) | 11(6.3) | 15 (8.6) | 4 (2.3) | HCV (X2)=5.031, p=0.025 |
| Occupation | ||||||
| Artisan | 126 | 27 (21.4) | 11 (8.7) | 9 (7.1) | 7 (5.6) | Hepatitis (X2)=20.594, P=0.001 |
| Trader | 88 | 2 (2.3) | 2 (2.3) | 0 (0.0) | 0 (0.0) | HBV (X2)=13.847, p=0.017 |
| Civil servant | 48 | 7 (14.6) | 7 (14.6) | 0 (0.0) | 0 (0.0) | HCV (X2)=18.042, p=0.003 |
| Driver | 24 | 0(0.0) | 0 (0.0) | 0 (0.0) | 0 (0.0) | Co-Infection (X2)=15.493, P=0.008 |
| Student | 72 | 11 (15.3) | 5 (6.9) | 6 (8.3) | 0 (0.0) | |
| Farmer | 42 | 6 (14.3) | 0 (0.0) | 6 (14.3) | 0 (0.0) | |
| Education | ||||||
| Primary | 13 | 5 (38.5) | 2 (15.4) | 0 (0.0) | 3(23.1) | Hepatitis (X2)=15.531, P=0.000. |
| Secondary | 268 | 42 (15.7) | 20 (7.5) | 18 (6.7) | 4(1.5) | Co-Infection (X2)=36.613, p=0.000 |
| Tertiary | 119 | 6 (5.0) | 3 (2.5) | 3 (2.5) | 0 (0.0) | |
| Total | 400 | 53 (13.3) | 25 (6.3) | 21 (5.3) | 7 (1.8) |
Table 2: Prevalence of Hepatitis B virus, Hepatitis C virus and Malaria parasite and co-infections according to socio-demographic
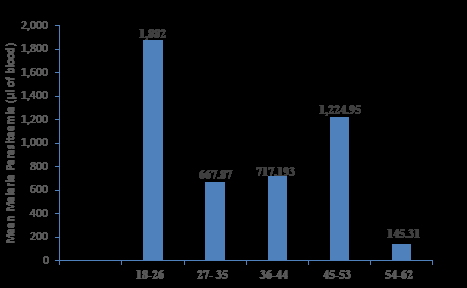
Age Group (years) Figure 1: Mean parasitaemia of Malarial infection among blood donors according to age in Modakeke Area Office.
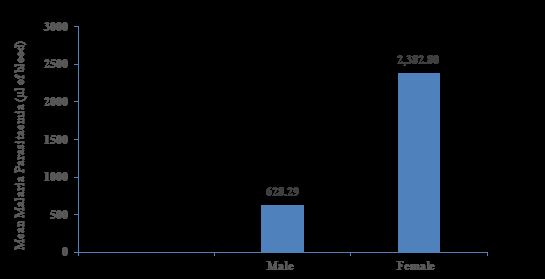
Gender Figure 2: Mean parasitaemia of Malarial infection among blood donors according to sex in Modakake Area Office.
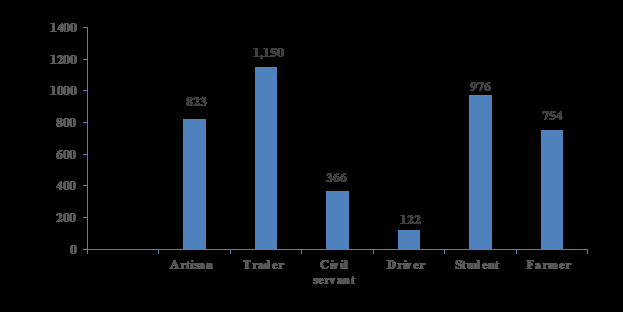
Occupation Figure 4: Mean parasitaemia of Malarial infection among blood donors according to occupation in Modakeke Area Office, Osun State.
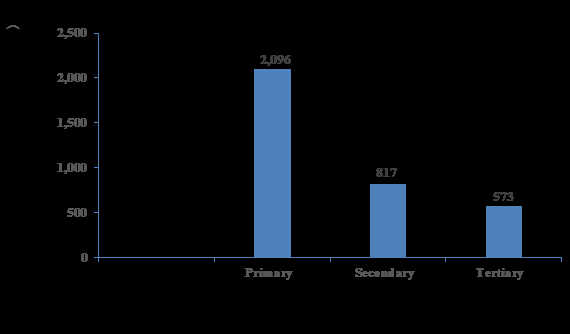
Education Figure 5: Mean parasitaemia of Malarial infection among blood donors according to Education in Modakeke, Area Office.
| No Examined | Number Infected with Hepatitis (%) | HBV (Number Infected) (%) | HCV (Number Infected) (%) | Co-infection of HBV and HCV (%) | |
|---|---|---|---|---|---|
| Ab+ | 5 | 0 (0.0) | 0 (0.0) | 0 (0.0) | 0 (0.0) |
| A- | 0 | 0 (0.0) | 0 (0.0) | 0 (0.0) | 0 (0.0) |
| A+ | 91 | 15 (16.5) | 6 (6.6) | 9 (9.9) | 0 (0.0) |
| B- | 6 | 0 (0.0) | 0 (0.0) | 0 (0.0) | 0 (0.0) |
| B+ | 69 | 15 (21.7) | 2 (2.9) | 9 (13.0) | 4 (5.8) |
| O- | 11 | 0 (0.0) | 0 (0.0) | 0 (0.0) | 0 (0.0) |
| O+ | 218 | 23 (10.6) | 17 (7.8) | 3 (0.8) | 3 (1.4) |
| Total | 400 | 53 (13.3) | 25 (6.3) | 21 (5.3) | 7 (1.8) |
Table 3: Prevalence of Hepatitis B virus and Hepatitis C virus among Malarious blood donors according to Blood group in Modake
Keys: A+ (A Rhesus D positive), B+ (B Rhesus D Positive), O+ (O Rhesus D positive), AB + (AB Rhesus D positive), A- (A Rhesus D negative) B- (B Rhesus D negative), O - (O Rhesus D negative), AB- (AB Rhesus D negative. Table 3: Prevalence of Hepatitis B virus and Hepatitis C virus among Malarious blood donors according to Blood group in Modakeke Area Office. Osun State.
HCV (X2)= 20.159, p= 0.001
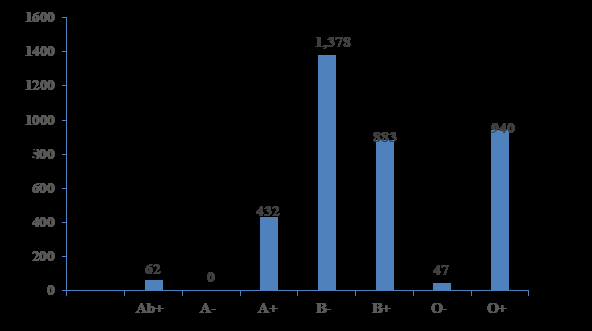
In Table 3, the prevalence of Hepatitis infection was highest (21.7%) in B+ve, followed by 16.5% in A+ve and the least 10.6% in O+ve. In HBV, (7.8%) in O+ve was the highest followed by (6.6%) in A+ve and the least (2.9%) in B+ve, The highest HCV (13.9%) was recorded in B+ve, followed by 9.9% in A+ve and the least (0.8%) in O+ve. co-infection (5.8%) was recorded in B+ve donors. The malaria infection was highest with mean parasitaemia 1,378.5000±1382.63527 (µl of blood) among B-ve donors followed by 940.7615±2566.70775 (µl of blood) in O+ve and the least 47.0000±34.76492 (µl of blood) in O-ve donors.
In Table 4, the highest mean PCV in the study was 44.33±2.828 in aged 54-62 years followed by 42.61±4.211 in aged 45-53 years and the least 42.22±3.804 in aged 36- 44 years. The highest mean WBC was 6,222.22 ± 706.714 in aged 54-62 years followed by 5,372.09± 1047.710 in aged 27-35 years and the least 5,063.64± 871.270 in aged 45-53 years. The highest mean eosinophil was 2.37±2.565 in aged 18-26 years followed by 1.99±4.036 in aged 27-35 years and the least 0.58± 1.048 in aged 45-53 years. The highest mean lymphocyte count 46.19± 7.756 in aged 54-62 years followed by 43.84±8.037 in aged 27-35 years and the least 40.16± 5.294 in aged 18-26 years. The highest mean neutrophil count 57.71± 7.477 was recorded in aged 36-44 years followed by 56.95± 6.187 in aged 18-26 years and the least 53.63±7.089 in aged 54-62 years.
The highest mean PCV 42.90±3.213 was recorded among Trader, mean WBC 5,348.41 ± 1180.694 among Artisan, mean eosinophil 1.41 ± 2.396 among trader, mean lymphocyte count 43.94± 7.154 among trader and mean neutrophil count 56.27± 9.617was recorded among artisan (Table 4).
The highest mean PCV 44.44± 2.988 was recorded among donors with primary education, mean WBC 5,715.38 ± 1138.600, among donors with primary education. Mean eosinophil 1.68 ± 1.961 among tertiary, mean lymphocyte count 46.00±3.873 among donors with primary and mean neutrophil count 55.85± 5.886 was recorded among donors with primary education (Table 4).
| No Examined | Mean Neutrophils | Mean Lymphocyte | Mean Eosinophils | Mean WBC | Mean PCV | |
|---|---|---|---|---|---|---|
| Age (years) | ||||||
| 18-26 | 19 | 56.95±6.187 | 40.16±5.294 | 2.37±2.565 | 5,218.18±1005.052 | 42.50±3.218 |
| 27-35 | 198 | 54.33±8.254 | 43.84±8.037 | 1.99±4.036 | 5,372.09±1047.710 | 42.56±4.368 |
| 36-44 | 119 | 57.71±7.477 | 41.04±7.079 | 1.03±2.201 | 5,227.45±1048.071 | 42.22±3.804 |
| 45-53 | 48 | 56.71±4.608 | 43.44±5.968 | 0.58±1.048 | 5,063.64±871.270 | 42.61±4.211 |
| 54-62 | 16 | 53.63±7.089 | 46.19±7.756 | 1.31±1.778 | 6,222.22±706.714 | 44.33±2.828 |
| Sex | ||||||
| Male | 364 | 55.65±7.751 | 42.93±7.557 | 1.49±3.303 | 5,258.24±1034.695 | 43.10±2.923 |
| Female | 36 | 56.42±6.822 | 42.31±7.348 | 1.94±2.137 | 5,513.89±1018.725 | 37.83±2.007 |
| Marital status | ||||||
| Married | 225 | 56.14±7.113 | 42.93±7.173 | 1.30±3.828 | 5,281.78±1097.878 | 42.95±3.065 |
| Single | 175 | 55.18±8.316 | 42.81±7.990 | 1.83±2.167 | 5,280.57±950.178 | 42.22±3.387 |
| Occupation | ||||||
| Artisan | 126 | 56.27±9.617 | 42.56±9.170 | 1.02±1.690 | 5,348.41±1180.694 | 42.42±3.228 |
| Trader | 88 | 54.45±6.624 | 43.94±7.154 | 1.41±2.396 | 5,148.86±948.198 | 42.90±3.213 |
| Civil servant | 48 | 55.19±6.850 | 43.75±6.138 | 1.19±1.864 | 5,108.33±847.232 | 42.54±3.339 |
| Driver | 24 | 60.46±7.673 | 41.08±9.815 | 0.00±0.000 | 5,645.83±1083.866 | 42.17±1.949 |
| Student | 72 | 55.75±5.558 | 41.867±5.060 | 2.39±2.447 | 5,409.72±865.156 | 41.92±3.504 |
| Farmer | 42 | 54.57±6.129 | 43.71±6.054 | 3.10±7.701 | 5,126.19±1123.813 | 44.29±2.708 |
| Education | ||||||
| Primary | 13 | 55.85±5.886 | 46.00±3.873 | 1.62±1.850 | 5,715.38±1138.600 | 44.44±2.988 |
| Secondary | 268 | 55.87±8.123 | 42.87±8.225 | 1.46±3.686 | 5,236.94±1095.384 | 42.21±4.113 |
| Tertiary | 119 | 55.71±6.709 | 42.55±6.002 | 1.68±1.961 | 5,333.61±862.916 | 42.80±3.963 |
| Total | 400 | 55.72±7.668 | 42.88±7.532 | 1.53±3.216 | 5,281.25±1034.601 | 42.63±3.226 |
Table 4: The Age distribution, Mean Neutrophil, Lymphocyte, Eosinophils, White blood cells and packed cell volume according to so
Normal ranges: WBC = 4000-10,000/mm 3, Neutrophil = 40-70% Lymphocyte = 20-45%, Eosinophil= 1-6%, Packed cell volume (PCV) Women = (36-46%), Men = (40-54%).
(Table 5), present the logistic regression model for variables and Blood group as shown below. Aged range 27- 35 years was significantly associated with Hepatitis infection (p<0.022), then Sex, where female and male has association with hepatitis infection (p<0.006). Occupation, trading has association with Hepatitis infection (p<0 .001), Tertiary and secondary also has association with the infection (p<0.003), A rhesus D positive and B rhesus D positive blood groups has association with the infection (p<0.018) and (p <0.001) respectively.
Model Coefficients - INFECTED HEPATITIS (Hepatitis B and C)
Predictor Estimate SE Z p
AGE:
27-35 – 18-26 -1.88982 0.822 -2.2978 0.022
36-44 – 18-26 -1.15673 0.919 -1.2587 0.208
45-53 – 18-26 -18.7203 1339.16 -0.014 0.989
54-62 – 18-26 -0.69743 1.225 -0.5696 0.569
SEX:
MARITALSTAT:
single – married 0.41918 0.453 0.92567 0.355
OCCUPATION:
Trading – Artisan -2.63274 0.797 -3.3039 < .001
Civil servant – Artisan 0.4923 0.651 0.7568 0.449
Driver – Artisan -18.1751 1935.23 -0.0094 0.993
Intercept -0.60405 0.959 -0.6302 0.529
f – m 1.93443 0.702 2.75738 0.006
| Student – Artisan | 0.00344 | 0.796 | 0.00432 | 0.997 |
|---|---|---|---|---|
| Farmer – Artisan | -0.22292 | 0.576 | -0.3869 | 0.699 |
| EDUCATION: | ||||
| tertiary – secondary | -2.16756 | 0.735 | -2.9474 | 0.003 |
| primary – secondary | 1.21675 | 0.758 | 1.60521 | 0.108 |
| BLDGRP: | ||||
| Apos – Opos | 1.09475 | 0.464 | 2.35925 | 0.018 |
| Bneg – Opos | -15.1492 | 3943.58 | -0.0038 | 0.997 |
| Bpos – Opos | 1.67719 | 0.517 | 3.24682 | 0.001 |
| Oneg – Opos | -16.5437 | 2976.57 | -0.0056 | 0.996 |
| Abpos – Opos | -15.2359 | 4805.92 | -0.0032 | 0.997 |
| Note. Estimates represent the log odds of “INFECTEDBampC = infected” vs. “INFECTEDBampC = Not infected” |
Table 5: logistic regression model of the variable with Hepatitis Infection.
Discussion and Conclusion
In this study, the overall prevalence of Malaria infection was 786.2025 ± 46.209(µl/blood), Hepatitis infection was 13.3%, this value was higher than 4.5% reported by Abate, et al. in their study on Hepatitis b and c viral infections among blood donors at bahir dar, in Ethiopia and lesser than 40.67% observed among the donors in Benue state Nigeria by Paulyn, et al. [9]. Hepatitis B virus was 6.3%, Hepatitis C virus was 5.3%, and co-infection of both was 1.8% among blood donors, whereas, Biadgo, et al. [10] reported that 3.6% were positive for HBV, 0.8% for HCV and 0.062% of the study’s participants were co-infected with HBV and HCV in Ethiopia.
According to Age of the donors, the prevalence of Hepatitis virus infection was highest 57.9%, HBV 15.8% and HCV 31.6% in donor aged 18-26years whereas co-infection (18.8%) was highest in donors aged 54-62years, whereas, Paulyn, et al. [9] recorded that more youthful age groups 18-22years, 23-27years and 28-32years had higher prevalence of infection at 11.90%, 13.05% and 6.53%, respectively, also, Sial, et al. [11] reported that HBV and HCV were positive in 1.24% and 2.51% subjects respectively whereas co-infection of HBV and anti HCV was found in 0.03% cases in Rashid Latif Medical College, Lahore. Moreover, it was also reported by Amazigo and Chime in the year 1990 that by the age of 40 years, 87 % of the Nigerian population has at least one HBV serologic markers. Malaria infection was highest with mean parasitaemia 1,882.7895± 4169.33331 (µl of blood) in donors aged 18-26 years but Barcus, et al. [12], in there study on the prevalence of infection with hepatitis B virus among adult Vietnamese patients hospitalized for severe Plasmodium falciparum malaria reported that the mean age of severe malaria subjects was 33 years with a range of 15–78 years, they also reported that the prevalence of HBsAg in subjects with severe malaria was 23.77%. Obimakinde, et al. [13] in there study on the prevalence of malaria Infection among Patients attending the health centre of the federal university of technology, Akure, Nigeria reported that the highest prevalence of 91.1% was recorded among the children aged 1-10years, while the lowest prevalence of 56.8% was recorded among the age group above 60 years.
In this study, according to sex, In females, Hepatitis viraemia was highest 22.2% and HBV 6.3% while HCV 16.7% and co-infection 1.9% was recorded among the male, this is in agreement with Nkrumah, et al. [14] who reported that the prevalence of Hepatitis B viral (HBV) infection was highest in females with 21.4% in 2006 than males in the same year with 13.2% while Hepatitis C viral (HCV) infection was highest among males with 11.6% in 2007. HBV and HCV co-infection was highest in males 2.6% than females 1.3% in 2007. The rate of co-infection of HBV and HCV however increased from 1.6% in 2006 to 2.2% in 2008 in males and from 0% in 2006 to 1.2% in 2008 in females. Moreover, a recent study done by Alemeshet, et al. [15], in Southwest Ethiopia showed a high prevalence of the HBV in male 2.5% than the female 0.8% donors. However, the high prevalence of HCV in males might be due to the likelihood of men to have multiple sex partners and might be involved in unprotected sex. The mean parasitaemia 2,382.8056 ± 4957.86 (µl of blood) was highest among female in this study, this is in conjuction with the report of Obimakinde, et al. [13] where the prevalence 51% of malaria among the female patients was higher than the prevalence 49% among the male patients.
Among single donors in this study, the prevalence of Hepatitis virus infection was highest (17.1%), HCV (8.6%) and HBV (6.3%) and co-infection (2.3%) compared to the married, this in conjuctions with the reports of Abate, et al. where the prevalence of HBV was higher in single 4.2% than married and Negash, et al. [16] where the sero-positivity for HBV was significantly associated with marital status by which many of the infected donors were among single group, on the contrary, Kesete, et al. [17] reported that Married were found to be more exposed to both HBsAg and anti-HCV with seropositivity of 8.4% and 2.4% respectively, while the malaria infection was highest with mean parasitaemia 786.8978± 2263.50 (µl of blood) among married donors. there is significant difference between marital status and hepatitis infection (p= 0.043) and between HCV (p=0.009). According to this study, the prevalence of highest Hepatitis viraemia (21.4%) and coinfection 5.6% recorded among artisan, HBV (14.6%) among civil servant and HCV 14.3% was recorded among donors who are trader. The malaria infection was highest with mean parasitaemia 1,150.1591± 3148.98 (µl/blood) in donors who are trader.
The highest prevalence of Hepatitis virus infection (38.5%), HBV (15.4%) and co-infection (0.4%) was recorded in primary education while HCV (6.7%) was recorded in donors with secondary education. Moreover, Kesete, et al. [18] reported that the highest prevalence of HBsAg was observed in subjects with higher level of education (9.8%). In contrast, anti-HCV seroprevalence decreased with increasing level of education. The malaria infection was highest with mean parasitaemia 931.69± 136.23 (µl of blood) in donors with secondary education. There was significant difference between marital status and hepatitis infection (p= 0.000) and between Co-infection (p=0.000). According to the Blood group of the donors, the highest prevalence of Hepatitis infection (21.7%), HCV (13.9%) and co-infection (5.8%) was recorded in B+ve, while HBV (7.8%) was recorded in O+ve. The highest malaria infection with mean parasitaemia 1,378.5000±1382.63 (µl of blood) was recorded among B-ve donors. Blood group screening is a mandatory process in blood donation and transfusion because certain blood groups influence the pathogenesis of HBV, HCV and other transfusion-transmitted infections [18, 19]. Blood group antigens influence the transmission of viruses and other infectious agents by modulating the inflammatory and immune responses or by acting as ligands and receptors for such agents [20, 21, 22, 23]. For instance, some ABO antigens are capable of blocking the binding of transfusion-transmitted disease-causing organisms to polysaccharides on the host’s cells while others are not [22]. For HBV, Blood group O carriers have been found with a higher risk of infection than other blood group carriers [24].
There was an association between blood group and HCV (p< 0.001) in the current study. Previous reports on the association of blood groups with HBV have not been coherent. For example, among Asians, in a meta-analysis, blood group B was associated with a lower risk of HBV infection while blood group O was not significantly associated with HBV infection [25]. In another study, among Iranian blood donors, blood group O was associated with a lower risk of HBV infection [26]. On the contrary, blood group O was associated with a higher risk of HBV among Chinese.
Haematological changes are indicative feature of malaria and hepatitis infections. Various hematological abnormalities have been duly linked to the prevalence of malaria and hepatitis. They include Leucopenia, Neutropenia, Eosinophilia, leucocytosis, and Neutrophilia. The results of this study showed that the presence of malaria and hepatitis infection in the donors did not affect the hematological parameters evaluated. Lower neutrophil and leukocyte counts are usually indicative of leucopenia but this was not found in this study among donors with malaria and Hepatitis infections. In this study, the haematological parameters fall within the normal range for each. The highest mean PCV in the study was 44.33±2.82 in aged 54-62 years, the highest mean WBC was 6,222.22 ± 706.714 in aged 54-62 years, the highest mean eosinophil was 2.37±2.565 in aged 18-26 years, the highest mean lymphocyte count 46.19± 7.756 in aged 54- 62 years, the highest mean neutrophil count 57.71± 7.477 was recorded in aged 36-44 years.
According to marital status of the donors, the highest mean PCV 42.95±3.065, mean WBC 5,281.78± 1097.878, mean lymphocyte count 42.93±7.173 and mean Neutrophil count 56.14± 7.113 were recorded in married. While mean eosinophil 1.83±2.167 was recorded in single.
According to sex of the donors, the highest mean PCV 43.10±2.923 and mean lymphocyte count 42.93±7.557was recorded in male, while, mean WBC 5,513.89± 1018.725, mean eosinophil 1.94±2.137 and mean Neutrophil count 56.42± 6.822 were recorded in female.
In occupation status of the donors, the highest mean PCV 42.90±3.213, mean eosinophil 1.41 ± 2.396 and mean lymphocyte count 43.94± 7.154 were recorded among trader while, mean WBC 5,348.41 ± 1180.694 and mean neutrophil count 56.27± 9.617 were recorded among artisan.
In education status, the highest mean PCV 44.44± 2.988, mean WBC 5,715.38 ± 1138.600, mean lymphocyte count 46.00±3.873 and mean neutrophil count 55.85± 5.886 were recorded among donors with primary education while, Mean eosinophil 1.68 ± 1.961 was recorded among tertiary education.
The logistic regression shows that there was an association between hepatitis viral infection and aged group 27-35years (p=0.022), female (p=0.006), trading (p=0.001), tertiary (p=0.003) A+ve (p=0.018) and B+ve (p=0.001).
In conclusion, although the prevalence of malaria, hepatitis B and C viral infection was low in the local government, General surveillance through mass screening to identify those with infection and instituting appropriate treatment, mass immunisation against the virus and public health education to enlighten the public of the possible risk factors for and routes of infection are necessary. More aggressive strategies should be adopted in the fight against malaria such as extensive environmental insecticide spraying, de-clogging of water ways and drainages as well as widespread and effective distribution of Insecticide Treated Nets (ITNs) and other anti-malarials.
References
-
World Health Organization (2000) Roll Back Malaria action at the country level: country updates October 1998–June 2000. WHO/CDS/RBM (24): 78.
-
Hien TT, Day NP, Nguyen HP, Nguyen TH, Tran TH, et al. (1996) A controlled trial of artemether or quinine in Vietnamese adults with severe falciparum malaria. N Engl J Med 355: 76-83.
-
Oniyangi O, Omari AAA (2006) Malaria chemonprophylaxisin sickle cell disease. Cochrane Database System Revision CD00389.
-
Flichman DM, Blejer JL, Livellara BI, Re VE, Bartoli S, et al. (2014) Prevalence and trends of markers of hepatitis B virus, hepatitis C virus and human Immunodeficiency virus in Argentine blood donors. BMC Infect Dis 14: 218.
-
Zaheer H, Saeed U, Waheed Y, Karimi S, Waheed U (2014) Prevalence and trends of hepatitis B, hepatitis C and human immunodeficiency viruses among blood donors in Islamabad, Pakistan 2005-2013. J Blood Disorders Transf 5(217): 2.
-
Walter SR, Thein HH, Amin J, Gidding HF, Ward K, et al. (2011) Trends in mortality after diagnosis of hepatitis B or C infection: 1992-2006. J Hepatol 54(5): 879-886.
-
Boraschi D, Abebe Alemayehu M, Aseffa A, Chiodi F, Chisi J, et al. (2008) Immunity against HIV/AIDS, Malaria, and Tuberculosis during Co-Infections with Neglected Infectious Diseases: Recommendations for the European Union Research Priorities. Public Library of Science (PLoS) Negl Trop Dis 2(6): e255.
-
Schofield L, Grau GE (2005) Immunological processes in malaria pathogenesis. Nat Rev Immunol 5: 722-735.
-
Aernan PT, Sar TT, Torkula SH (2011) Prevalence of Plasmodia and hepatitis B virus co-infection in blood donors at Bishop Murray Medical Centre, Makurdi, Benue State, Nigeria. Asian Pacific Journal of Tropical Medicine 4(3): 224-226.
-
Biadgo B, Shiferaw E, Woldu B, Alene KA, Melku M (2017) Transfusion-transmissible viral infections among blood donors at the NorthGondar district blood bank, northwest Ethiopia: A three year retrospective study. PLoS ONE 12(7): e0180416.
-
Sial GR, Khan S, Shahid SU, Bhatti S, Farooq F (2016) Prevalence of transfusion transmitted infections in asymptomatic blood donors: is syphilis alarming. Biomedica 32(S 1): 1-8.
-
Mazie JB, Hien TT, Nicholas WJ, Kanti L, Jeremy F, et al. (2002) Short Report: Hepatitis B Infection and Severe _Plasmodium falciparum_ Malaria in Vietnamese Adults. U.S. Navy Research pp: 1-5.
-
Obimakinde ET, Simon-Oke IA (2017) The Prevalence of Malaria Infection among Patients Attending the Health Centre of the Federal University of Technology, Akure, Nigeria. International Journal of Tropical Disease & Health 27(4): 1-7.
-
Nkrumah B, Owusu M, Frempong HO, Averu P (2011) Hepatitis B and C Viral Infections Among Blood Donors from Rural Ghana. Ghana Medical Journal 45(3): 97-100.
-
Alemeshet Y, Fissehaye A, Alima H (2011) Hepatitis B and C Viruses Infections and Their Association With Human Immunodeficiency Virus: A Cross-Sectional Study Among Blood Donors In Ethiopia. Ethiop J Health Sci 21(1): 67-75.
-
Negash M, Ayalew M, Geremew D, Workineh M (2019) Seroprevalence and associated risk factors for HIV, Hepatitis B and C among blood Donors in South Gondar District blood Bank, Northwest Ethiopia. BMC Infect Dis 19(1): 430
-
Kesete Y, Nahom F, Achila OO, Mekonen F, Woldemariam L, et al. (2022) Prevalence of Hepatitis B and C Viruses and Associated Risk Factors in Patients Suspected of Liver Diseases in Asmara, Eritrea. J Infect Dis Med 7(2): 218.
-
Anwar MS, Siddiqi GM, Haq S, Khokhar G, Jaffery G (2011) Association of blood group types to hepatitis B and hepatitis C virus infection. Biomedical 27(12): 57- 61.
-
Tyagi S, Tyagi A (2013) Possible correlation of transfusion transmitted diseases with Rh type and ABO blood group system. J Clin Diagn Res 7(9): 1930-1931.
-
Rios M, Bianca C (2000) The role of blood group antigens in infectious diseases. Seminars hematology 37(2): 177- 185.
-
Zhou Y, Zhou Q, Lin Q, Chen R, Gong Y, et al. (2013) Evaluation of risk factors for extrahepatic cholangiocarcinoma: ABO blood group, hepatitis B virus and their synergism. Int J Cancer 133(8): 1867-1875.
-
SB KV, Bandi S, Kondareddy S, Madithadu A (2015) Association of ABO and Rh blood groups to HBV, HCV infections among blood donors in a blood bank of tertiary care teaching hospital in southern India: a retrospective study. Int J Res Med Sci 3(7): 1672-1676.
-
Paré G, Chasman DI, Kellogg M, Zee RY, Rifai N, et al. (2008) Novel association of ABO histo-blood group antigen with soluble ICAM-1: results of a genome-wide association study of 6,578 women. PLoS Genet 4(7): e1000118.
-
Liu J, Zhang S, Liu M, Wang Q, Shen H, et al. (2018) Distribution of ABO/Rh blood groups and their association with hepatitis B virus infection in 3.8 million Chinese adults: a population-based cross-sectional study. J Viral Hepat 25(4): 401-411.
-
Jing W, Zhao S, Liu J, Liu M (2020) ABO blood groups and hepatitis B virus infection: a systematic review and meta-analysis. BMJ Open 10(1): e034114.
-
Mohammadali F, Pourfathollah A (2014) Association of ABO and Rh blood groups to blood-borne infections among blood donors in Tehran-Iran. Iran J Public Health 43(7): 981-989.
- Intersecting Epidemics and Climate Vulnerabilities in Conflict- Driven Displacement: Epidemiology, Systemic Challenges, and One Health Gaps in South Sudan
- Advancing Domestic Health Financing for Community Health System Sustainability in South Sudan: The Boma Health Initiative Model (2025–2035)
- Prevalence and Correlates of Post-Exposure Prophylaxis Uptake among Men Who Have Sex with Men in Kisumu County, Kenya
- Medical, Ethical, and Legal Conflicts Surrounding Euthanasia in Argentina. Its Global Implications
- Knowledge and Attitude on Menstrual Hygiene among Adolescent Girls Studying in Secondary Level in Public Schools of Chitwan District, Nepal
- Biological Efficacy of an Adulticide Mixture (clothianidin + deltamethrin) as an Indoor Residual Spray against Adult Anopheles flavirostris in Palawan, the Philippines