Late Pliocene Sapphire Sand Reservoirs Characterization Using Nuclear Magnetic Resonance: Sapphire-1 well, Case Study, WDDM, Egypt
This paper documents first deployment of new Magnetic Resonance (NMR) approach for characterizing late-Pliocene complex shaly sandstone reservoirs Sapphire field. Use of conventional logs like Gamma ray, Density, Neutron and Sonic for the reservoir characterization in these reservoirs pose challenges due to its lithological complexity and hetrogenity. The Pliocene delta slope-channel play (Sapphire Field) reservoirs are a shaly sandstone reservoir with vertical and lateral heterogeneous properties. The clay content in such reservoirs causes overestimation of the shale volume and overestimation of the formation porosity leading to inaccurate identification of lithology and estimation of the formation fluids using the conventional logs. Therefore, the porosity independent lithology Magnetic Resonance logging measurement was acquired in dual-wait time enabled T2 polarization mode to differentiate between moveable water and hydrocarbons. After acquisition, standard deliverables were porosity and permeability index with the porosity divided into clay-bound water (CBW), bulk-volume irreducible (BVI) and bulk-volume moveable (BVM) components. The rock quality was interpreted based using permeability index and effective porosity ratio, and classified based on its gradients, to identify the high, medium to low, and tight flow unit zones. The steeper ratio gradient was interpreted as high flow, gentle gradient as medium to low flow and flat gradient as tight flow zones. Based on the NMR flow units and fluid types (CBW, BVI and BVM), the drilled interval was classified into ten compartments of high flow, eleven compartment of medium to low flow along with three tight compartments. The relationship between storage and flow capacities for these compartment intervals revealed that, whereas the high flow units only have 19 % of the total storage capacity, they contribute over 70% of the total flow capacity, while the medium to low flow units containing 71% of the total storage deliver 29% of the total flow capacity, finally the tight flow units have 10 % of the total storage and 1 % of the total flow. NMR data acquisition and processing has added value for reservoir characterization in this challenging shaly sand reservoirs by distinguishing tight and movable hydrocarbon bearing zones in terms of flow and storage units, and quantification of their storage and flow capacity leading to the determination of sapphire reservoirs true hydrocarbon reserves and production potential.
Introduction
The Pliocene deep marine delta slope-channel play (Sapphire Field) reservoirs are shaly sandstone reservoir with vertical and horizontal heterogeneous properties. The clay content in such heterogeneous sand reservoirs causes overestimation of the shale volume and formation porosity leading to inaccurate formation fluid estimation using the conventional logs. This poses reservoir Characterization challenges such that the identification of lithology, effective porosity and fluid types becomes difficult leading to uncertainties in the formation evaluation as well as estimation of in place reserves and production potential. Nuclear Magnetic Resonance (NMR) is a non radioactive-source technology with direct measurement of fluid-filled porosity. Therefore, this technology offers a safer, alternate tool physics measurement, different from other porosity technologies such as the neutron density which is a radioactive-source based methodology, or acoustic measurements that lack resolution. This paper presents a new method of reservoir characterization using NMR technology for the first time in Sapphire Sand reservoirs in WDDM, in which the rock quality was interpreted based on using permeability index (flow capacity) and effective porosity ratio (storage capacity) and classified based on their gradients, to identify the high, medium to low, and tight flow unit zones.
Results such as lithology rock typing, fluid typing, porosity partitioning leading to an accurate estimation of fluid saturation index, porosity and permeability index from this method help in the assessing the true reservoir reserves and production potential.
Geological Background and Reservoir Information
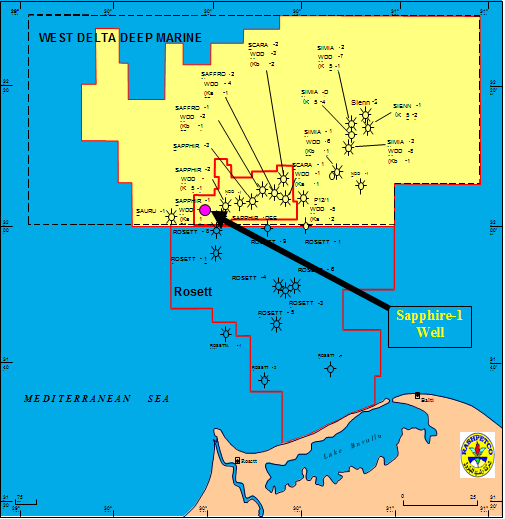
The West Delta Deep Marine (WDDM) license lies offshore in the deepwater (200-2500 m) of the present day Nile Delta. The license, pre first relinquishment (25 %) covered circa. 8050 km2 of the north-western margin of the Nile Delta cone. Recent exploration activity has focused on the Pliocene slope-channel play with a number of exploration and appraisal wells successfully drilled in WDDM. The discoveries include the Scarab and Saffron fields, which now lie within a development lease. Within subsequent development leases are the Simian, Sienna, Sapphire, Sequoia, Saurus and Serpent Channels. The major tectonic features/ depositional controls on the license are the SW/NE trending Rosetta Fault and the ENE-WSW trending NDOA anticline. The Pliocene Sapphire accumulation was penetrated in 1975 by the Esso NDOA-1 well although the well was targeted at the Miocene. The Sapphire-1 and Sapphire-2 wells, drilled in 2000 confirmed the commerciality of the Sapphire field. The Sapphire-3 well drilled in 2001 confirmed the lateral continuity of the reservoir sands.
Methodology
Logging Technology and Acquisition
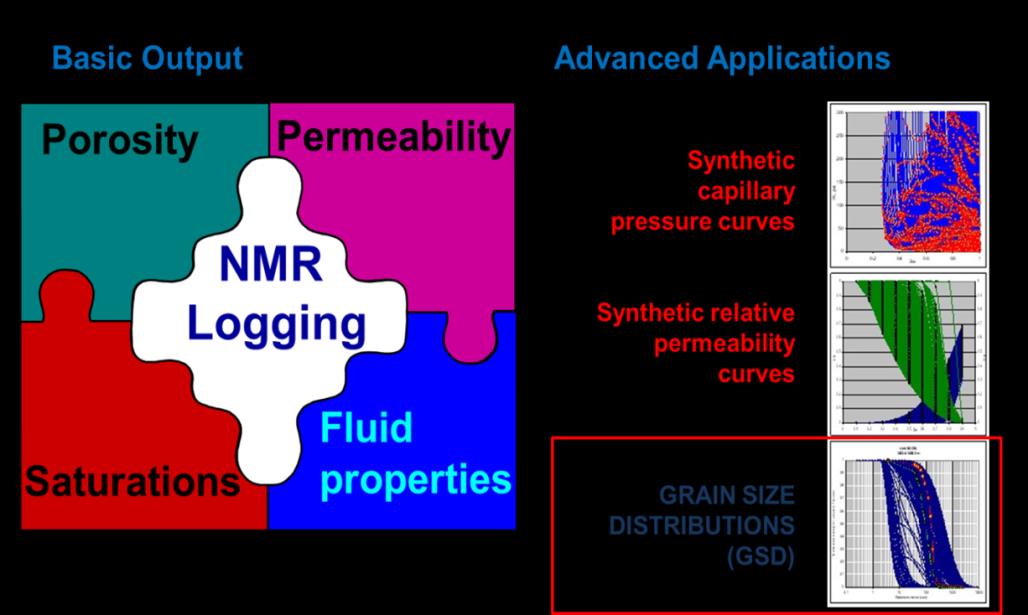
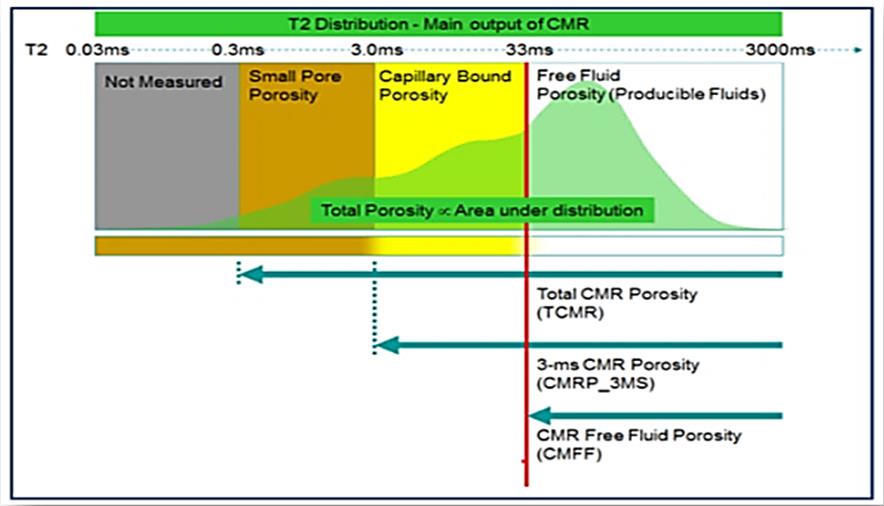
Nuclear Magnetic Resonance is a direct measurement of lithology independent fluid-filled porosity using non radioactive-source which is environmentally safe. The NMR petrophysical measurements and their applications have been explained by many authors [2, 3, 4]. The measured porosity doesn’t need any type of lithology correction but need fluid hydrogen index correction. The Magnetic Resonance delivers dependable estimates of moveable fluids in clastics and complex lithologies to optimize reservoir drainage strategies. A specific acquisition mode was used called dual wait-time mode which enabled NMR to identify water and hydrocarbon by using short-time 1 second and long-time 16 seconds wait times [5]. Magnetic Resonance has basic output and advanced applications (Figure 2). The standard basic results give total porosity which can be divided into clay bound water (CBW) porosity that represents the water in the internal structure of clay minerals. The amount of clay bound water reflects the volume of clay minerals in the reservoir [6]. The effective porosity is the result of the subtraction of CBW porosity from NMR total porosity. This effective porosity can be divided into two types, firstly the pores which contain free fluids and the pores which contain bound fluids which is bounded under capillary forces (Figure 3). The standard outputs also includes, permeability index and fluid properties (movable and immovable fluid) where fluid saturation is estimated using Dual Wait Time data for the movable fluid (water and oil) based on their intrinsic properties. Advanced applications of Magnetic Resonance include deliverables such as synthetic capillary pressures, relative permeability curves and grain/pore size distributions.
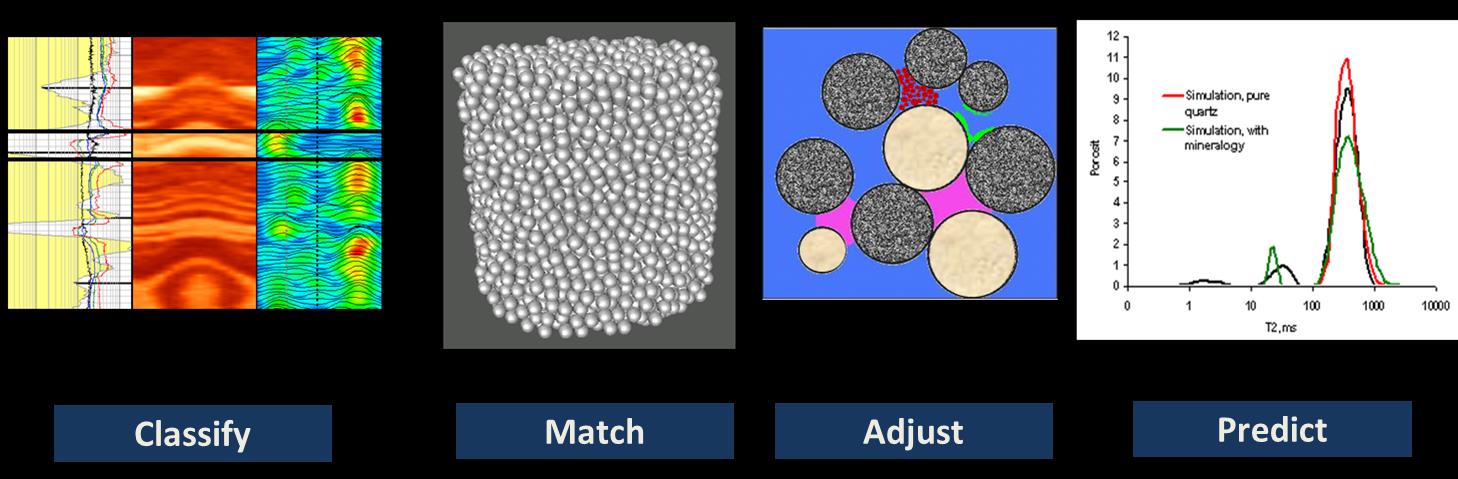
Processing
The Nuclear Magnetic Resonance fluid saturation was computed using Dual Wait Time data which enabled to differentiate water and hydrocarbon based of short and lon wait-time as 1 second and 16 second respectively. Basic processing was conducted to generate key petrophysical parameters such as partial porosities with permeability index for different bins using 16times- stackings in order to yield good quality result. The calculation was done using proprietary computation with parameters such as gas gravity, density, longer, the pore size being coarse so each bin is representing a range of pore sizes starting from the smallest 0 m sec and ending by the coarsest 512 m sec [7]. In the present study_, T_2 is being used for advanced processing which gave result for estimation of the grain / pore size distribution. The computation for grain size was achieved from T2 distribution using pore geometric modelling. The basic concept of grain/pore size distribution analysis is shown in (Figure 4). The pore geometric model starts from the random dense packing of equal spheres. Adjustment for input parameters is done based on porosity reduction mechanisms primarily based on shaly sand mineralogy, since clay is high as evidenced by very high Gamma Ray response. In the processing of the random dense packing of equal spheres with input mineralogy, the pore scale modeling generates a pore network of tetrahedral pores and pore throats. At this step the T2 relaxation distributions from pore scale modeling were simulated with one single grain size at a time as imputed, as shown in (Figure 4), until a good match was obtained between measured and simulated T2 relaxations.
Results
Reservoir characterization
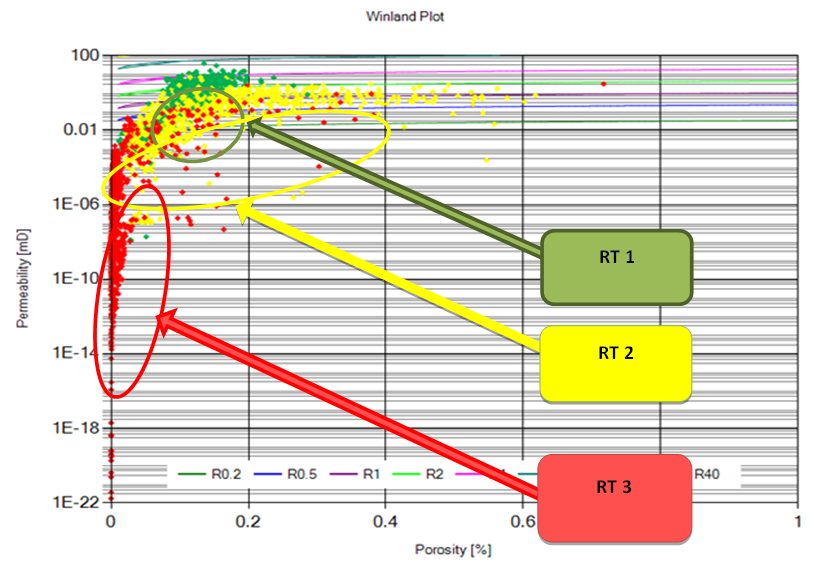
The porosity-permeability relationship using winland cross plot (Figure 5), showed that the Sapphire reservoirs in Sapphire-1 well could be classified into three main rock types. The first rock type (RT1), shaded with green color represents the best rock unit with a range of (0.1- 0.2 pu) porosity and the permeability rang (0.1 - 30 md). The second rock type (RT2) shaded with yellow color represents medium quality rock units having (0.05 – 0.40 pu) porosity rang with permeability rang of (<0.01 – 6 md). The lowest rock quality units (RT3) shaded with red color, it has porosity rang of (0.0 - 20pu) with permeability between (<0.01 and 1 md).
Dynamic Rock Types Classification
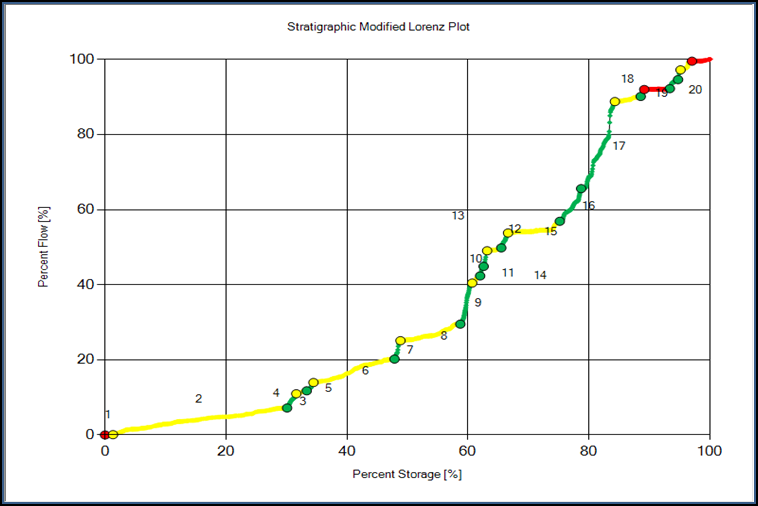
The relationship between the flow and storage capacities was further analyzed using the slope trend lines (Table 1), by using the modified Lorenz cross plot (Figure 7), the graphical presentation of that relationship showed in (Figure 8). The slop trend line classified 24 sub units into three main dynamic rock units, the hid flow dynamic rock units, (i) the high flow dynamic rock units(DRT-1)with high steady slop, (ii) the moderate to low flow dynamic rock units (DRT-2) with moderate slope and (iii) the tightest dynamic rock units (DRT-3) with gentle to almost horizontal slope. The following is the detailed interpretation of the three different dynamic rock units:- i. High Flow Rock Unit (DRT-1): The (DRT-1) shaded with green color (Figure 7) included ten reservoir units with eleven steep slope trend lines, those rock units numbers are (12, 9, 22, 7, 11, 17, 14, 3, 16 and 21). This dynamic rock (DRT-1) unit considered the best rock unit, because it has around 19% of the whole storage capacity and 70% of the whole Sapphire-1 well flow capacity. ii. Medium Flow Rock Unit (DRT-2): This rock unit shaded with yellow (Figure 7), include nine gentle slope trend lines for eleven rock units (5, 10, (23&6), 4, 8, 15, 13, 18, 2 and 20). This dynamic rock unit included around 71% of the well storage capacity and 29% of the well flow capacity. iii. Low (Tight) Flow Rock Unit (DRT-3): This rock unit has three rock units (19, 1, 24) classified based on their three very gentle close to be flat slope (Figure 7). DRT- 3, has around 10% storage capacity and 1% flow capacity.
| Well Name | Top Depth | Stratigraphic Reservoirs | NMR Zones | Dynamic Rock Units | Storage[%] | Flow[%] | Slope gradient | ||||
|---|---|---|---|---|---|---|---|---|---|---|---|
| Sapp hire-1 | 2533.35 | Shale Above Sapphire-50 Sand | Zone 1 | DRT-3 | 1.31 | 0.09 | 0.07 | ||||
| 2613.51 | Zone 2 | DRT-2 | 28.85 | 7.18 | 0.25 | ||||||
| 2663.46 | Sapphire-50 Sand | Zone 3 | DRT-1 | 2.07 | 3.9 | 1.88 | |||||
| 2667.93 | Zone 4 | DRT-2 | 2.58 | 2.88 | 1.12 | ||||||
| 2674.03 | Zone 5 | 6.4 | 3.5 | 0.55 | |||||||
| 2704.2 | Sapphire-60 Sand | Zone 7 | DRT-1 | 0.71 | 3.91 | 5.51 | |||||
| 2706.32 | Zone 8 | DRT-2 | 10.33 | 5.65 | 0.55 | ||||||
| 2733.53 | Sapphire -70 Sand | Zone 9 | DRT-1 | 1.49 | 10.04 | 6.74 | |||||
| 2740.05 | Zone 10 | DRT-2 | 1.55 | 2.39 | 1.54 | ||||||
| 2744.11 | Zone 11 | DRT-1 | 1.13 | 6.4 | 5.66 | ||||||
| 2746.57 | Zone 12 | 1.87 | 0.45 | 0.24 | |||||||
| 2757.77 | Sapphire-75 Sand | Zone 13 | DRT-2 | 1.36 | 3.92 | 2.88 | |||||
| 2760.61 | Zone 14 | DRT-1 | 7.89 | 2.34 | 0.3 | ||||||
| 2789.52 | Sapphire-80 Sand | Zone 15 | DRT-2 | 9.06 | 25.02 | 2.76 | |||||
| 2814.83 | Zone 17 | DRT-1 | 4.27 | 1.35 | 0.32 | ||||||
| 2827.02 | Shale Below Sapphire-80 sand | Zone 18 | DRT-2 | 0.59 | 1.86 | 3.15 | |||||
| 2827.93 | Zone 19 | DRT-3 | 4.23 | 0.22 | 0.05 | ||||||
| 2845.31 | Zone 20 | DRT-2 | 1.3 | 2.24 | 1.72 | ||||||
| 2849.41 | Zone 21 | DRT-1 | 0.6 | 2.78 | 4.63 | ||||||
| 2850.41 | Zone 22 | 1.77 | 2.29 | 1.29 | |||||||
| 2856.89 | Zone 23 | DRT-2 | 2.94 | 0.49 | 0.17 |
Table 1: Sapphire Reservoir Classification Based on NMR Storage and Flow Capacities Figure 7: Modified Lorenz Cross Plot for Sapp
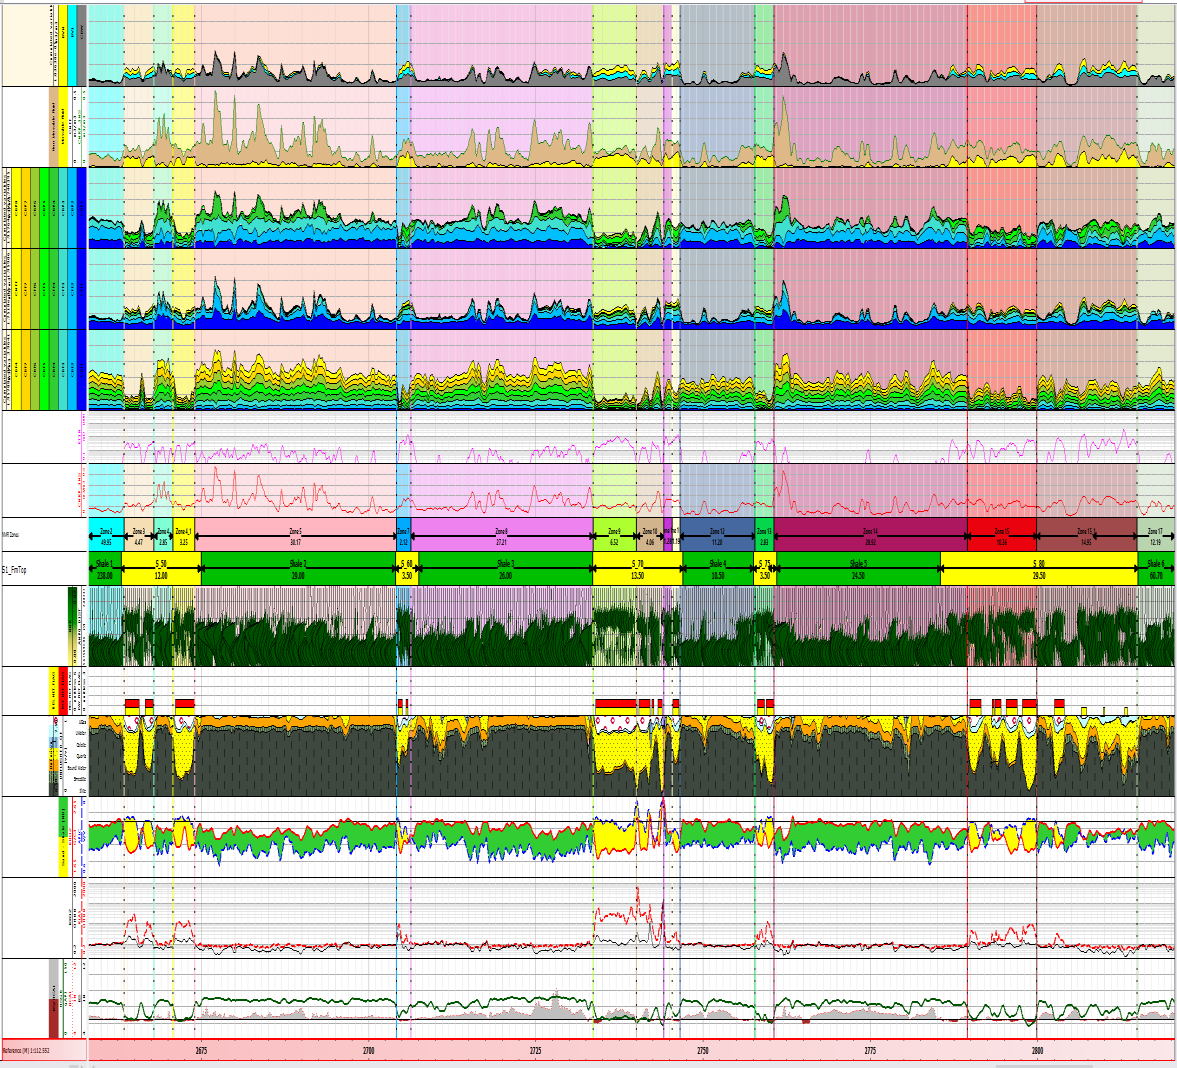
The integrated detailed NMR analysis along with Multimineral model based on conventional logging tool is shown in (Figure 9), this figure includes 16 tracks as the following:- 1) Reference Depth in MD 2) Gr and Caliper 3) Resistivity Curves 4) Density & Neutron. 5) Multimineral & Formation Fluid Saturation Model based on conventional logs. 6) Multimineral Model Net (Yellow Shading) and Net Pay Flags (Reg Shading). 7) T2 Amplitude distribution
8) Stratigraphical Zonation for Sapphire Reservoirs. 9) NMR zonation for Sapphire Reservoirs. 10) NMR Effective Porosity. 11) NMR Permeability. 12) NMR Bound Fluids. 13) NMR Free Fluids. 14) NMR Bin Porosity (Indicating both of grain size and pore throat). 15) NMR Movable Fluid (Yellow Shading) & NMR Non Movable Fluid (Brown Shading) 16) NMR Formation Fluid Characterization, CBW (Gray Shading), BVI (Blue Shading) and BVM (Yellow Shading).
Conclusion
The paper presents first applications of non- radioactive Nuclear Magnetic Resonance technology to characterize the pliocence sapphire sand reservoirs in the West Delat Deep Marine (WDDM) concession. Magnetic Resonance data, acquired in Sapphire-1 Well in Dual Wait Time mode, provided direct measurement of porosity and was processed to derive permeability, saturation and grain size distribution (Figure 8). The results were used to calculate porosity and estimate permeability to identify reservoir rock types. The measured Magnetic Resonance data has been successfully used for the reservoir characterization by identifying both the rock types and dynamic flow zones. Magnetic Resonance processing and interpretation resulted in the identification of three rock types, porosity and permeability calculations besides the estimation of their storage and flow capacities. The rock type (1) showed the best reservoir quality and the rock type (2) showed moderate reservoir quality while Rock type (3) is non-reservoir. Results such as lithology rock typing, fluid typing, porosity partitioning lead to accurate estimation of fluid saturation index, porosity and permeability index which helped in the assessing the reservoir production potential.
References
-
Sapphire-1 End of Well Report (2000) West Delta Deep Marine Concession, Rashid Petroleum Company, Egypt.
-
Cannon ED, Minh CC, RL Kleinberg (1998) Quantitative NMR interpretation. Society of Petroleum Engineers, SPE Annual Technical Conference and Exhibition, New Orleans, USA.
-
Reda A, Hashem A (2009) method for accurate prediction of high resolution saturation, permeability and porosity from resistivity imaging calibrated to nuclear magnetic resonance and reservoir description tool data for improved reservoir evaluation, the SPE Middle East Oil Show Conference.
-
Shalaby MR, Abu Shady AN, Takano O (2007) NMR Logging tools providing better answers for hydrocarbon bearing reservoir, North Western Desert, Egypt. Journal of Japanese association for petroleum technology 72(1): 121-129.
-
Coman R, Tietjen H, Thern H, Blanz M, Christensen SA (2015) Improved NMR Logging Approach to Simultaneously Determine Porosity, T2 and T1. Society of petroleum Engineers, SPE Annual Technical Conference and Exhibition, Houston, Texas, USA.
-
Kenyon WE (1997) Petrophysical principles of applications of NMR logging. Society of Petrophysicists and Well-Log Analysts, The Log Analyst 38(2): 21-43.
-
Halliburton (1999) NMR logging principles and applications.
-
Gunter GW, Finneran JM, Hartmann DJ, Miller JD (1997) Early Determination of Reservoir Flow Units using an Integrated Petrophysical Method. Society of Petroleum Engineers, SPE Annual Technical Conference, San Antonio, Texas, pp: 373-380.
- Nigeria’s Vulnerability in the Face of Global Energy Policy
- A Simulation Study of Investigation of Optimum Oil Production Performance by Applying Various Gas Injection Methods in Oil Reservoir
- Characterization of Permo-Triassic Reservoirs through Thermal Maturity Assessment of Westphalian Source Rocks in the Cheshire Basin
- Influence of Microwax on the Rheological and Thermal Behaviour of a Wax Crude Oil
- Real-Time Monitoring and Performance Optimization of Steam Injection in Heavy Oil Reservoirs Using Fiber Optic Sensing and Integrated Predictive Simulation Models
- Rapid On-Site Determination of the Total Petroleum Hydrocarbon Content of Soils by Handheld Fourier Transform Near-Infrared Spectroscopy: Development of a Global, Site- and Scanner- Independent Calibration Model