Polymer Injection as a Possible EOR Method for a Fractured Granite Basement Reservoir in the Cuu Long Basin, Vietnam
During the last 25 years more than 85% of Vietnam oil production have come from the fractured granite basement (FGB) reservoirs in the Cuu Long basin, located in the southern offshore of Vietnam. Among all the discovered oil fields the White Tiger is the biggest one that was discovered in 1974 and put on production in 1986. Since then, approximately more than 200 million tons of oil, has been produced from this field, whose life has started the declining phase since 2002, and because of this enhanced oil recovery (EOR) needs to be considered, including polymer injection to enhance sweep and displacement efficiency of water flooding in fractured reservoirs. In this paper, results of a comprehensive study including polymer testing, core injection and numerical simulation by ECLIPSE with different polymer injection for a model of fractured granite basement reservoir of the White Tiger field are presented. For a locally available biochemical polymer two properties, i.e., heat resistance and screen factor, were tested a high range of temperature of 130oC to 150oC typical for the deep fractured basement of the White Tiger field. The results of the polymer injection and EOR tests on the core samples in the laboratory showed that for the White Tiger basement conditions EOR using the existing biochemical polymers can reach only 4% of in-place oil reserves, whereas this number is normally 8% in the world. Reservoir simulations by ECLIPSE were done to evaluate the effect of polymer flooding into the fractured basement of the White Tiger field and the obtained results showed that polymer injection could give good sweep efficiency and a considerably more amount of oil can be expected from the injection of polymer comparing to an injection of water alone.
Introduction
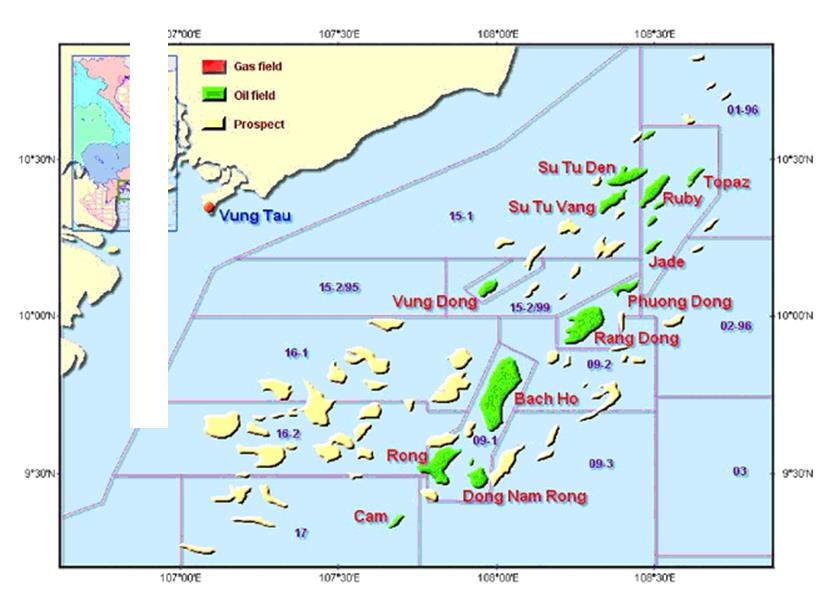
The White Tiger field, located in block 09.1, on the continental shelf of Vietnam, 120 kilometers South-East of Vung Tau city Figure 1, was discovered in 1974 by an ExonnMobil exploratory well. The White Tiger field has an area of about 130 km2 with a water depth of about 50 m. The main target reservoirs are Lower Miocene sandstone, Upper Oligocene, Lower Oligocene and the fractured granite basement. Original oil in place (OOIP) from this field is estimated of about 650 million tonnes of oil. The crude oil produced from the fractured basement is accounted for about 90% of the total cumulative oil produced from the whole White Tiger field. The field life has started to be in the declining phase since 2002 and EOR was suggested to help maintain the field. Water flooding has been applied and contributed substantially to the current production and reserves. But, it has faced many difficulties, including the low sweep efficiency due to heterogeneity permeability in fractured basement. Because of uncontrolled mobility in water flooding, water breakthrough had occurred mainly in fractures, causing early flooding in the producer well, leaving behind the un swept oil in the low-permeability zones. Consequently, one may think of injecting different agents into the reservoir to obtain a higher sweep efficiency. The objective of polymer flooding is to control water mobility inside oil reservoirs to ensure high oil recovery factors and optimization of polymer EOR process is as important as polymer testing and EOR simulation [1]. There are some screening criteria for this White Tiger field due to the characteristics of reservoir such as depth, temperature, pressure, fluid, clastic rock or basement rock, etc. As a matter of fact, Polymer injection has not been much studied and practiced in Vietnam. In the White Tiger field, polymer injection was selected as an EOR method based on the characteristics of reservoir and polymer properties. The main objectives of this study include the followings, i.e., i) To perform laboratory testing of Polymer properties such as heat resistance and resistance factor (screen factor) for different polymer concentrations and temperatures; ii) To conduct core flooding experiments and EOR testing on core samples; iii) To do reservoir simulation by ECLIPSE software to evaluate the effect of polymer flooding into the fractured basement of White Tiger field in the equivalent field conditions.
Polymer Testing and Results
XCD Polymer manufactured by Global Drilling Fluid and Chemical Limited is a high molecular weight Xanthum Gum biopolymer. It is used to viscosify water based temperature range of the White Tiger basement from 145°C to 150°C. The polymer might be effective in oil recovery processes because it can increase the viscosity of water, and in some cases can cause an additional resistance to water flow [2]. Two polymer properties, i.e., heat resistance and screen factor, were tested for different polymer concentrations (i.e., 600, 1200, 1800, 2400, 3000 ppm) with both freshwater and saltwater at 130°C and 150°C, respectively.
Heat Resistance of Polymer
The saltwater, in which polymer was dissolved, was made by two third of distilled water with 0.4g of Na2CO3 and one third of distilled water with 40g NaCl and 1/2g CaCl2. One needed to stir regularly two solutions in 40-50 minutes to dissolve completely, after that mixed them up and continued to stir in 15-20 minutes to obtain the polymer solution in the saltwater medium. Viscosity of polymer solution at different concentrations was measured using Fann Viscometer. The samples of polymer solution had been heated continuously by the Autoclave apparatus for 7 to 8 hours, they were left to cool down and then poured out. Viscosity was measured again by Fann Viscometer with capillary pipe of φ = 0.73 millimeters.
0 500 1000 1500 2000 2500 3000 3500 Concentration (ppm) Figure 2: Results of heat resistance testing for different polymer solutions. The results of polymer heat resistance testing at various concentration after heating up XCD (ADF) polymer solution to 150°C are plotted in Figure 2, which shows that the plastic viscosity increases with the increasing polymer concentration until 1,800 ppm, after which the curves get leveled off.
Screen Factor of Polymer
The viscosity and resistance factor of the injected fluid (water or polymer solution in our study) control its mobility. In practice, one often measures the screen factor instead of the resistance factor, as the former can be more quickly determined in the laboratory and can be correlated to the later. The screen factor is defined as the ratio between polymer flow time and water flow time through a screen viscometer [3]. The lower part of testing apparatus consists of a pipe with a diameter of 6.5 mm, a porous medium made up by five layers of steel screen of 0.1 mm superimposing one another. The flowing time of 40 ml distilled water from level 1 to level 2 is about 8 to10 seconds. The testing with a funnel is setup to measure the viscosity of Marsh drilling fluid. An amount of 250 ml of water was poured into the apparatus and the flowing time of 130ml distilled water was measured as 10 seconds. After heating, the flowing time of XCD solution is measured for the same water at the different concentration.
Polymer Injection Tests on Core Samples
Polymer Flooding Test
The experiment was carried out using the setup shown in Figure 4 following the steps recommended by Shah DS, et al [3].
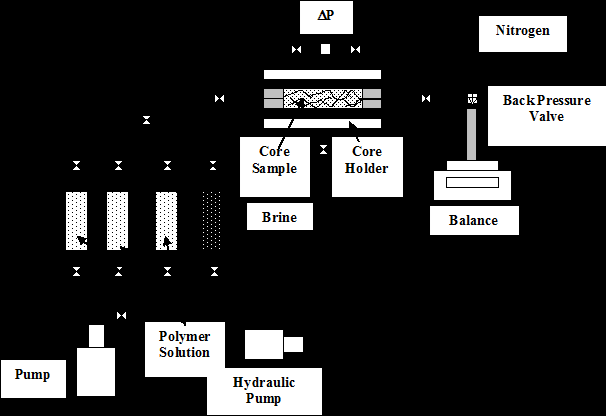
Figure 5: Viscosity of polymer solutions versus temperature. The experimental model was constructed using the fractured core samples taken from the White Tiger basement to reduce the effect of the secondary minerals on polymer and water injection [4]. For preparation of polymer solution, first Na2CO3 with concentration of 0.4g/l was dissolved in the freshwater with pH of 10.47. Then, polymer “XCD” in dry powdered form was dissolved Figure 6: Mobility reduction of polymer solution. Figure 6 shows the results of mobility reduction of polymer solution versus the injected volume PV for three concentration of 600, 1200 and 1800 ppm, respectively. Up to 4.5 PV the higher concentration the higher polymer mobility reduction rate, after that the difference between 1,200 and 1,800 ppm concentration are small. In addition, testing of the water permeability of the basement rock indicated that it was not recovered to its initial value. The permeability reduction depends on the concentration of injected polymer. The higher concentration of polymer, the larger adsorption and mechanical entrapment of the polymer in the White Tiger basement rock and the higher permeability reduction.
Enhanced Oil Recovery Test
Experimental model was prepared similar to the polymer injection test on the fractured core samples taken from the White Tiger basement [5]. For fluid preparation, Brine was filtered to reject the waste residues, impurities; distilled water and Polymer solution of XCD 1200 ppm were used; Reservoir oil model was made of the crude oil from the White Tiger fractured granite basement reservoir, gas was separated out, and combined with 20% of kerosene to give a viscosity of reservoir oil (μ = 0.46 cP at T = 130°C). The following two injection tests were conducted, numbered as Tests No. 1 and 2 in Table 1, and described as follows: Test No. 1 (Polymer was injected after the brine injection): the brine was injected from the inlet of model to evaluate the oil recovery from sample due to the quantity of water injection. The parameters of oil recovery were evaluated at the periods with and without water flooding. The results of brine injection were used to compare with the polymer injection method; and ii) Test No. 2 (Polymer injection was carried out from the beginning): after the quantity of injected polymer reached 0.4 PV, the buffer of the freshwater of 0.2 PV was injected alternatively, the brine was then used as the last pushing fluid. The testing results are presented in the Table 1 with the appropriate equivalent factors. The first testing is the oil recovery from the model by brine injection after water flooding reached 100% of the production, the model is injected by 0.2 PV polymer slug size. The result showed that no more oil is recovered from the sample and indicated clearly on how important is the time to start polymer injection. When the water flooding reached at high degree, the polymer injection would not be effective for EOR. As seen in the Table 1, for the case of polymer injection (Test no. 2, at PV = 6.13) oil recovery is43.7 %, which is not higher than oil recovery equal to 44.9%in the case of water injection (Test no. 1, at PV = 6.63), which suggested that the pushing of oil by polymer has not caused the reduction in oil residual saturation in the White Tiger basement reservoir or in other words the oil recovery could not be improved. However, the mobility ratio (M) has improved from the average value of 1.66 in the case of the water injection to 1.33 in the case of the polymer injection, which means that the factor of the volumetric sweep efficiency can increase significantly in the macroscopic conditions of the reservoir.
| Test no. | Equivalent Factors | Enhanced recovery | Mobility Ratio, M | Remark | ||||||
|---|---|---|---|---|---|---|---|---|---|---|
| for Experiment | ||||||||||
| Nc 10-6 | N RL | Ng | PV | Oil Recovery, % | Water Cut, % | |||||
| 1 | 2.1 | 1.2 | 0.73 | 0 0.38 | 0 24.4 | 0 0 | Starting inject brine |
Table 1: The results of EOR testing by polymer injection.
| 0.48 0.83 1.53 4.53 4.73 4.94 6.13 | 33.4 40.6 43.6 44.9 44.9 44.9 44.9 | 0 84.8 96.5 99.5 100 100 100 | 1.27 1.96 1.75 | Water appear Inject 0.2PV polymer solution XCD Inject buffer solution 0.2 PV Starting inject brine to push | ||||
|---|---|---|---|---|---|---|---|---|
| 2 | 2.4 | 1.35 | 0.65 | 0 0.35 0.40 0.6 0.81 1.44 2.39 3.36 6.63 | 0 23.4 25.4 29.4 32.3 36.3 39.5 40.9 43.7 | 0 0 77.2 82.5 90.1 95.0 97.8 98.8 100 | 0.55 1.26 1.1 1.3 1.56 1.76 1.56 1.26 | Start inject 0.4PV polymer solution XCD Water appear Inject buffer solution 0.2 PV Starting inject brine to push |
Table 2: The results of EOR testing by polymer injection.
Reservoir Simulation
Building up ECLIPSE Model
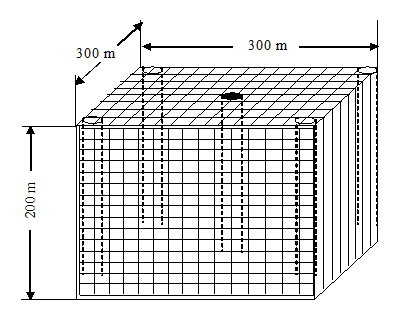
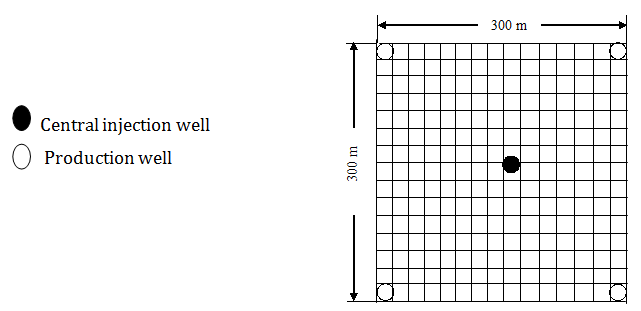
Laboratory experiments permit the study of oil recovery mechanism in one or two dimensions only. To scale-up to three dimensions simulation one needs to a numerical simulator, which would also allow incorporation of reservoir heterogeneities. An ECLIPE simulation model with a confined well was constructed. The simulation pertained to a confined five-spot of 300 m x 300 m x 200m, the symmetry element of a five-spot being represented by a grid of 15 x 15 x 20 blocks (Figures 8 & 9).
Input Data for Basic Case without Polymer Injection
This model was constructed using the parameters of the White Tiger basement as follows: Grid Data: Geometry: The depth of the top of the fractured basement was 4,300 meters; the depth to the bottom of basement is
4500 meters. Therefore, the reservoir thickness was 200 meters. Distance between production wells and an injection well was about 200 meters, thus we could divide a pattern for injection with distance between production wells being around 283 meters. So, we can get a dimension of model is X x Y x Z = 300 m x 300 m x 200 m. We have used a confined five-spot pattern model for polymer flooding are four production wells and one injection well. For the model grid, dimension of a block cell is DX x DY x DZ = 15 x 15 x 20. General parameters: Initial pressure: 5651 psi = 384, 42 (bar) Formation volume factor: 1.1 (res bbl/STB) Porosity: 1 to 10 (%) Permeability of matrix: 8.2 (mD) Permeability of fracture: 200 (mD) to 1200 (mD) Water saturation: 0.34 Well radius: 0.328 (ft) or 0.1 (m) Skin: 0 The other input parameters are given in Table 2 to 8. Input data for ECLIPSE were prepared in free format using a keyword system. Any standard editor may be used to prepare the input file. Alternatively, ECLIPSE Office may be used to prepare data interactively through panels, and submit runs [2, 6].
| Reference pressure | 385 | Bar |
|---|---|---|
| Rock compressibility | 4E-7 | 1/bar |
Table 3: Rock properties (ROCK).
| Reference pressure (Pref) | 385 | Bar |
|---|---|---|
| Water FVF at Pref | 1.02 | rm3/sm3 |
| Water compressibility | 5E-7 | /bar |
| Water viscosity at Pref | 0.25 | Cp |
Table 4: Water PVT Properties (PVTW).
| Oil API gravity | 39 |
|---|---|
| Water specific gravity (pure water) | 1.03 |
| Gas gravity (air) | 0.87 |
Table 5: Fluid gravities at surface conditions (GRAVITY).
| Row | Pressure (bar) | FVF (rm3/sm3) | Viscosity (cp) | ||||||||
|---|---|---|---|---|---|---|---|---|---|---|---|
| 1 | 1 | 0.14331 | 0.01283 | ||||||||
| 2 | 10 | 0.08008 | 0.01307 | ||||||||
| 3 | 50 | 0.02705 | 0.01416 | ||||||||
| 4 | 100 | 0.0148 | 0.01566 | ||||||||
| 5 | 120 | 0.01253 | 0.0163 | ||||||||
| 6 | 140 | 0.01086 | 0.01697 | ||||||||
| 7 | 160 | 0.00959 | 0.01767 | ||||||||
| 8 | 180 | 0.00858 | 0.01839 | ||||||||
| 9 | 200 | 0.00776 | 0.01915 | ||||||||
| 10 | 220 | 0.00709 | 0.01994 | ||||||||
| 11 | 230 | 0.0068 | 0.02034 | ||||||||
| 12 | 240 | 0.00652 | 0.02076 | ||||||||
| 13 | 260 | 0.00604 | 0.02161 | ||||||||
| 14 | 310 | 0.0051 | 0.02389 | ||||||||
| 15 | 360 | 0.00441 | 0.02642 | ||||||||
| 16 | 410 | 0.00389 | 0.02922 | ||||||||
| 17 | 460 | 0.00347 | 0.03231 | ||||||||
| 18 | 510 | 0.00314 | 0.03573 | ||||||||
| 19 | 560 | 0.00286 | 0.03951 | ||||||||
| 20 | 610 | 0.00263 | 0.0437 | ||||||||
| 21 | 660 | 0.00244 | 0.04832 |
Table 6: Dry gas PVT properties (no vaporised oil) PVDG.
| Row | Pbub (bar) | Rs (sm3/sm3) | FVF (rm3/sm3) | Viscosity (cp) | Compressibility (/bar) | ||||||||||
|---|---|---|---|---|---|---|---|---|---|---|---|---|---|---|---|
| 1 | 1 | 1.44 | 1.20319 | 0.76723 | 0.017058 | ||||||||||
| 2 | 10 | 7.55 | 1.21676 | 0.74365 | 0.017058 | ||||||||||
| 3 | 50 | 34.69 | 1.27704 | 0.64731 | 0.002686 | ||||||||||
| 4 | 100 | 68.61 | 1.35239 | 0.54424 | 0.000926 | ||||||||||
| 5 | 120 | 82.18 | 1.38253 | 0.50777 | 0.000609 | ||||||||||
| 6 | 140 | 95.75 | 1.41267 | 0.47374 | 0.000515 | ||||||||||
| 7 | 160 | 109.32 | 1.44281 | 0.44199 | 0.000447 | ||||||||||
| 8 | 180 | 122.89 | 1.47295 | 0.41236 | 0.000393 | ||||||||||
| 9 | 200 | 136.46 | 1.50309 | 0.38473 | 0.000352 | ||||||||||
| 10 | 220 | 150.03 | 1.53323 | 0.35894 | 0.000318 | ||||||||||
| 11 | 230 | 156.82 | 1.5483 | 0.34671 | 0.000297 | ||||||||||
| 12 | 240 | 163.6 | 1.56337 | 0.33489 | 0.000284 | ||||||||||
| 13 | 260 | 177.17 | 1.59351 | 0.31244 | 0.000267 | ||||||||||
| 14 | 310 | 211.1 | 1.66886 | 0.26269 | 0.000235 | ||||||||||
| 15 | 360 | 245.02 | 1.74421 | 0.22087 | 0.0002 | ||||||||||
| 16 | 410 | 278.94 | 1.81956 | 0.1857 | 0.000174 | ||||||||||
| 17 | 460 | 312.87 | 1.89491 | 0.15613 | 0.000154 | ||||||||||
| 18 | 510 | 346.79 | 1.97026 | 0.13127 | 0.000138 | ||||||||||
| 19 | 560 | 380.72 | 2.04561 | 0.11037 | 0.000125 | ||||||||||
| 20 | 610 | 414.64 | 2.12096 | 0.0928 | 0.000114 | ||||||||||
| 21 | 660 | 448.57 | 2.19631 | 0.07802 | 0.000105 |
Table 7: Live oil PVT properties (dissolved gas) PVCO.
| Ow | Sg | Krg | Kro | Pc (bar) | ||||||||
|---|---|---|---|---|---|---|---|---|---|---|---|---|
| 1 | 0 | 0 | 1 | 0 | ||||||||
| 2 | 0.07 | 0.038 | 0.579 | 0 | ||||||||
| 3 | 0.096 | 0.047 | 0.263 | 0 | ||||||||
| 4 | 0.129 | 0.074 | 0.086 | 0 | ||||||||
| 5 | 0.152 | 0.107 | 0.04 | 0 | ||||||||
| 6 | 0.17 | 0.153 | 0.024 | 0 | ||||||||
| 7 | 0.192 | 0.185 | 0 | 0 |
Table 8: Gas/oil saturation functions (SGOF).
| Row | Sw | Krw | Kro | P | c (bar | |||||||
|---|---|---|---|---|---|---|---|---|---|---|---|---|
| 1 | 0.15 | 0 | 1 | 0 | ||||||||
| 2 | 0.19 | 0 | 0.8359 | 0 | ||||||||
| 3 | 0.211 | 0.0102 | 0.7264 | 0 | ||||||||
| 4 | 0.271 | 0.0361 | 0.5112 | 0 | ||||||||
| 5 | 0.332 | 0.0767 | 0.3468 | 0 | ||||||||
| 6 | 0.392 | 0.1309 | 0.2255 | 0 | ||||||||
| 7 | 0.453 | 0.1979 | 0.1397 | 0 | ||||||||
| 8 | 0.513 | 0.2764 | 0.0819 | 0 | ||||||||
| 9 | 0.574 | 0.3655 | 0.0444 | 0 | ||||||||
| 10 | 0.634 | 0.4642 | 0.0196 | 0 | ||||||||
| 11 | 0.695 | 0.5714 | 0 | 0 |
Table 10: Water/Oil Saturation Functions (SWOF).
Input Data for Different Simulation Scenarios of Polymer Injection
Based on the basic model, the parameters of polymer were employed as input data for different scenarios of polymer injection. The parameters of PVT and SCAL properties for polymer are also presented in Tables 9 to 13.
| Row | Cp (kg/m3) | Fm |
|---|---|---|
| 1 | 0 | 1 |
| 2 | 0.998403 | 48 |
| 3 | 1.5004571 | 100 |
Table 9: Polymer Solution Viscosity Function (PLYVISC).
| Row | Vw (m/day) | Fr | |||||
|---|---|---|---|---|---|---|---|
| 1 | 0 | 1 | |||||
| 2 | 1 | 0.8 | |||||
| 3 | 3 | 0.75 | |||||
| 4 | 6 | 0.7 | |||||
| 5 | 10 | 0.68 |
Table 11: Polymer Shear Thinning Data (POLYSHEAR).
Polymer concentration 0.6 kg/m3 Salt concentration 300 kg/m3 Table 11: Polymer/Salt concentrations (PLYMAX).
| Dead pore space | 0.14 |
|---|---|
| Residual resistance factor | 1.29 |
| Rock mass density (kg/rm3) | 2800 |
| Adsorption index | 1 |
| Maximum polymer adsorption value (Ug/g) | 30 |
Table 12: Polymer Rock Properties (PLYROCK).
| Row | Plc (kg/m3) | Pad (g/g) | ||||||
|---|---|---|---|---|---|---|---|---|
| 1 | 0 | 0 | ||||||
| 2 | 0.998403 | 30 | ||||||
| 3 | 1.996806 | 30 |
Table 13: Polymer Adsorption Functions (PLYADS).
Reservoir Simulation Running
Reservoir simulations for the White Tiger basement by ECLIPSE software had been run for a continuous period from 1985 to2020 with one-month time steps. The main simulation scenarios are described in the following:
Basic Case of Water Injection without Polymer
In this case, water injection rate was 200 (m3/day), oil production rate was 50 (m3/day/well) from 1986 to 2020. However, for the period from 2005 to 2010, water injection rate was increased up to 400 (m3/day), oil production rate was up to 100 (m3/day/well). ECLIPSE has a comprehensive set of options for controlling individual wells. Producers can operate at a specified value of the oil rate, water rate, liquid rate, gas rate, bottom hole pressure and tubing head pressure. Injection wells have a similar set of controls. Target or limiting values can be supplied for the injection rate at surface conditions, the injection rate at reservoir conditions, the bottom hole pressure and the tubing head pressure. Production data can also be extracted from existing ECLIPSE models. The program has advanced graphic display features which simplify the editing, validating and averaging of production data. Time steps on which rates are averaged are based on a user defined combination of calendar periods and reservoir events such as well completions, shut-ins and simulations. This ECLIPSE simulator has made runs in that time steps were set of one month per step.
Polymer Injection with Different Concentrations
Theses simulations continue from the basic case. At the beginning polymer is injected into the fractured basement from 2005 to 2010 at the concentrations that were tested in the laboratory experiments (600, 1200, 1800 ppm). Later on, simulations with other polymer concentrations were done to evaluate the more detailed effect of polymer flooding into the fractured basement of the White Tiger field for EOR. In total, 7 scenarios were simulated for the following polymer concentrations: 500 ppm, 600 ppm, 900 ppm, 1200 ppm, 1500 ppm, 1800 ppm and 2000 ppm. The results of simulation could show the efficiency of polymer flooding on EOR compared to the basic case as well as the optimal polymer injection.
Results and Discussion of Numerical Reservoir Simulation
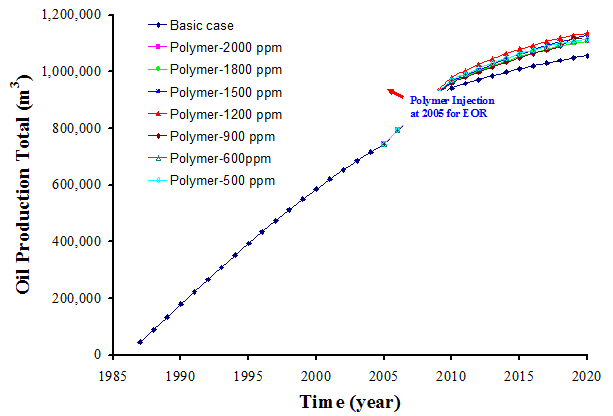
The simulation results of the basic case for the White Tiger basement on the performance of water cut and oil production versus time were presented in Figures 10 to 12. The water cut of reservoir basement increased gradually and started increasing strongly in 2000, while the oil production has also increased until 2000, but it has been declining very quickly after 2000. In 2005, the water cut of basement is up to 50 %, while the average of oil production rate is 126.28 m3/day and oil production total is 793,423 m3. If we do not apply any tertiary methods for EOR, the water cut of the White Tiger basement will increase up to 87 %, while the oil production rate will decrease down to 23.59 m3/day and the total oil production will only be of 1,057,460 m3 in 2020. The results of the basic case simulation are compared with those of other cases of different polymer concentration injections as shown in Figures 13 and 14.
![Figure 5: Viscosity of polymer solutions versus temperature. The experimental model was constructed using the fractured core samples taken from the White Tiger basement to reduce the effect of the secondary minerals on polymer and water injection [4]. For preparation of polymer solution, first Na2CO3 with concentration of 0.4g/l was dissolved in the freshwater with pH of 10.47. Then, polymer “XCD” in dry powdered form was dissolved Figure 6: Mobility reduction of polymer solution. Figure 6 shows the results of mobility reduction of polymer solution versus the injected volume PV for three concentration of 600, 1200 and 1800 ppm, respectively. Up to 4.5 PV the higher concentration the higher polymer mobility reduction rate, after that the difference between 1,200 and 1,800 ppm concentration are small. In addition, testing of the water permeability of the basement rock indicated that it was not recovered to its initial value. The permeability reduction depends on the concentration of injected polymer. The higher concentration of polymer, the larger adsorption and mechanical entrapment of the polymer in the White Tiger basement rock and the higher permeability reduction.](/fulltextimages/1259/fig_5.png)
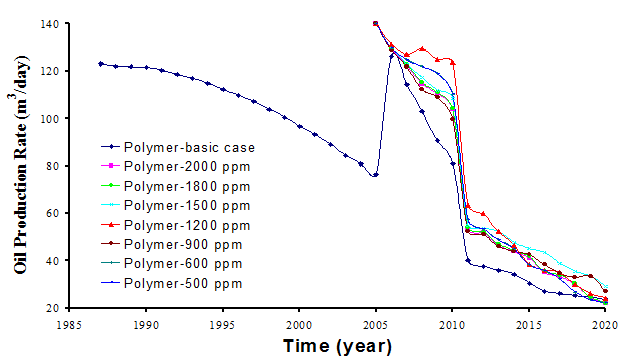
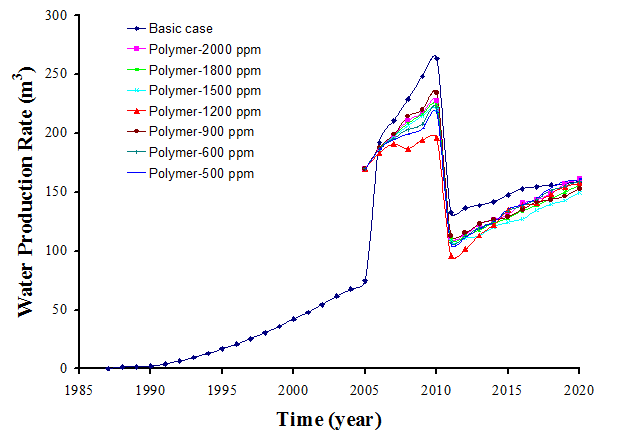
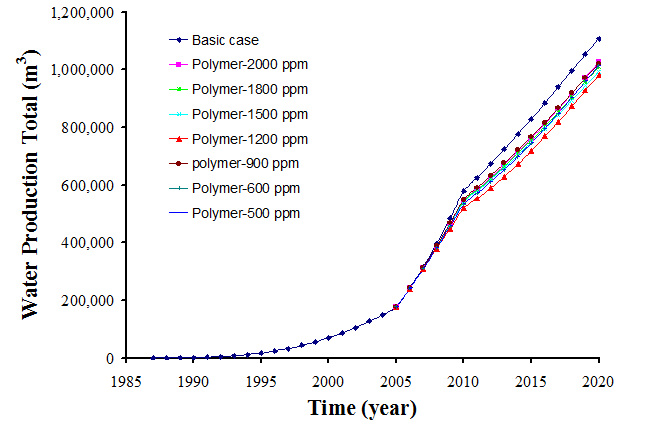
Figure 11: Simulated field oil production rate. For polymer flooding, the reservoir simulations were run for different polymer concentrations from 500, 600, 900, 1200, 1500, 1800 to 2000 ppm for the period from 2005 to 2010, with an optimized polymer slug size as 0.2 PV. The results obtained are better than those by the basic case as presented in Figures 10 to 14. The curves of water cut and oil recovery versus time from 2005 to 2020 are improved very clearly. The average of water cut in the White Tiger basement has decreased clearly from 76.3 % in the basic case down to 71.1; 70.6; 71.2; 69.1; 69.4; 71.3 and 71.8 %, while the average of oil production rates and oil production totals also have increased from 56.08 m3/day in the basic case up to 70.5; 70.6; 69.6; 74.2; 72.8; 69.2 and 68.8 m3/day; and from 1,057,460 m3 in the basic case up to 1,116,630; 1,116,632; 1,111,350; 1,137,460; 1,129,270; 1,108,416 and 1,108,410 m3 in the scenarios of polymer injections of 500, 600, 900, 1200, 1500, 1800 and 2000 ppm, respectively. The field water production rate and field water production total also decreased due to polymer flooding since 2005 (as shown in Figures 13 and 14). Thus, the effect of EOR is seen as an increase in flow rate of injection and polymer flooding.
Conclusions
- A total of 17 tests on XCD biochemical polymers were carried out with different concentrations. These polymers are available in Vietnam's market and testing results have shown that the effectiveness of mobility reduction is limited due to severe conditions of the White Tiger basement, such as high temperature of 1500C, caverns, mechanical entrapment, and polymer absorption by secondary minerals. Due to these problems, existing polymers must be used with high concentration of about 1200 ppm, which would reduce the economic benefit of using polymers for injection.
- The results of the polymer injection and EOR tests on the core samples in the laboratory showed that the mobility of polymer solution has reduced at the different concentrations versus injected volume PV. Based on some preliminary calculations, EOR for the White Tiger basement by using the existing biochemical polymers can reach only 4% of in-place oil reserves, whereas this number is normally 8% in the world.
- The results of the above-mentioned experiments were further used for reservoir simulation by ECLIPSE software to evaluate the effect of polymer flooding into the fractured basement of the White Tiger field.
The results of reservoir simulation showed that, in some scenarios, polymer injection could give a good sweep efficiency. The curves of oil recovery and water cut also indicated that for the White Tiger basement a considerably more amount of oil can be expected from the injection of polymer comparing to an injection of water alone.
4. Before implementation of a polymer flooding project on a full scale field test, it is necessary to do more computer simulation for polymer flooding to optimize production parameters for an overall evaluation on the economic effectiveness of polymer flooding compared with that of normal water injection.
References
-
JanigaD, Czarnota R, Stopa J, Wojnarowski P, Kosowski P (2017) Performance of nature inspired optimization algorithms for polymer Enhanced Oil Recovery process. Journal of Petroleum Science and Engineering 154: 354-366.
-
Schlumberger (2003) ECLIPSE Reference Manual. Reservoir Simulation Software, GeoQuest, Schlumberger.
-
Shah DO, Schechter RS (1977) Improved Oil Recovery by Surfactant and Polymer Flooding. Academic Press, USA.
-
Trung NH (1997) Study on the Application of Polymer Flooding into Fractured Basement of Wells on the Continental Shelf of Vietnam for Enhanced Oil Recovery. Vietnam Petroleum Institute, Hanoi, Vietnam.
-
Tuan PA (2001) Physical Collector and Hydrodynamics Characteristics of Source Rocks Having Complicated Structure in Conditions of Pressure and Temperature Model, Vietsovpetro, D.Eng. Thesis, Hanoi University of Mining and Geology, Vietnam.
-
Schumacher MM (1980) Enhanced Oil Recovery of Residual and Heavy Oils. Noyeys Data Corporation, New Jersey, USA.
- Nigeria’s Vulnerability in the Face of Global Energy Policy
- A Simulation Study of Investigation of Optimum Oil Production Performance by Applying Various Gas Injection Methods in Oil Reservoir
- Characterization of Permo-Triassic Reservoirs through Thermal Maturity Assessment of Westphalian Source Rocks in the Cheshire Basin
- Influence of Microwax on the Rheological and Thermal Behaviour of a Wax Crude Oil
- Real-Time Monitoring and Performance Optimization of Steam Injection in Heavy Oil Reservoirs Using Fiber Optic Sensing and Integrated Predictive Simulation Models
- Rapid On-Site Determination of the Total Petroleum Hydrocarbon Content of Soils by Handheld Fourier Transform Near-Infrared Spectroscopy: Development of a Global, Site- and Scanner- Independent Calibration Model