Textural and Paleoenvironmental Characterization of the Campano-Maastrichtian Patti Sandstone, Southern Bida Basin, Northcentral Nigeria
Field and granulometric investigation of Patti Sandstone were carried out with a view towards establishing the lithological sequence, geological processes, textural characteristics and paleoenvironment of deposition of the sediments. Field study entailed basic field procedures and sedimentological descriptions which encompass physical factors such as textural parameter, composition, colour and structures; biological inference in terms of fossil content and chemical character in terms of chemical composition and post depositional diagenesis effect. Granulometric laboratory procedure includes weighing and sieving of samples with set of sieves; calculated cumulative percentages, software input of data to generate statistical parameters such as mean, standard deviation (sorting), skewness, kurtosis and ternary diagrams. Field observations show that the lower part of the outcrop section has alternation of claystone and shale; the mid-section shows coarsening-up sequence of shale, clay and sandstone facies of a retrogradational system, while the upper part is composed of intercalation of claystone and sandstone in repetitive pattern, various thicknesses and colours. The textural characteristics of the sandstone are generally coarse-fine grains, reddish to greyish in colour, rounded to subrounded and moderately to well sorted. Structurally, the outcrops are planar cross bedded, wavy laminated and concretional. Granulometric result categorized the sandstones into fine, medium and coarse grained particles; well sorted to moderately well sorted, characterized by lateral retrogradational sequence from the shoreline. The skewness varies from fine skewed, very fine skewed and symmetrical. Kurtosis values suggest multi-sourced particles deposited in marine and fluviatile paleoenvironments.
Introduction
The stratigraphic study of Bida Basin is important in terms of its biostratigraphic and lithostratigraphic implications to hydrocarbon generation and accumulation. The emphasis in this study is the evaluation of the sandstome facies of the Late Campanian to Ealy Maastrichtian Patti [1]. The area of study lies within the southern part of the Bida Basin, within Kogi State and Abuja, the Federal Capital Territory. Sandstone samples were collected from outcrops along the Lokoja-Abaji-Abuja highways (Figure 1). Bida Basin has a maximum width of about 160 km, stretches northwest- southeast for about 400 km from Kontagora in Niger State to Dekina in Kogi State where it has contact with the Anambra Basin.
Lithostratigraphic section of the Bida Basin contains conglomerate at the base which overlies the basement complex, belonging to Lokoja Formation, outcropping in many parts of the basin. The paleoenvironment of deposition of the Lokoja Formation was first described by Braide [2, 3] and later by Okosun [4].
Previous studies on Patti Formation were more on the determination of source rock potential and paleoenvironment of the shale facies using organic geochemical and paleontological techniques [5, 6, 7]. However, application of sedimentology in the evaluation of paleoenvironmental reconstruction of the Patti Formation is uncommon and not well documented. Therefore, systematic geologic mapping of the Patti Sandstone was carried out with intents toward determining textural characteristics and paleoenvironment of deposition of Patti Sandstone based on field and granulometric studies
Geologic Setting
Bida Basin is an inland basin in Nigeria located in the central part of the country geographically. The evolution of the Bida Basin was hinged on rift bounded tensional structure, formed as a result of drifting apart of South American plate from the African plate [8, 9]. Other researchers such as Wright, et al. [10], Ojo [11] and Adeniyi [12] proposed a wrench-fault tectonic model for the origin of the basin.
![Figure 1: Map showing the location of the study area [1].](/fulltextimages/8653/fig_1.png)
![Figure 2: Stratigraphy of Maastrichtian-Campanian formations in the Bida Basin correlated with the Anambra Basin; Patti Formation highlighted [1].](/fulltextimages/8653/fig_2.png)
Three lithostratigraphic formations were identified in the basin [1, 6, 13]. The lithostratigraphic section of the Bida Basin is characterized at the base by Lokoja Formation, 90–280 m thick, dated Maastrichitian-Campanian in age. This is overlain by Patti Formation, earlier dated broadly as Maastrichtian [6, 14]. The thickness of the formation varies between 70-100 m. Recently, the Patti Formation was refined and dated on the basis of assemblages of pollen and spores, dated Late Campanian to Early Maastrichtian [1]. The lowest part of the Patti Formation was dated Campanian age while substantial part of the section belongs to Early Maastrichtian; stratigraphically correlated with Mamu Formation in Anambra Basin [1] (Figure 2). The Patti Formation is overlain by Agbaja Formation which is dominantly ironstone, 5-20 m in thickness [2, 3, 15].
Methodology
Fieldwork was undertaken by ensuring that necessary materials needed for the field such as clinometer, GPS, sample bags, marker pens, topo map, hammer, chisel, masking tape, hand lens, and dilute hydrochloric acid were taken along for the exercise. The field exercise was systematically coordinated especially along major highways of Lokoja- Abaji-Abuja roads. At every oucrop visited, the location was noted with aid of the GPS while other necessary lithologic description was carried out by giving adequate consideration to the physical, biological and chemical properties of the sedimentary rock.
The physical characteristics of the outcrop description include the main composition of the rock, textural attributes such as grain size, angularity/roundness and sorting. Others include colour, sand/shale ratio and structures. The biological property noted was in terms of fossil presence while chemical characteristics include noting presence of calcite, iron, or other authigenic minerals such as glauconite, pyrite, gypsum, or other form of anhydrites [16]. Importance was the observation of accessory mineral such as biotite or muscovite, iron or carbonate presence. The chemistry of the rock took into cognizance the post depositional diagenetic effects on the sandstone and clay deposits [16]. Outcrops were logged from the bottom to the top by indicating various facies, their respective thicknesses and associated litho- characteristics. Photographs of the outcrop were taken to indicate as they appear in the field with the various geologic structures, stacking patterns and contact styles.
Granulometric analysis of the sandstone samples was carried out in the laboratory following standard laboratory procedures. The collected selected sandstone samples were spread on plain white paper, coded to indicate site location. They were spread and allowed to dry at normal room temperature while adequate separation of the sticky grains was ensured by robbing the grains in-between the palms and in-between fingers as required.
The sieves used for the grain size separation were the Impact Laboratory Test Sieves (U.S. standard sieve size) with a shaker and an amplifier. Thirteen sandstone samples were subjected to sieving mechanism using different grades of sieves in sizes of 1000, 850, 600, 425, 300, 212, 150, 75, 63µm and base pan of 2mm in order to retrieve respective weight of retained sand grains in each of them. The sieves of different sizes were stacked on one another with the finest at the bottom with attached base pan while the coarsest sieve size was at the top, covered. The disaggregated dried samples were weighed by chemical balance to 100gm; poured into the topmost sieve, covered and placed on a shaker, ready for sieve agitation at moderate frequency for about 15 minutes. After sieving the samples into sieve classes, grain assemblage in each sieve was poured, weighed and recorded. The procedure was repeated for all the thirteen samples selected for the research.
The weight percentage frequency data was subsequently converted to cumulative weight percentage. The results of the sieved samples and their analysis with the aid of software program were computed, input in the software. Sample statistics were calculated using the method of moments in Microsoft Visual Basic programming language shown in Table 4: mean, sorting (standard deviation), skewness and kurtosis. Grain size parameters were calculated arithmetically and geometrically (in microns) and logarithmically (using the phi scale) [17]. Linear interpolation is also used to calculate statistical parameters by the Folk and Ward [18] graphical method and derive physical descriptions (such as “very coarse sand” and “moderately sorted”). In terms of graphical output, the program provides graphs of the grain size distribution and cumulative distribution of the data in both metric and phi units, and displays the sample grain size on ternary diagrams.
Mean
The mean values are used to determine the average grain size of the sediment which could be classified to be very coarse, coarse, medium grained sandstone, fine or silt sized sandstone. The variation in sizes is in response to current energy whether high, medium or low. This indirectly is in relation to course of the river whether it is in upper, middle or lower course. It may as well be related to lateral variation in response to hydraulic sorting, abrasion topography and climate.
( ) Graphic Mean Mz = Ø16+Ø50+Ø84 /3
Standard Deviation (Sorting)
This is an important parameter calculated and used for the interpretation of the granulometric analysis. It is determined from the Inclusive Standard Deviation calculated from the probability curves for the samples. It is also a measure of degree of sorting of the sediment.
$$ \sigma_ {1} = \frac {\varnothing 8 4 - \varnothing 1 6}{4} + \frac {\varnothing 9 5 - \varnothing 5}{6. 6} $$
1 Ø84 Ø16
6 The Standard Deviation 1 σ measures the scatter around the mean. Therefore, it describes the transportation history of the sediment which may be dependent on factors such as source, depositional environment, distance of sediment movement away from source, rate of deposition and so on.
Sorting classification range values according to Folks [18] are given below:
0.35Ø <
= Very well sorted
$$ 0. 3 5 - 0. 5 5 \theta = $$
= Well sorted
$$ \left[ \begin{array}{l l} 0. 5 0 - 0. 7 1 \emptyset \\ 0. 7 1 - 0. 0 0 \end{array} \right] $$
= Moderately well sorted
$$ 0. 7 1 - 1. 0 0 \varnothing $$
= Moderately sorted
1.00-2.00 = Poorly sorted
2.0 4.0Ø = Very poorly sorted However, sorting achieved by sediments is dependent on source of sediment, energy of deposition environment, density of material, and differential rate of deposition.
Skewness
This is another statistical parameter calculated by the program. The essence of skewness is to serve as a measure of symmetry in the scatter of distribution. It can as well be described as the degree of lopsidedness of the curve. Therefore, Inclusive Graphic Skewness was calculated:
( ) ( ) 1
Ø16 + Ø84 - 2Ø50
$$ \mathrm {S K} _ {1} = \frac {\varnothing 1 6 + \varnothing 8 4 - 2 \varnothing 5 0}{2 \left(\varnothing 8 4 - \varnothing 1 6\right)} + \frac {\varnothing 5 + \varnothing 9 5 - 2 \varnothing 5 0}{2 \left(\varnothing 9 5 - \varnothing 5\right)} $$
Kurtosis
The graphic kurtosis (KG) is the how much peak is the distribution and measures the ratio between the sorting in the tails and central portion of the curve. If the tails are better sorted than the central portions, then it is termed as platykurtic, whereas leptokurtic, if the central portion is better sorted. Kurtosis is also a measure of the flatness of the grain size distribution as it would appear on a simple frequency curve. Flat distributions are platykurtic and peaked distributions are leptokurtic. The samples that are mesokurtic indicate that the sorting agent was uniform for the entire grain distribution. It is calculated by applying Folk and Ward [17] formula as shown in equation. The graphic skewness values and their respective interpretation are presented in Table 1.
$$ \left(\mathrm {G K Q}\right) = \frac {\Phi 9 5 - \Phi 5}{2 . 4 4 \left(\Phi 7 5 - \Phi 2 5\right)} $$ Graphic kurtosis ( ) ( )
| GKQ Values | Interpretation |
|---|---|
| < O.67 | Very platykurtic |
| 0.67 – 0.90 | Platykurtic |
| 0.90 – 1.10 | Mesokurtic |
| 1.10 – 1.50 | Leptokurtic |
| 1.50 - 3.00 | Very leptokurtic |
| >3.00 | Extremely leptokurtic |
Table 1: $$
Results and Discussions
Field Study
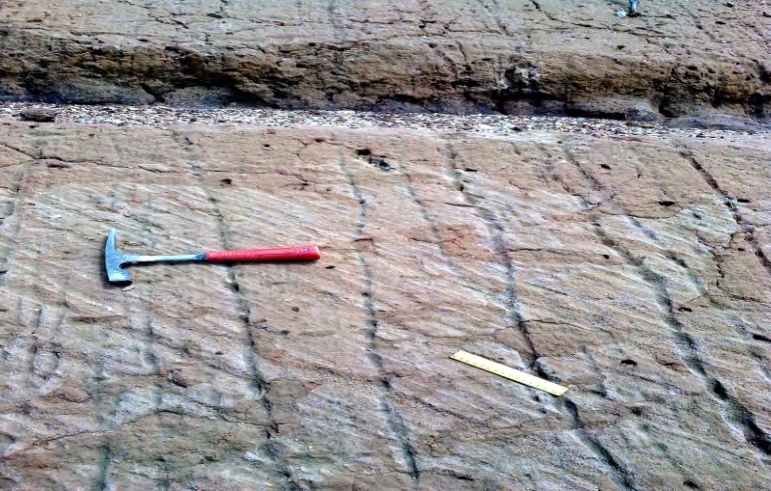
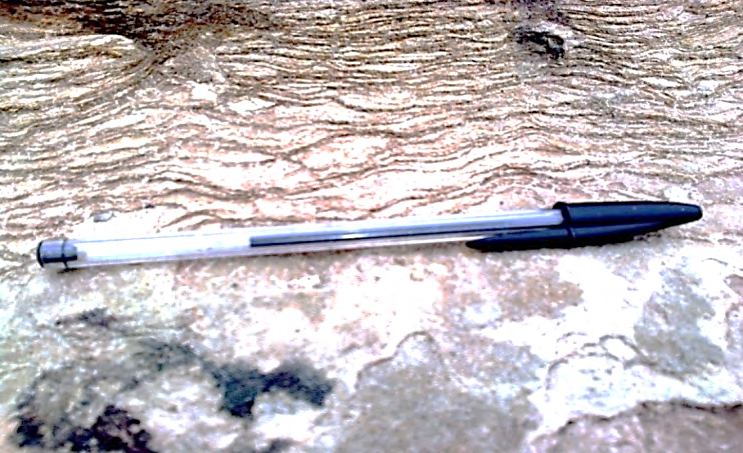
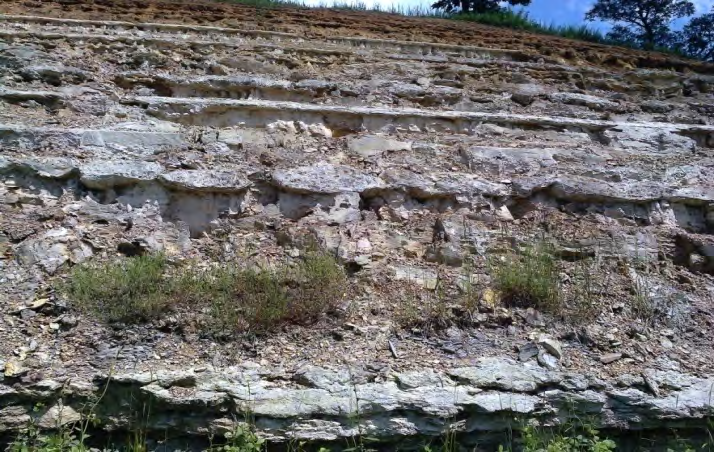
Lithostratigraphic sections of encountered outcrops in the field belong to Patti Formation. A typical exposure revealed alternating sequence of shales, claystone, siltstone and sandstone with ferruginous mudstone interbeds. At the base of the outcrop section is a greyish claystone bed overlain by 1.12m thick intercalated greyish shale. The shale units are fissile, dark-grey to black in colour with abundant plant remains (Figure 3). The shale facies is overlain successively by greyish to yellowish and reddish to purplish clay layers characterized by planar parallel bedding and planar cross bedding structures at the top (Figure 4). Upper sequence at the mid-section is defined by coarsening upward trend of planar parallel siltstone and overlying wavy planar structured, well sorted fine sandstone (Figure 5), suggestive of retrogradational system depositional phenomenon during increase in sea level [19]. Siltstone units are light grey to reddish brown, beds thickness range from 0.11 to about 7 m. The sandstone units are fine to coarse grained with bed thickness varying from 0.17 to 6 m (Figure3).
The upper section of the outcrop is characterized by alternation of sandstone and claystone of varying colours. The sandstones are generally of wavy planar structure while the claystone beds are structurally characterized by planar cross bedding and planar parallel beddings. The sandstones exhibit variety of colours ranging from creamy white through grey-yellowish to reddish brown. The colour variation, especially the greyish colour may suggests that some of the sandstones beds were deposited under anoxic condition of a marginal marine setting. However, the reddish colour imparted in them is an evidence of post depositional diagenetic effect; resulted from percolated, precipitated or crystallised diagenesis of iron-rich minerals into more stable iron minerals such as goethite or haematite autogenically formed in the sandstone beds.
Sandstone units of various textural characteristics exist within the Patti Formation. At some locations the sandstones units are almost entirely of fine grained variety, also are medium to coarse grained sandstones facies in other places. The sandstone units are composed of wedged beds of 0.17m to over 6m thick; colour ranges from creamy white through greyish-yellowish to reddish brown (Figure 6). The main component mineral grain is quartz which exhibits planar cross bedding (Figure 4), wavy lamination (Figure 5) and concretional sedimentary structures (Figure 6) representing common features in the study area. The planar cross bedding and wavy lamination structures result from angular deposition of well sorted sediments from the marine water, while gentle marine waves were also responsible for the deposition of the well sorted fine to medium grains of the Patti Sandstones. In most of the outcrops the sandstone units are slightly indurated suggestive of fair amount of cement binding the grains.
Granulometric
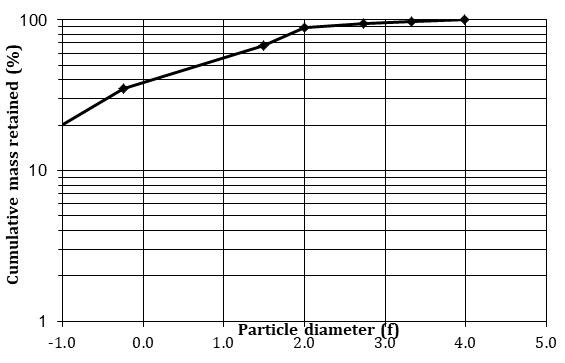
The result generated from the software on the granulometric analysis of the thirteen sandstone samples from the Patti Formation were obtained from the cumulative frequency curve of each sample. However, an example of such cumulative frequency curve from which statistical parameters such as mean, sorting, skewness and kurtosis for the analysed samples is presented in Figure 7.
Summary of the statistical parameters such as mean, sorting, skewness, kurtosis, the sample types and sediment names for the 13 samples are given in Table 2 below.
| Location | Mean | Sorting | Skewness | Kurtosis | Sample Type | Sediment Name | |
|---|---|---|---|---|---|---|---|
| 1 | BDA/02/A | Fine sand | Moderately well sorted | Fine skewed | Leptokurtic | Unimodal, moderately well sorted | Moderate well sorted fine sand |
| 2 | BDA/02/D | Fine sand | Well sorted | Symmetrical | Mesokurtic | Unimodal, well sorted | Well sorted fine sand |
| 3 | BDA/02/I | Medium sand | Moderately sorted | Fine skewed | Platykurtic | Polymodal, moderately sorted | Moderately sorted medium sand |
| 4 | BDA/04/A | Fine sand | Moderately sorted | Very fine skewed | Very Leptokurtic | Bimodal, moderately sorted | Moderately sorted fine sand |
| 5 | BDA/04/C | Fine sand | Moderately well sorted | Very fine skewed | Leptokurtic | Bimodal. Moderately well sorted | Moderately well sorted fine sand |
| 6 | BDA/05/B | Medium sand | Poorly sorted | Very fine skewed | Platykurtic | Trimodal, poorly sorted | Poorly sorted medium sand |
| 7 | BDA/07/A | Fine sand | Moderately well sorted | Very fine skewed | Leptokurtic | Trimodal, moderately well sorte | Moderately well sorted fine sand |
| 8 | BDA/07/C | Fine sand | Poorly sorted | Very fine skewed | Very Leptokurtic | Bimodal , poorly sorted | Poorly sorted fine sand |
| 9 | BDA/07/D | Coarse sand | Moderately sorted | Very fine skewed | Leptokurtic | Bimodal moderately sorted | Moderately sorted coarse sand |
| 10 | BDA/07/E | Fine sand | Moderately sorted | Symmetrical | Very Leptokurtic | Trimodal, moderately sorted | Moderately sorted fine sand |
| 11 | BDA/07/H | Medium sand | Moderately sorted | Fine skewed | Platykurtic | Bimodal, moderately sorted | Moderately sorted medium sand |
| 12 | BDA/08/A | Fine sand | Moderately well sorted | Symmetrical | Leptokurtic | Bimodal, moderately well sorted | Moderately well sorted fine sand |
| 13 | BDA/11/A | Medium sand | Poorly sorted | Very coarse skewed | Leptokurtic | Bimodal, poorly sorted sand | Poorly sorted medium sand |
Table 2: Summary of textural statistical parameters of Patti Sandstone.
The sandstone samples were categorized into 3 vis- à-vis fine, medium and coarse sandstone units in Patti Formation. The fine sandstone facies are samples BDA/02/A, BDA/02/D, BDA/04/A, BDA/08/C, BDA/07/A, BDA/07/C, BDA/07/E and BDA/08/A (Table 2). Their grain size is fine grained; sorting vary from well sorted- BDA/02/D, through moderately well sorted- BDA/02/A, BDA/04/C, BDA/07/A and BDA/04/C, to well sorted sample BDA/02/D. The sorting trend in the fine grained sandstones suggests deposition in marine environment. However, grain size lateral grading from coarsening to fining increases landward and seaward respectively in relation to the shoreline position.
The sorting characteristic of the fine grain sandstones depicts the energy of the medium of deposition to be relatively moderate to low in capacity. This permitted enough winnowing of the sediments as a result of interplay of ebb, flood and probably longitudinal currents responsible for effective winnowing which resulted into moderately well sorted sediment, wavy lamination and planar cross bedding structures typical of Patti Sandstones.
Medium grain size sandstone samples- BDA/02/I, BDA/05/B, BDA/07/H and BDA/11/A are characterized mainly by moderately and poorly sorted textural nature. In terms of skewness, they vary from very fine skewed through fine skewed to very coarse skewed (Table 2). The medium grained, poorly sorted sandstone were affected by fluvial processes of relatively high rate of deposition, multiple sourced channels, deposited in continental environment. The moderately sorted, medium grained size sandstone facies are suggested to have undergone same depositional processes like the poorly sorted sandstones but possibly deposited at the river mouth, characterized by relatively low sedimentation rate. Sample BDA/07/D was described to be moderately sorted coarse sandstone, bimodal skewness (Table 2), transported by relatively high current, deposited further away from the river mouth compared with the medium sandstones, channel deposit in a continental setting.
Sandstone Classification
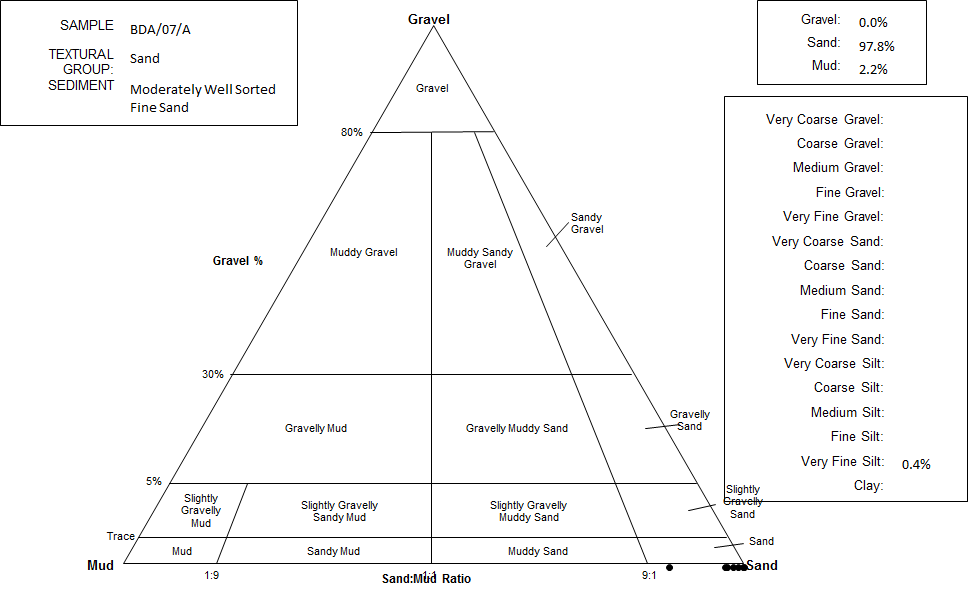
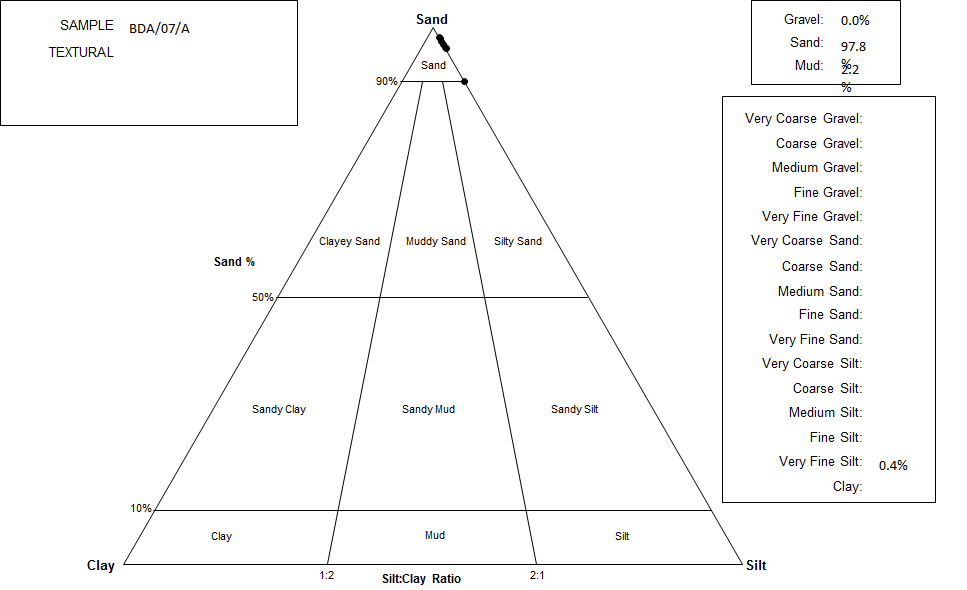
Classification of Patti Sandstone was generated by the software into ternary plot of gravel-sand-mud components. All the 13 samples plotted in the sand component corner of the ternary diagram as represented in Figure 8. A further refinement of the sandstone classification using sand-silt-clay distribution ternary plot to determine the relative percentage of sand/silt particle ratio shows that all the samples plotted in the sand component corner with minimum of 90% sand and less than 10% silt component (Figure 9). Therefore, the ternary diagrams further substantiate the samples to be of sandstone facies of negligible silt and clay particles.
Paleoenvironment of Deposition
Paleoenvironment of deposition of the samples was deduced by considering different parameters. The river and beach paleoenvironment was distinguished on the basis of the extent of sieving process imparted on the sediment which could suggest the distance of deposition of the sediment away from the source. The sediment sorting values less than 0.88 (< 0.88) were considered to be deposited within the lithoral and adjacent outer zone (beach) while the sandstone samples having sorting values greater than 0.88 (> 0.88) were considered to be deposited in the sublithoral and adjacent inner zone (fluvial). Therefore, samples BDA/02/A, BDA/02/D, BDA/02/I, BDA/04/C, BDA/07/A, BDA/07/H, and BDA/08/A belong to the beach environment, whereas samples BDA/04/A, BDA/05/B, BDA/07/C, BDA/07/D, BDA/07/E and BDA/11/A are categorized in fluvial environment (Table 3).
| Sample Number | Mean | Sorting | Skewness | Kurtosis | Paleoenvironment |
|---|---|---|---|---|---|
| BDA/02/A | 2.18 | 0.58 | 0.15 | 1.48 | Beach |
| BDA/02/D | 2.12 | 0.38 | -0.06 | 0.87 | Beach |
| BDA/02/I | 1.01 | 0.86 | 0.25 | 0.86 | Beach |
| BDA/04/A | 2.86 | 0.99 | 0.61 | 1.74 | River |
| BDA/04/C | 2.57 | 0.66 | 0.33 | 1.34 | Beach |
| BDA/05/B | 1.07 | 1.07 | 0.34 | 0.83 | River |
| BDA/07/A | 2.79 | 0.69 | 0.28 | 1.21 | Beach |
| BDA/07/C | 2.83 | 1.15 | 0.55 | 1.53 | River |
| BDA/07/D | 0.83 | 0.97 | 0.54 | 1.24 | River |
| BDA/07/E | 2.40 | 0.93 | 0.01 | 1.89 | River |
| BDA/07/H | 1.01 | 0.87 | 0.28 | 0.76 | Beach |
| BDA/08/A | 2.10 | 0.64 | 0.08 | 1.29 | Beach |
| BDA/11/A | 1.61 | 1.01 | -0.42 | 1.23 | River |
Table 3: Summary statistical data comprising of Mean, Standard Deviation (Sorting), Skewness, and Kurtosis of Patti Sandstone sam
The other criterion used in determining the paleoenvironment of deposition of the analysed sandstones samples are cross plots of the statistical parameters suggested by Friedman [20]. Therefore, cross plot of skewness versus standard deviation was used (Figure 10). The bivariant plot in Figure 11 shows that 7 samples plotted within the fluvial segment while 6 samples plotted in the marine. The number of sandstone samples plotting in the fluvial and marine segments of the bivariant diagram correspond to sorting index interpreted in Table 3.
![Figure 10: Bivariate plot of skewness versus standard deviation [3].](/fulltextimages/8653/fig_10.png)
Therefore, the Patti Sandstones texturally show that they can serve as good hydrocarbon reservoir and aquifer because they possess evidence of good porosity and permeability features characterized by coarse to fine grain size, moderately well sorted to well sorted particles, rounded to subrounded in angularity and minor matrix contained in the sediment component [21].
![Figure 11: Bivariate plot of mean versus standard deviation [3].](/fulltextimages/8653/fig_11.png)
Conclusions
Field investigation and sieve analysis carried out on the Patti Sandstone show that the sandstone deposits were affected by both progradational and retrogradational systems sequel to fluctuation in sea level. The sandstone facies were characterized by coarse to fine grains, greyish to reddish in colour due to deposition under anoxic condition and post depositional diagenesis effect. Field observation further revealed that the structural elements are planar cross bedding, wavy laminations and concretions in form of loadcast are suggestive of marine and continental deposits.
Sieve analysis classified the sandstones into coarse, medium and fine grains. The fine grains were deposited by ebb, flood and longitudinal currents which permitted adequate winnowing that resulted into in moderately well sorted sandstones, while the medium and coarse grain sandstone were deposited at the river mouth and beyond in continental paleoenvironment. The porosity and permeability is good because the ternary diagram suggested dominant sand grain of over 90% and < 10% silt with little or negligible clay particles present. Cross plots of statistical parameters depict deposition of the sandstones in both marine and continental environments.
Acknowledgement
The authors are grateful to Palystrat Limited for providing literature materials used for this paper and to Mr Adamu Farouk Kele, graduate student of Federal University Birnin Kebbi for generating the litholog.
References
-
Oladimeji RG, Ola-Buraimo AO (2021) Palynological age dating and paleoenvironment of Patti Formation, Bida Basin, North-central Nigeria. Savanna Journal of Basic and Applied Sciences 3(2): 139-145.
-
Braide SP (1992) Geological development, origin and energy mineral resource potential of the Lokoja Formation in the Southern Bida Basin. Journal of Mining and Geology 28: 33-44.
-
Braide SP (1992b) Syntectonic fluvial sedimentation in the central Bida Basin. Journal of Mining and Geology 28: 55-64.
-
Ojo OJ, Akande SO (2009) Sedimentology and Depositional Environments of the Maastrichtian Patti Formation, Southern Bida Basin, Nigeria. Cretaceous Research 30(6): 1415-1425.
-
Akande SO, Ojo OO (2002) Organic petrology and rock eval studies on source rock facies of Campanian- Maastrichtian Patti Formation, southern Bida Basin, Nigeria. NAPE Bulletin 16: 21-39.
-
Akande SO, Ojo OJ, Erdtmann BD, Hetenyi M (2005) Paleoenvironmens, organic petrology and Rock-Eval studies on source rock facies of lower Maastrichtian Patti Formation, southern Bida basin, Nigeria. Journal of African Earth Sciences 41(5): 394-406.
-
Ehinola OA, Sonibare OO, Falana AM, Jarvie DM (2006) Organic geochemistry and biomaker evaluation of shale units of the Maastrichtian Patti Formation, Bida Basin, Nigeria. Nigeria Association of Petroleum Explorationist Bulletin 19(1): 78-88.
-
King LC (1950) Speculations upon the Outline and the Mode of Disruption of Gondwanaland. Geological Magazine 87(5): 353-359.
-
Kennedy WQ (1965) The influence of basement structure on the evolution of the coastal (Mesozoic and Tertiary) basins. Recent Basins around Africa: Proceedings of the Institute of Petroleum Geologists Society, London, pp: 35-47.
-
Wright JB, Hastings DA, Jones WB, William HR (1985) Geology and Mineral Resources of West Africa. Allen & Unwin, London.
-
Ojo SB (1984) Middle Niger Basin revisited: magnetic constraints on gravity interpretation Abstract. 20th Conference of the Nigerian Mining and Geoscience Society, Nsukka, pp: 52-53.
-
Adeniyi JO (1985) Ground total magnetic intensity in parts of the Nupe Basin and adjacent Basement Complex, Niger State, Nigeria. Nigerian Jour App Sci 3: 67-78.
-
Adeleye DR (1974) Sedimentology of the fluvial Bida Sandstone (Cretaceous), Nigeria. Sedimentary Geology 12(1): 1-24.
-
Adeleye DR (1971) Stratigraphy and sedimentation of the Upper Cretaceous strata around Bida, Nigeria. Unpublished Ph.D. Thesis, Dept. of Geology, University of Ibadan, Nigeria.
-
Ladipo KO, Akande SO, Mucke A (1994) Genesis of oolitic ironstones from the middle Nigeria sedimentary basin: Evidence from sedimentological, ore microscopic and geochemical studies. Journal of Mining and Geology 30(2): 161-168.
-
Ola-Buraimo AO (2020) Palynozonation and chronostratigraphy of the Albian to Pliocene sediments of the Nzam-1, Umuna-1 and Akukwa-2 wells, Anambra Basin, southeastern Nigeria. University of Ibadan, PhD thesis, pp: 182.
-
Krumbein WC, Pettijohn FJ (1938) Manual of sedimentary petrography. Appleton Century Crofts, New York, pp: 549.
-
Folk RL, Ward WC (1957) Brazos River bar (Texas): a study in the significance of grain size parameters. Journal of sedimentary research 27(1): 3-26.
-
Ola-Buraimo AO, Ehinola OA (2021) Sequence stratigraphy and sea level changes in relation to evolution of Anambra Basin, southeastern Nigeria. Savanna Journal of Basic and Applied Sciences 3(2): 124-138.
-
Friedman GM (1961) Distribution between dune, beach and river sands from their textural characteristics. Journal of Sedimentary Research 31(4): 514-529.
-
Olaniyan O, Olabaniyi SB (1996) Facies analysis of the Bida Sandstone Formation around Kajita, Nupe Basin, Nigeria. Journal of African Earth Sciences 23(2): 253- 256.
- Nigeria’s Vulnerability in the Face of Global Energy Policy
- A Simulation Study of Investigation of Optimum Oil Production Performance by Applying Various Gas Injection Methods in Oil Reservoir
- Characterization of Permo-Triassic Reservoirs through Thermal Maturity Assessment of Westphalian Source Rocks in the Cheshire Basin
- Influence of Microwax on the Rheological and Thermal Behaviour of a Wax Crude Oil
- Real-Time Monitoring and Performance Optimization of Steam Injection in Heavy Oil Reservoirs Using Fiber Optic Sensing and Integrated Predictive Simulation Models
- Rapid On-Site Determination of the Total Petroleum Hydrocarbon Content of Soils by Handheld Fourier Transform Near-Infrared Spectroscopy: Development of a Global, Site- and Scanner- Independent Calibration Model