Development of a New Correlation for Predicting Initial Water Saturation in Carbonate Reservoirs
The Middle East, rich in oil and gas within carbonate rocks, accounts for a significant portion of global reserves, drawing extensive exploration by major oil firms. Unlike Southeast Asia's fracture and cavity-dominated carbonate reservoirs, the Middle East features thick-bedded, pore-structured reservoirs with vast reserves. These complex and varied pore structures cause reservoir inhomogeneity, challenging the technical evaluation of these unconventional reservoirs. Characterization of carbonate reservoirs differs in terms of their mineralogical compositions and heterogenous pore systems from that of clastic reservoirs. Reservoir characterization seeks to build geological and petrophysical models for reservoir simulation. Rock types represent the most crucial characteristics of reservoirs for specialized facies modelling within specific ranges of porosity and permeability. Rock typing is an essential method routinely used by petroleum engineers for characterizing and predicting the reservoir quality of carbonate reservoirs by classifying reservoir rocks into distinct units based on similar petrophysical properties. It is imperative to predict these reservoir properties accurately and precisely. The J-function technique is considered the most effective rock typing procedure. In this study, a new correlation for predicting initial water saturation (Swi) for a reservoir producing from a Permian carbonate formation, located in the Arabian Peninsula, has been developed. The new empirical equation is an augmented Lucia model that utilizes capillary pressure (Pc), porosity (), and permeability (k), as independent variables. The coefficient of multiple R2, the student’s t and F-tests p-value were used in the model evaluation. R2 for the new model was about 0.92, t-test and F-test p-values were much lower than 0.05, indicating that the independent variables are significant. The model was also tested against an independent data set and yielded an R2 of 0.88. Likewise, the new correlation was compared to Lucia’s model and showed better results. The goal of the study is to use the developed correlation in the geostatistical modeling of connate water saturation for analogous formations in the region.
Introduction
Water Saturation estimation remains one of the critical correlations that help reservoir engineers quantify the volumes of hydrocarbons contained in a reservoir. Despite the success of estimating this parameter by analyzing core samples, other engineers have resorted to using rock physics to evaluate water saturation [1]. Precise determination of water saturation throughout every section of the reservoir is vital for accurately characterizing the reservoir and calculating the original volume of hydrocarbons present [2]. Estimating water saturation is crucial for reservoir engineers to measure the number of hydrocarbons in a reservoir accurately. Precisely identifying how water and hydrocarbons are distributed underground is vital for several practices, including enhanced oil recovery and carbon dioxide sequestration [3, 4, 5, 6, 7, 8, 9, 10].
Carbonate reservoirs pose some of the biggest challenges in developing new technologies for exploration of hydrocarbons. In recent times, the oil and gas industry has grappled with significant challenges related to the characterization, quantification, and prediction of reservoir properties. Because of both intra and interparticle porosities, carbonate rocks have a highly complex pore structure, making characterizing carbonate rocks, gathering, and analyzing petrophysical data difficult [11, 12]. Carbonate reservoirs also differ from clastic reservoirs in their surface chemical properties and inherent dual porosity systems. Analyzing reservoir rock properties to enhance understanding and boost recovery can be achieved through digital rock physics. This method employs X-ray micro-computed tomography for pore-scale modeling. Yet, implementing digital rock technology necessitates specialized skills in image analysis and numerical simulations, which can be costly and might not always be accessible within an organization [13].
The critical link between geological heterogeneity and reservoir quality is important and rock typing remains a reliable method for evaluating reservoir quality. Rock typing is an important footstep in characterizing carbonate reservoirs and building geological models for reservoir simulation. The procedure entails categorizing reservoir rocks into separate units, each deposited under comparable geological conditions and undergoing similar diagenetic changes [14]. In this study, rock samples with similar rock structural properties were grouped and distinct rock types were identified. The developed capillary pressure profiles and initial water saturation empirical model were then utilized to improve the discretization of the static model of the reservoir and reduce uncertainty in quantifying of the hydrocarbon content.
**Literature Review**
Combining tortuosity, cementation factor (m), formation water resistivity ($R_w$), effective porosity ($\varphi$), bulk resistivity ($R_t$), and saturation exponent ($n$), Archie came out with an equation for calculating water saturation ($S_w$) [15]. This expression is given by:
$$S_w = \left[ \frac{a \cdot R_w}{\varphi^m \cdot R_t} \right]^n$$
However, to use the Archies equation, it is vital to accurately determine parameters often considered as constant values in clastic quartz reservoirs [16]. Although the parameters for predicting the water saturation using the Archies equation can be acquired through core measurements in the laboratory and applied to logging interpretations, the reservoir heterogeneity along the longitudinal axis is overlooked by fixed parameters commonly known as “static parameters” [17]. The innate uncertainties associated with these parameters result in errors in the water saturation predictions. For instance, it is difficult to predict formation water resistivity ($R_w$) when there is limited production test or SP Logs and effective porosity($\varphi$), when rock matrix type is unknown [3]. Given this, researchers are still advancing to find a robust correlation to predict the water saturation in complex reservoirs [18, 19].
Petrophysical rock types are classified according to their fluid behavior within the rock, as they are calibrated from core and dynamic data as well as from wireline logs. Facies is another term used interchangeably with rock types and refers to all the characteristics of a rock unit. Carbonates occur naturally as economically essential mineral deposits and are placed as sediments and reefs in ancient rocks, tropical, and temperate oceans. Carbonates are grouped into families known by the crystal system in which they form, such as monoclinic, orthorhombic, and crystallographic system [20]. Carbonates exist mostly as hexagonal systems and consist of two types of rocks: limestones and dolomites.
Published correlations that are based on rock texture yield good quality porosity data and a more accurate estimation of the connate water saturation of a reservoir. Rock fabrics’ facies are basic elements for characterizing a carbonate reservoir [21, 22]. The rock-fabric method of petrophysical characterization is done based on relationships that exist between sorting, pore type, particle, and pore size. Dunham [23] classified carbonate rocks by distinguishing between sediments deposited in agitated water and sediments deposited in calm water to gain fundamental understanding of the depositional environment. He identified the basic carbonate rocks based on three textural features, namely:
- Abundance of grains
- Abundance of mud and
- Signs of binging
Various authors tried to classify carbonates based on rock textures and compositions. Important contributions were by Choquette, et al. [24, 25]. The former categorized carbonates based on fabric selective and non-fabric selective pore types while the latter revealed that the most practical division of pore types was between pore space, located amongst grains or crystals named interparticle porosity and other pore space called vuggy porosity.
Diagenesis triggers variations in size, shape, volume, chemical composition, or crystalline shape of a sedimentary rock after its detrital, biogenic, or crystalline elements have been deposited [20]. When a reservoir rock is subjected to substantial diagenesis, the existing rock properties will be quite distinct from the original rock properties present at the time of deposition [26].
Furthermore, there are different methods of rock typing. The three leading methods are Winland’s R35 method Pittman [27], Flow Zone Indicator method Amaefule, et al. [28] and the Leverett J-function method [29, 30, 31]. Winland built an empirical relationship among porosity, permeability, and pore throat radius of reservoir rocks using mercury injection - capillary pressure. This relationship was published by Kolodzie [32]. Pittman examined the rocks that Winland used and discovered that the net height of sandstone having an R35 value lower than 0.5µm was useful to ascertain the point at which hydrocarbon trapping would follow Pittman [27].
According to Amaefule, et al. [28], the Flow Zone Indicator (FZI) method is a conventional method used to define hydraulic flow units (HU) in porous media, where FZI is defined as the ratio of Reservoir Quality Index (RQI) to normalized porosity, fz:
$$ F Z I = \frac {R Q I}{\phi_ {z}} (2) $$
z $$ \mathrm {w h e r e}, R Q I = 0. 0 3 1 4 \sqrt {\frac {k}{\phi}} $$
k is permeability (md), φ is total porosity (fraction), and $$ \phi_ {z} = \left(\frac {\phi}{1 - \phi}\right). $$ .
RQI is normally plotted against ∅z on a log-log scale. Data points falling on the same lines have the same characteristics and form distinct flow units. Nevertheless, Amaefule, et al. [28] indicated that this method requires a large routine core analysis (RCAL) dataset.
Moreover, the Leverett J-function is a dimensionless variable that interrelates rock and fluid properties. According to Leverett [29], the J-function is defined as:
| 0.216P c σcosθ | k φ |
|---|
where, Pc is capillary pressure in psia, σ is interfacial tension in dynes/cm, and θ is a contact angle measured through the rock wetting (denser) phase in degrees.
According to Amaefule, et al. [28], Equation (2) can be rewritten as a function of RQI:
$$ J = \frac {6 . 8 8 P _ {c}}{\sigma \cos \theta} R Q I \tag {4} $$
In addition, Archie [15] defined formation resistivity factor, FR, as:
$$ F _ {R} = \frac {R _ {0}}{R _ {w}} (5) $$
0 R w where, Ro is the resistivity of the rock, fully saturated with formation water in Ohmmeters, and Rw is the water resistivity also in Ohmmeters.
According to Archie [15], the value of Ro is important to ascertain true water saturation. FR is related to porosity as follows:
$$ F _ {R} = \frac {a}{\phi^ {m}} (6) $$
Furthermore, Archie [15] expressed resistivity to formation water saturation using the resistivity index, IR:
R I S R n t R w o
$$ = \frac {R _ {t}}{R} = S _ {w} ^ {- n} (7) $$
Equations 5 and 6 are combined to yield the following:
1_n_ w w m t $$ S _ {w} = \left(\frac {a}{\phi^ {m}} \frac {R _ {w}}{R _ {t}}\right) ^ {1} $$ (8) where, Rt is the true resistivity in Ohmmeters, and a is the cementation constant and the intercept of a logarithmic plot of FR versus ∅.
The cementation factor (m) and saturation exponent (n) values are crucial in the estimation of water saturation Sw and hydrocarbon reserves [33].
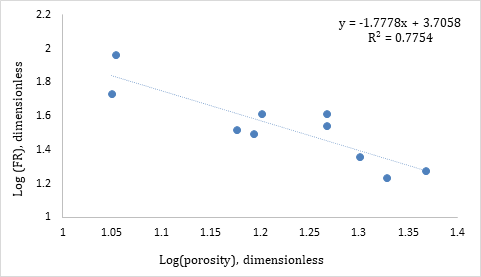
The cementation factor value (m) is estimated from the slope of a log-log formation resistivity factor (FR) and porosity plot (Figure 1). In this work, average cementation factor for the tested samples was 1.8 which is lower than 2.0 and indicates that the carbonate reservoir is naturally fractured [34].
Irreducible water saturation is prone to confusion with initial or connate water saturation. The latter signifies the water saturation distribution in the reservoir during its discovery, whereas the former is commonly derived from primary drainage capillary pressure experiments in the laboratory. Nevertheless, Doveton (2014) recommended the term “immobile water saturation” over irreducible water saturation. This preference stems from mercury injection tests demonstrating that saturations at this level can ultimately be reduced to zero under sufficiently high pressures [35].
Experimental Procedure
Tested rock samples were collected from a carbonate reservoir in the Arabian Peninsula. Core samples were taken from a Permian formation made up of limestone and dolostone. The formation has been impacted by various diagenetic processes triggering abundant interparticle and moldic porosity.
Core electrical measurements were performed on 10 core samples. The samples were cored out from the crest of the structure where porosity was higher than in the flanks. It was evident that packstone with oolitic and skeletal grainstones populate the formation, composed mainly of a cyclic dolomitic shelf that was deposited during the Permian period. The Permian formation has been affected by various diagenetic processes including dolomitization, cementation, leaching, recrystallization, compaction, and fracturing. Interparticle and moldic porosity are also abundant in the region. Inter-crystalline and micro-porosity are common in limestone and dolomite lithologies [36].
The samples were cleaned in a SoxhletTM extractor by circulating toluene and alcohol. Samples were then dried for 24 hours and weighed. The porosity of each core plug was measured using a helium porosimeter.
Absolute permeability to gas was determined using a Hassler core holder. In measuring permeability, gas is usually preferred over liquids since gas acts as a non-wetting phase and hardly alters the original state of the tested core samples. Measurements can also be repeated.
A porous plate was utilized to determine the initial water saturation for each core plug, and saturations were measured using a resistivity meter. Temperature, brine displacement, confining and pore pressures were monitored continuously. The interfacial tension and wetting angle were measured to be 29 dynes/cm and 120 degrees, respectively. The liquid surface/interfacial tension was measured using the Pendant Drop method. The contact angle was determined using a Du Noüy ring.
Study Methodology
The primary goal of reservoir characterization is to develop an initial water saturation model. The developed static model can be used to assess hydrocarbon reserves better and reduce uncertainty. In the laboratory, one can mimic/reproduce initial (connate) water saturation levels by desaturation of core plugs to amounts where water saturations become irreducible. Conventionally, irreducible water saturation is established by displacing the water present in core plugs with oil or gas using a centrifuge. In this work, we used a porous plate, and air as the non- wetting phase to establish irreducible water saturation and reproduce drainage/desaturation capillary pressure curves.
Moreover, rock typing is also carried out by grouping rock samples based on porosity values. The corresponding J-function for each rock type is calculated and plotted against normalized water saturation (Sw*) values. Sw* is expressed as a function of water saturation Sw and initial water saturation, Swi (Lucia, 1995) as follows:
S S S S $$ v = \frac {S _ {w} - S}{1 - S} $$
1 w wi w (9) wi
The logarithmic plot of the J-function against Sw* identifies the different prevalent rock types. The following relationship is utilized in the identification of the distinct types:
( ) * b $$ J = a \left(S _ {w} ^ {*}\right) ^ {b} \tag {10} $$
The permeability values for each rock type form a cluster along a straight line. Permeabilities of uncored intervals in the reservoir are interpolated using the linear trendline developed for each rock type.
Furthermore, Lucia (1983) expressed the initial water saturation (Swi) as a function of reservoir height (H) and porosity (φ) as follows:
b c wi S a H φ $$ = a H ^ {- b} \phi^ {- c} \tag {11} $$
Since permeability of carbonate rocks can be expressed as a function of porosity as in:
$$ k = a \phi^ {b} (1 2) $$
and that capillary pressure relates to reservoir height; Pc = f(H). Then, Lucia’s equation (11) can be articulated in the following form, where Swi is written as a function of Pc, φ, and k:
$$ S _ {w i} = f \left(P _ {c}, \phi , k\right) \tag {13} $$
Statistical Theory
Equation (13) was used as a basis for the empirical equation developed in this study. Multiple linear regression analysis techniques were utilized to express water saturation, Sw, as a function of capillary pressure, Pc, porosity, φ, and permeability, k. T-statistic, p-values, the coefficient of multiple determination, R2, and analysis of variance (ANOVA) were all used to assessment of the empirical model. Measured laboratory data was utilized in the statistical analysis. The laboratory data set was used for model development and an independent one was employed in testing and validation. The developed empirical correlation was compared to Lucia’s model [20] which was established for carbonate rocks and applies to this study.
Results and Discussion
Core properties of the tested core samples are summarized in Table 1. Porosity of core samples ranged from 11.22 to 23.26%. Permeability varied from 8.89 to 72.27 md. Irreducible water saturation array was from 20.33 to 33.54%.
| Sample No. | Porosity, fraction | He pore volume, cc | Permeability, md | S , fraction wi | Capillary pressure, psia |
|---|---|---|---|---|---|
| 1 | 0.2133 | 13.95 | 20.15 | 0.2524 | 200 |
| 2 | 0.2326 | 15.67 | 14.46 | 0.2086 | 190 |
| 3 | 0.1563 | 10.19 | 23.07 | 0.2033 | 180 |
| 4 | 0.1586 | 10.23 | 10.36 | 0.3354 | 200 |
| 5 | 0.1132 | 7.26 | 21.15 | 0.2156 | 200 |
| 6 | 0.1122 | 7.36 | 8.89 | 0.246 | 200 |
| 7 | 0.1854 | 12.33 | 22.84 | 0.286 | 200 |
| 8 | 0.1848 | 12.23 | 72.27 | 0.2475 | 200 |
| 9 | 0.2002 | 12.97 | 12.2 | 0.294 | 195 |
| 10 | 0.1497 | 10.14 | 14.54 | 0.2381 | 180 |
Table 2: Core properties of the tested samples.
Capillary pressure profiles for the corresponding rock samples are depicted in Table 1. The capillary pressure plots were displayed to classify rock samples.
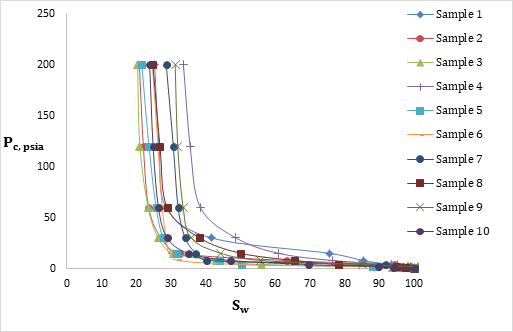
Figure 2 was unconvincing, and a better approach would be to use the J-function method to better distinguish between rock types. The RQI for each sample was calculated. The J-functions were generated and plotted against normalized water saturation values (Figure 3).
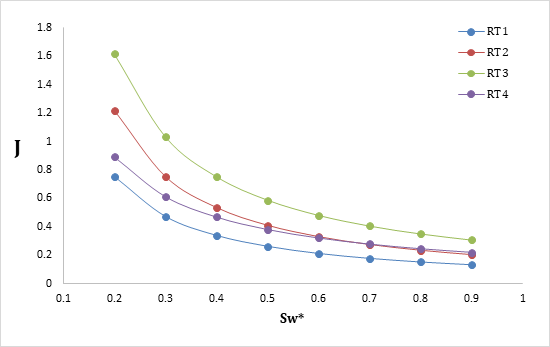
Rock types RT1, RT2, RT3, and RT4 have been identified based on porosity range and average percentage of dolomite. The presence of dolomite impacts porosity. Dolomitic granular carbonates become be less porous with increasing dolomite percentage as increasing mud and compaction effects diminish macro-pores in denser grainstones. Table 2 classifies the used rock types.
| Porosity Range | Rock Types | Average Dolomite % |
|---|---|---|
| ~0.11 | 1 | 100 |
| ~0.15 | 2 | 22 |
| ~0.18 | 3 | 10 |
| ~0.2 | 4 | 7 |
Table 3: Rock types based on porosity range and dolomite percentage present.
The J-functions were plotted for the four different rock types. Since the difference between RT2 and RT4 is very insignificant, it was decided to consider only three types: RT1, RT2, and RT3. Moreover, the initial water saturation, Swi, was correlated against capillary pressure, porosity, and permeability to generate a regression model. The following formulation was utilized in the development of the empirical model for the Permian Arabic Peninsula carbonates:
( ) ( ) ( )
b c d $$ S _ {w i} = a \left(P _ {c}\right) ^ {b} \left(\varphi\right) ^ {c} \left(k\right) ^ {d} \tag {14} $$ From multiple linear regression analysis, the generated empirical correlation is as follows:
$$ \log \left(S _ {w i}\right) = - 9. 6 + 3. 8 1 \log \left(P _ {c}\right) - 0. 6 3 1 \log (\phi) - 0. 1 3 7 \log (k) \tag {15} $$ To determine whether the independent variables, Pc, φ, and k were enough to explain the variation in the estimation of the dependent variable, Swi, a regression coefficient table is presented (Table 3). Table 3 summarizes regression coefficients, t-statistic, and p-values for each variable in the developed equation.
| Coefficients | Standard Error | t-stat | p-value | Lower 95 % | Upper 95% | |
|---|---|---|---|---|---|---|
| Intercept | -9.5959029 | 1.412487177 | -6.7936 | 0.00245 | -13.51759602 | -5.6742098 |
| P c | 3.81253997 | 0.595066043 | 6.40692 | 0.00305 | 2.160371765 | 5.4647082 |
| φ | -0.6313315 | 0.171705197 | -3.6768 | 0.02126 | -1.108061556 | -0.1546015 |
| k | -0.1370607 | 0.040799731 | -3.3594 | 0.02832 | -0.250338933 | -0.0237825 |
Table 4: Summary statistics for the new model.
Moreover, hypothesis testing was used to decide whether there is sufficient statistical evidence in favor of the equation regression parameters. The null hypothesis (Ho) tests whether each variable coefficient is zero. It is a typical statistical theory that suggests that no statistical relationship and significance exists in a set of given single observed.
$$ H _ {0}: \beta_ {i} = 0 $$
On the other hand, the alternative hypothesis (Ha) examines the exclusive statement that these coefficients are not zero. It is what will be tested in the hypothesis. It is the answer to the research question.
$$ H _ {a}: \beta_ {i} \neq 0 $$
If the coefficient of a particular variable is zero, then the variable drops out of the model as it does not contribute to the explanation of the dependent variable, Swi. A p-value that is less than or equal to 0.05 is frequently used to test whether there is evidence against the null hypothesis. If the p-value is less than 0.05, the null hypothesis is rejected. The p-value for each variable is less than 0.05 (Table 3 above). Hence the null hypothesis is rejected, and all the empirical equation independent variables can be used to explain the variation in the dependent variable.
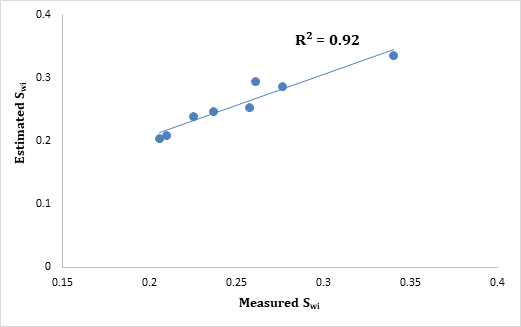
The coefficient of determination (R2) is the proportion of variability in the observed response. An R2 value of more than 0.8 indicates a high degree of correlation. In this study, the regression R2 for the developed correlation is about 0.92. This suggests a strong correlation between the dependent variable (Swi) and the independent variables (Pc, ∅, k). An adjusted R2 value of 0.86 indicates that the inclusion of the variable permeability in the new correlation has yielded superior results. It is evident from Table 4 that we only used 8 data points instead of 10. Two of the data points were discarded since there was ambiguity about their measurement. The number of samples used in this study is limited. The eight data points explained the relationship between the dependent and independent variables for the geological formation under study and yielded a considerable degree of fit.
| Regression statistics | |
|---|---|
| Multiple R | 0.9594759 |
| R² | 0.9205941 |
| Adjusted R² | 0.8610396 |
Table 7: ANOVA results.
| Standard Error | 0.0277656 |
| Observations | 8 |
Table 5: ANOVA results.
To depict the results of regression statistics, data from the developed model (model generated Swi) has been plotted against measured Swi (Figure 4). The R2 value of 0.92 confirms the excellent agreement between estimated and measured data.
The analysis of variance (ANOVA) for the new correlation is shown in Table 5. ANOVA results indicate that the variability between sample means is much higher than the variation among samples (F = 15.5). The p-value of the F-test is around 0.01 and is much lower than 0.05. This confirms that the regression coefficients of the independent variables are significant and that the null hypothesis should be rejected.
| Df | SS | MS | F | p-value | |
|---|---|---|---|---|---|
| Regression | 3 | 0.035751 | 0.0119 | 15.46 | 0.0115047 |
| Residual | 4 | 0.003083 | 0.0008 | ||
| Total | 7 | 0.038834 |
Table 6: ANOVA results.
Cross-validation or out-of-sample testing using an independent data set (Table 6) was performed to test the validation of the developed model. The testing data set porosity ranged from 11 to 28%. Permeability varied from 8.36 to 640 md. Both ranges are vast, and validation will imply that the correlation is consistent.
| φ | 0.2024 | 0.28 | 0.1663 | 0.1386 | 0.135 | 0.188 | 0.11 | 0.219 |
|---|---|---|---|---|---|---|---|---|
| k, md | 22.13 | 16.45 | 223.7 | 8.36 | 24.54 | 170.7 | 645 | 12.8 |
Table 8: Independent data set.
Moreover, the predicted Swi has been plotted against Swi from a testing data set. Figure 5 shows an excellent agreement between the predicted and testing data. It also verified the developed empirical model validity.
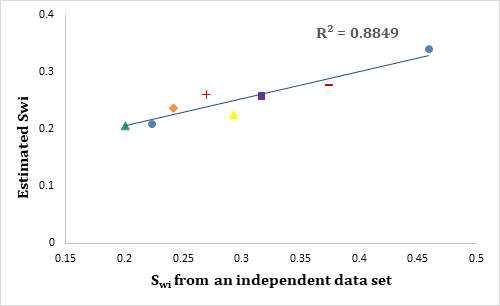
The new correlation produced an R2 value of 0.88, indicating a good fit, considering the wide variability of porosity and permeability, as depicted in Figure 5 and Table 6. This implies that the correlation is valid and can be used in different carbonate reservoirs within the model testing range of 11 to 28% for porosity and 8.36 to 640 md for permeability. In addition, Figure 6 depicts a comparison between the newly developed correlation and Lucia’s empirical model (1995), an industry standard for carbonate rocks.
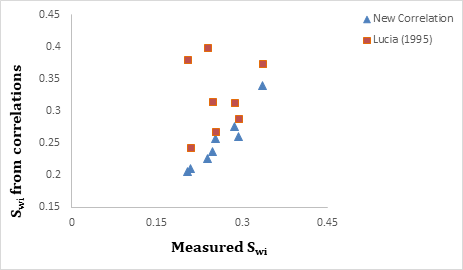
equation gave a lower error sum of squares (SSE) of 0.003, a lower mean squared error (MSE) value of 0.0008, and a lower p-value of 0.01.
| New correlation | Lucia (1995) | Wang et al. (2006) | Guo et al. (2005) | |
|---|---|---|---|---|
| $SS_{E}$ | $0.003084 | 0.011784 | 0.036193 | 0.013831 |
| MS_{E}$ | $0.000771 | 0.002357 | 0.006032 | 0.002305 |
| p-value | 0.011505 | 0.050718 | 0.532705 | 0.77326 |
Table 9: Correlation comparison table.
Conclusions
A new initial water saturation empirical correlation has been developed based on laboratory measurements of Arabian Peninsula carbonate rock samples. The new equation yielded an R2 value of about 0.92. The student’s t-test and F-test p-values were much lower than 0.05. The new model has been tested against an independent data set. The coefficient of multiple determination of predicted Swi_s against the independent data set yielded an _R2 of 0.88. The degree of fit is deemed significant given the wide range of test data. The new model was compared to Lucia’s, an industry standard for carbonate rocks and showed better results.
Laboratory experiments remain the most trustful means of reservoir property measurement if they can be afforded Tariq, et al. [11]. In the absence of such measurements however, k, φ, and Pc can be collected from well logs, well testing data, and perhaps other laboratory measurements from analogous formations in the region. Besides, like other parametric equations, the idea is to utilize the correlation to replace some of the costly laboratory data collection methods.
Conflict of Interest
On behalf of all the co-authors, the corresponding author states that there is no conflict of interest.
Statements and Declarations
The authors declare that they have no known competing financial interests or personal relationships that could have appeared to influence the work reported in this paper.
References
-
Alimoradi A, Moradzadeh A, Bakhtiari MR (2011) Methods of water saturation estimation: Historical perspective. Journal of petroleum and gas engineering 2(3): 45-53.
-
Gomaa S, Soliman AA, Mohamed A, Emara R, Attia AM (2022) New Correlation for Calculating Water Saturation Based on Permeability, Porosity, and Resistivity Index in Carbonate Reservoirs. American Chemical Society 7(4): 3549-3556.
-
Tohidi E, Hesan M, Azad A, Abbasi M, Sadeghnejad S (2024) Implementing pore size distribution into saturation height function modelling of reservoir rock types: A case study on a carbonate gas reservoir. Gas Science and Engineering 121: 205188.
-
Jeffry SJM, Trjangganung K, Chandrakant AA, Madon B, Katende A, et al. (2020) Selection of suitable acid chemicals for matrix stimulation: a Malaysian Brown field scenario. Journal of Petroleum Science and Engineering 186: 106689.
-
Koochakzadeh A, Ashrafizadeh M, Sadeghnejad S (2021) Experimental evaluation of enhanced oil recovery by pH-sensitive microgels in carbonate formations. 82nd EAGE Annual Conference & Exhibition 2021: 1-5.
-
Koochakzadeh A, Teimouri A, Tohidi E, Ashrafizadeh M, Enzmann F, et al. (2023) Review on using pH-sensitive microgels as enhanced oil recovery and water shutoff agents: concepts, recent developments, and future challenges. Geoenergy Science and Engineering 223: 211477.
-
Wang L, Zhang Y, Luo R, Zou R, Deng H, et al. (2023) Lower limits of petrophysical parameters for effective reservoirs in ultradeep carbonate gas reservoirs: a case study from the Deng IV Member, Gaoshiti-Moxi Area, Sichuan Basin, SW China. Journal of Hydrology 621: 129657.
-
Katende A (2022) The Impact of Rock Lithology and Microstructural Properties on Proppant Embedment and Fracture Conductivity: A Case Study of the Caney Shale. Southern Oklahoma, USA.
-
Eyinla DS, Leggett S, Badrouchi F, Emadi H, Adamolekun OJ, et al. (2023) A comprehensive review of the potential of rock properties alteration during CO2 injection for EOR and storage. Fuel 353: 129219.
-
Sun Y, Zuo L, Li X, Liu X (2023) Enhancing shale gas recovery by carbon dioxide injection: a method of carbon capture, utilization, and storage (CCUS). Process Safety and Environmental Protection 179: 484-492.
-
Tariq Z, Mahmoud M, Abdulraheem A (2019) An artificial intelligence approach to predict the water saturation in carbonate reservoir rocks. SPE Annual Technical Conference and Exhibition, Canada.
-
Guo J, Ling Z, Xu X, Zhao Y, Yang C, et al. (2023) Saturation determination and fluid identification in carbonate rocks based on well logging data: a Middle Eastern case study. Processes 11(4): 1282.
-
Jani A, Dehkohneh HZ, Varnamkhasti SK, Farhadi A, Moghaddam MB (2023) Evaluation of Porous Media Using Digital Core Analysis by Pore Network Modeling Method: A Comprehensive Review. Journal of Chemical & Petroleum Engineering 57(2): 249-285.
-
Guo G, Diaz MA, Paz F, Smalley J, Waninger EA (2005) Rock Typing as an Effective Tool for Permeability and Water-saturation Modeling: A Case Study in a Clastic Reservoir in the Oriente Basin. SPE Annual Technical Conference and Exhibition, USA.
-
Archie GE (1952) Classification of Carbonate Reservoir Rocks and Petrophysical Considerations. Bulletin of the American Association of Petroleum Geologists 36(2): 278-298.
-
Ara T, Soran T, Vaziri H, Islam M (2001) In-Depth Investigation of the Validity of the Archie Equation in Carbonate Rocks. SPE Production and Operations Symposium, USA.
-
Guo Y, Pan B, Zhang L, Lei J, Fan Y, et al. (2022) A study on water saturation predictions in igneous reservoirs based on the relationship between the transverse relaxation time and the resistivity index. Journal of Petroleum Science and Engineering 208: 109519.
-
Alfosail KA, Alkaabi AU (1997) Water Saturation in Shaly Formation. Middle East Oil Show and Conference, Bahrain.
-
Bardon C, Pied B (1969) Formation Water Saturation in Shaly Sands. SPWLA 10th Annual Logging Symposium, USA.
-
Ahr WM, Hammel BS (1999) Identification and Mapping of Flow Units in Carbonate Reservoirs: An Example from Happy Spraberry (Permian) Field, Garza County Texas, USA. Energy Exploration & Exploitation 17(3/4): 311- 334.
-
Lucia FJ (1995) Rock-Fabric/Petrophysical Classification of Carbonate Pore Space for Reservoir Characterization. AAPG Bulletin 79(9): 1275-1300.
-
Eftekhari SH, Memariani M, Maleki Z, Aleali M, Kianoush P (2023) Hydraulic flow unit and rock types of the Asmari Formation in the Mansouri oilfield, an application of the Flow zone index and Fuzzy C-means clustering methods. Research Square.
-
Dunham RL (1962) Classification of Carbonate Rocks According to Depositional Texture. Memoir American Association Petroleum Geologists 1: 108-121.
-
Choquette PW, Pray LC (1970) Geological Nomenclature and Classification of Porosity in Sedimentary Carbonates. AAPG Bulletin 54(2): 207-244.
-
Lucia FJ (1983) Petrophysical Parameters Estimated from Visual Descriptions of Carbonate Rocks: A Field Classification of Carbonate Pore Space. Journal of Petroleum Technology 35(3): 629-637.
-
Gomes JS, Ribeiro MT, Strohmenger CJ, Negahban S, Kalam MZ (2008) Carbonate Reservoir Rock Typing - The Link between Geology and SCAL. Abu Dhabi International Petroleum Exhibition and Conference, UAE.
-
Pittman ED (1992) Relationship of Porosity and Permeability to Various Parameters Derived from Mercury Injection-Capillary Pressure Curves for Sandstone. AAPG Bulletin 76(2): 191-198.
-
Amaefule JO, Altunbay M, Tiab D, Kersey DG, Keelan DK (1993) Enhanced Reservoir Description: Using Core and Log Data to Identify Hydraulic (Flow) Units and Predict Permeability in Uncored Intervals/Wells. 68th SPE ATCE held in Houston, USA.
-
Leverett MC (1940) Capillary Behavior in Porous Solids. Transactions of the AIME 142(01): 152-169.
-
Jooybari HS, Mowazi GH, Jaberi SR (2010) A New Approach for Rock Tying Used in one of the Iranian Carbonate Reservoir (A Case Study). CPS/SPE International Oil and Gas Conference and Exhibition, China.
-
Xu WS, Luo PY, Sun L, Lin N (2016) A Prediction Model of the Capillary Pressure J-Function. Plos One 11(9): e0162123.
-
Kolodzie S (1980) Analysis of Pore Throat Size and Use of the Waxman-Smits Equation to Determine OOIP in Spindle Field, Colorado. SPE Annual Technical Conference and Exhibition, USA.
-
Talabani S, Boyd D, El Wazeer F, Al Arfi S (2000) Validity of Archie Equation in Carbonate Rocks. Abu Dhabi International Petroleum Exhibition and Conference, UAE.
-
Tiab D, Donaldson EC (2016) Naturally fractured reservoirs. Gulf Professional Publishing, pp: 415-481.
-
Sharawy EM, Gaafar RG (2019) Impacts of petrophysical properties of sandstone reservoirs on their irreducible water saturation: Implication and prediction. Journal of African Earth Sciences 156: 118-132.
-
Alsharhan AS, Kendall CGSC (1986) Precambrian to Jurassic Rock s of Arabian Gulf and Adjacent Areas: Their Facies, Depositional Setting, and Hydrocarbon Habitat. The American Association of Petroleum Geologists Bulletin 70(8): 977-1002.
-
Wang Y, Bandal MS, Moreno JE, Sakdilah MZ (2006) A Systematic Approach to Incorporate Capillary Pressure- Saturation Data into Reservoir Simulation. SPE Asia Pacific Oil and Gas Conference and Exhibition, Australia.
- Nigeria’s Vulnerability in the Face of Global Energy Policy
- A Simulation Study of Investigation of Optimum Oil Production Performance by Applying Various Gas Injection Methods in Oil Reservoir
- Characterization of Permo-Triassic Reservoirs through Thermal Maturity Assessment of Westphalian Source Rocks in the Cheshire Basin
- Influence of Microwax on the Rheological and Thermal Behaviour of a Wax Crude Oil
- Real-Time Monitoring and Performance Optimization of Steam Injection in Heavy Oil Reservoirs Using Fiber Optic Sensing and Integrated Predictive Simulation Models
- Rapid On-Site Determination of the Total Petroleum Hydrocarbon Content of Soils by Handheld Fourier Transform Near-Infrared Spectroscopy: Development of a Global, Site- and Scanner- Independent Calibration Model