New Relative Permeability Models for North American Sandstone Utilizing Artificial Neural Networks
Mathematical models and machine learning applications such as Artificial Neural Networks (ANN) have been adopted in hydrocarbon exploration, drilling, production, and reservoir engineering. Thanks to ample data sets and computing power, statistical analysis, analytics, and model prediction replace time-consuming and expensive laboratory measurements. This study used ANN to create two models for predicting water (krw) and oil (kro) relative permeability profiles for predominantly North American water-wet sandstone reservoirs. The developed model was compared to the Modified Corey and Ibrahim and Koederitz’s equations. The coefficient of multiple determination (R2) and Root-Mean-Square Error (RMSE) were used to evaluate the accuracy of the new model. The developed model showed a superior fit and can, therefore, be utilized to generate krw and kro profiles for North American water-wet sandstone reservoirs.
Introduction
The petrophysical properties of a reservoir rock are the characteristics that depict how these rocks hold or allow the transmissibility of reservoir fluids. These properties include porosity, relative permeability, and water saturation. The accurate determination of these properties helps petroleum engineers make accurate and precise reservoir deliverability predictions, production performance, and recovery factors [1].
Absolute permeability is the ability of a fluid to flow through a permeable rock when only one fluid saturates the pore spaces. For multiphase flow, effective permeability describes the ability of each fluid to flow in the porous medium. Relative permeability is the ratio of the effective to the absolute permeability and is one of the critical parameters in predicting two-phase flow and oil recovery. This multiphase flow in porous media has been a common phenomenon in the oil and gas industry [2]. Petroleum engineers use relative permeability, a non- linear fluid and rock property function, to predict fractional flow in reservoirs [3]. Zhang J, et al. [1] used experimental laboratory procedures and mathematical models to determine relative permeability. Guler B, et al. [3] cited four mathematical models, namely capillary, statistical, empirical, and artificial intelligence (AI).
Nowadays, Artificial Intelligence (AI) is gaining more popularity in developing predictive correlations because the prediction of petrophysical properties requires high accuracy and precision since variations in prediction may lead to loss of capital and time [4]. Most AI methodologies deploy the application of two algorithms: ANN and Adaptive Neuro-Fuzzy Inference System (ANFIS) [5]. In as much as these algorithms can be advantageous, their functionality may be limited since the source of wellbore data is sparse [6], and this, together with missing data, could lead to underfitting or overfitting in most scenarios. An ANN is a computational network that mimics the human brain neurons using similar pattern recognition [7]. The networks contain interconnected neurons composed of input, hidden, and output layers. About 70% of the data set is usually used in a ‘training phase’; the remaining 30% is used for validation and testing purposes to accurately predict the model output [8]. Artificial neural networks have shown promising results in predicting relative permeability [5, 9].
Literature Review
Corey AT, et al. [10] developed a correlation for determining relative permeability based on the works of Purcell and Burdine. Generalized models were later created from Corey’s equations to calculate the relative permeabilities of water and oil. These water and oil relative permeabilities (Equations 1 and 2) are applicable for water-wet sandstone reservoirs and will be used for comparison.
4 $$ k _ {r w} = \left(\frac {S _ {w} - S _ {w c}}{1 - S _ {w c}}\right) ^ {4} $$ w wc rw wc
- Oil-Gas Relative Permeabilities (for drainage relative to oil)
- Water-Oil Relative Permeabilities (for drainage relative to water)
- Type of formation kro krg kro krw
- Unconsolidated sand, well sorted
- (s*)3
- (1-S*)3
- (1-S* w)3
- (S* w)3
- Unconsolidated sand, poorly sorted
- (s*)3.5
- (1-S*)2 (1-S1.5)
- (1-Sw
- *)2 (1-Sw
- *1.5)
- (S* w)3.5
- Cemented sandstone, oolitic limestone
- (s*)4
- (1-S*)2 (1-S2)
- (1-Sw
- *)2 (1-Sw
- *2)
- (S* w)4
- Note
- S
- S
- S
- =
- − with
- (
- )
- *
- 1 o with
- (
- ) wc
Table 1: Oil-Gas and Water-Oil Relative Permeabilities [11,12].
Table 1 shows a set of equations by Ibrahim, et al. [11] and Kalam, et al. [12] for Oil-Gas and Water-Oil Relative Permeabilities. Wyllie suggested an empirical relative permeability model that was accurate for drainage flow in oolitic limestone, consolidated and unconsolidated sandstone [13] & Honarpour M, et al. [11]. These equations are shown in Table 1 and will be compared to our results.
( ) ( ) − − = − + − − − − −
S S S S k S S S S S S S
3.6 0.035388 0.010874 0.56556 1 1
w wc w or rw w w wc wc or wc or
Honarpour M, et al. [14] also developed empirical relative permeability correlations (Equations 3 and 4) that predicted accurate results. The authors used data from North American oilfields and oilfields from Libya, Iran, Argentina, and the United Arab Emirates. These equations were devised for carbonate and non-carbonate formations. Equations 3 and 4 will also be utilized for comparison purposes.
2.9 ( ) ( ) ( )
(3)
1.8 $$ S _ {o} = 0. 7 6 0 6 7 \left[ \frac {\left(\frac {S _ {o}}{1 - S _ {w c}}\right) - S _ {o r}}{1 - S _ {o r}} \right] ^ {1. 8} \left(\frac {S _ {o} - S _ {o r}}{1 - S _ {w c} - S _ {o r}}\right) ^ {2} + 2. 6 3 1 8 \phi \left(1 - S _ {o r}\right) \left(S _ {o} - S _ {o r}\right) $$ S S S S S k S S S S S S φ o or wc o or ro or o or or wc or
2 1 0.76067 2.6318 1 1 1
Where oS : = oil saturation, fraction and or S = residual oil saturation, fraction Ibrahim MNM, et al. [15] developed a comprehensive collection of models for relative permeability, utilizing normalized data that spans across various wettability conditions, as well as sandstone and carbonate reservoirs containing gas-condensate, gas-oil, gas-water, and oil- water systems. They deployed linear regression techniques ( ) ( ) ( ) ( )
3 * 1.6 2 5 * * 2 * 5 4 * 1.5
S k S S S S S S
w rw w or w or w or
0.22120304 0.24933592 21.370925 83.491972 $$ = 0. 2 2 1 2 0 3 0 4 \left(S _ {w} ^ {*}\right) ^ {1. 6} + 0. 2 4 9 3 3 5 9 2 S _ {o r} ^ {2} \frac {\left(S _ {w}\right)}{\phi} + 2 1. 3 7 0 9 2 5 \left(S _ {w} ^ {*}\right) ^ {2} S _ {o r} ^ {5} + 8 3. 4 9 1 9 7 2 \phi^ {4} \left(S _ {w} ^ {*}\right) ^ {5} S _ {o r} ^ {1. 5} - $$ ( ) ( ) ( )
4 2 2.3 3 * 2 * 3 *
( )( ) (4) to determine goodness of fit using the coefficient of determination (R2) values. R2 exceeded 0.6 for all the developed models. Their relative permeability equations (Equations 5 & 6) for water and oil will be used to compare the accuracy of the developed model.
φ φ (5)
0.4562939 1161.07198 8.7866012 ( ) ( ) ( ) ( ) ( ) ( ) ( )
3 2 10 3 0.4 * * 6
0.00000578 1 12.841061 $$ k _ {r o w} ^ {*} = 1 - 3. 0 9 0 9 9 6 S _ {w} ^ {*} + 2. 8 6 7 0 2 2 9 \left(S _ {w} ^ {*}\right) ^ {1. 6} - 0. 7 6 8 9 5 2 \left(S _ {w} ^ {*}\right) ^ {2} \tag {6} $$ $$ S _ {w} ^ {*} = \frac {S _ {w} - S _ {w c}}{1 - S _ {w c} - S _ {o}} $$ and φ = porosity, fraction where: * 1 w wc w wc orw ak = absolute permeability, mD Zhang J, et al. [1] used experimental laboratory procedures and mathematical models to successfully predict gas-water relative permeability using five core samples from a tight sandstone gas reservoir and observed that the relative permeability of gas decreased with increased pore pressure at constant water saturation. They also established that when the pore pressure remains the same, a decrease in the absolute permeability results in a decrease in gas-water relative permeability.
Artificial Neural Networks
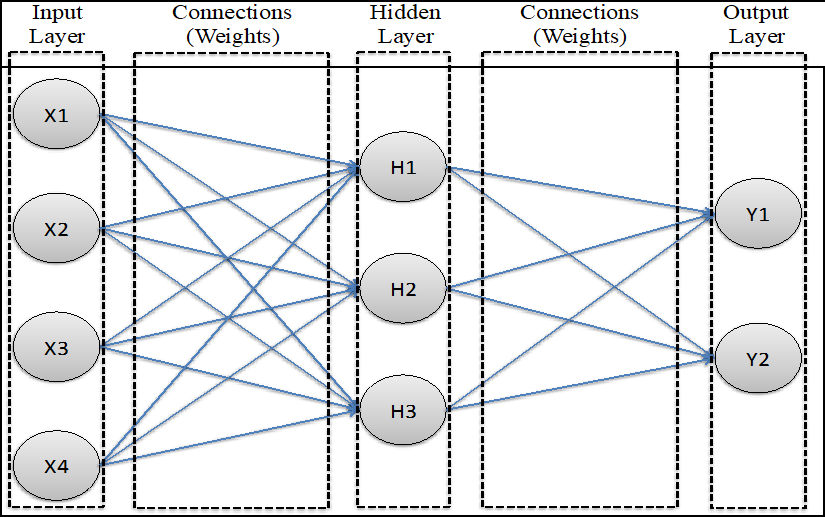
ANNs are structured with an input layer, one or more hidden layers, and an output layer. As depicted in Figure 1, a multi-layer perceptron is made up of processing units (nodes) that either provide a variable or execute mathematical functions. Nodes are interconnected across adjacent layers through links that embody weights. These weights undergo adjustments to refine the accuracy of the output predictions. The effectiveness of an ANN hinges on the optimization algorithms deployed during its training phase. Initially, connection weights start as random numbers ( ) ( ) and are methodically tweaked until the outputs generated by the model align with the actual dataset of outputs.
Data was separated into three sets: a training set, a validation set, and a testing set. Each model was trained on a randomly chosen training dataset. Each trained model’s performance was later evaluated on a randomly chosen validation set. The model with the best validation set’s performance was then selected and tested.
ANNs have been used to predict reservoir flow units and permeability, characterize reservoirs, evaluate increased oil recovery, and conduct downhole fluid analysis. Using the Lattice Boltzmann equation, Kamel E, et al. [16] developed an ANN model to predict the permeability reduction in rocks when polymer gel is injected. Guler B, et al. [3] proposed an ANN model that uses core data as inputs to predict oil- water relative permeability. Recent data-driven models [17] that predicted relative gas and water flow permeability with laboratory and field applications have also been published. This research, however, is similar to that of Guler B, et al. [3], with a primary focus on data from water-wet North American sandstone utilized to construct the ANN model.
Modeling Approach
Theory
This work uses two data sets to develop an ANN model using MATLAB. One set comprised core data from North American water-wet sandstone, and the second used published data from sandstone reservoirs. Each data set was regressed using three neurons. The following workflow was adopted:
- Transform the input variables based on their respective distributions.
- Randomly separate the training data set from data used for validation and testing.
- Initialize the analysis on the test data by assigning different neuron sizes (weights) that connect the input layer to the hidden layer and the hidden layer to the output layer.
- Perform a predetermined mathematical function (linear, hyperbolic tangent, or Gaussian) on each hidden node.
- Receive the output layer signal, which is relative permeability (predicted).
- Compare the predicted relative permeability to the actual known values.
- Adjust the neuron sizes.
- Use the validation and testing data sets to test the predictive capability of the ANN.
- Repeat steps 3-8 for a predetermined number of iterations.
- Output records results of the developed ANN models.
The number of iterations had to be adjusted manually to produce consistent results. The developed ANN models were later evaluated based on two performance indicators: R2 and Root Mean Square Error (RMSE). R2 is used to measure how close the data are to the fitted regression line, while RMSE is a good measure of how accurately the model predicts the response. It is the most important criterion for fit if the model’s primary purpose is prediction.
Experimental Data
MATLAB ANN fitting uses the two-layer feed forward fitting networking. The algorithm used for data training is the Levenberg-Marquradt algorithm. The data utilized in this study was extracted from Koederitz’s Relative Permeability Software Suite [18] and another published source [19]. To develop model 1, 18 data points for relative permeability to water and 18 for relative permeability to oil for North American water-wet sandstone reservoirs were used. Sixty- four data points from Feigl A, et al. [19] work were also utilized to develop Model 2. A total of 82 data points was then used to produce a global model. Each data set was regressed using 2,3,4, and 5 neurons.
Three neurons were enough to get a good fit. The two data sets were combined to find the regression results and the output. As shown in Tables 2 & 3, data set one and two contained information about Swc, Sor, ka, φ, Sw, So, Sw *, So * , krow and krw respectively.
| Sample # | S wc | S or | k a | φ | S w | S o | S * o | S * w | k row | k rw |
|---|---|---|---|---|---|---|---|---|---|---|
| 3 | 0.115 | 0.363 | 148 | 0.213 | 0.115 | 0.885 | 0.819 | 0 | 1 | 0 |
| 3 | 0.115 | 0.363 | 148 | 0.213 | 0.327 | 0.673 | 0.487 | 0.24 | 0.5 | 0.013 |
| 3 | 0.115 | 0.363 | 148 | 0.213 | 0.469 | 0.531 | 0.264 | 0.4 | 0.135 | 0.028 |
| 3 | 0.115 | 0.363 | 148 | 0.213 | 0.593 | 0.407 | 0.069 | 0.54 | 0.043 | 0.043 |
| 3 | 0.115 | 0.363 | 148 | 0.213 | 0.628 | 0.372 | 0.014 | 0.58 | 0.002 | 0.07 |
| 3 | 0.115 | 0.363 | 148 | 0.213 | 0.637 | 0.363 | 0 | 0.59 | 0 | 0.085 |
| 6 | 0.178 | 0.337 | 80 | 0.189 | 0.178 | 0.822 | 0.732 | 0 | 1 | 0 |
| 6 | 0.178 | 0.337 | 80 | 0.189 | 0.285 | 0.715 | 0.57 | 0.13 | 0.64 | 0.015 |
| 6 | 0.178 | 0.337 | 80 | 0.189 | 0.425 | 0.575 | 0.359 | 0.3 | 0.36 | 0.04 |
| 6 | 0.178 | 0.337 | 80 | 0.189 | 0.581 | 0.419 | 0.124 | 0.49 | 0.09 | 0.09 |
| 6 | 0.178 | 0.337 | 80 | 0.189 | 0.638 | 0.362 | 0.038 | 0.56 | 0.011 | 0.13 |
| 6 | 0.178 | 0.337 | 80 | 0.189 | 0.663 | 0.337 | 0 | 0.59 | 0 | 0.15 |
| 9 | 0.164 | 0.309 | 4.4 | 0.099 | 0.164 | 0.836 | 0.763 | 0 | 1 | 0 |
| 9 | 0.164 | 0.309 | 4.4 | 0.099 | 0.331 | 0.669 | 0.521 | 0.2 | 0.56 | 0.001 |
| 9 | 0.164 | 0.309 | 4.4 | 0.099 | 0.415 | 0.585 | 0.399 | 0.3 | 0.27 | 0.0054 |
| 9 | 0.164 | 0.309 | 4.4 | 0.099 | 0.498 | 0.502 | 0.279 | 0.4 | 0.086 | 0.01 |
| 9 | 0.164 | 0.309 | 4.4 | 0.099 | 0.574 | 0.426 | 0.169 | 0.49 | 0.018 | 0.018 |
| 9 | 0.164 | 0.309 | 4.4 | 0.099 | 0.615 | 0.385 | 0.11 | 0.54 | 0.003 | 0.022 |
| 9 | 0.164 | 0.309 | 4.4 | 0.099 | 0.691 | 0.309 | 0 | 0.63 | 0 | 0.037 |
Table 2: Relative permeability data for data set 1 (19 data points).
| Sample # | S wir | S orw | φ | k air | S w | S o | S * w | S * o | k row | k rw |
|---|---|---|---|---|---|---|---|---|---|---|
| 1 | 0.153 | 0.371 | 0.212 | 194 | 0.153 | 0.847 | 0 | 1 | 1.000 0 | 0.000 0 |
| 1 | 0.153 | 0.371 | 0.212 | 194 | 0.233 | 0.767 | 0.168 | 0.831933 | 0.425 0 | 0.088 0 |
| 1 | 0.153 | 0.371 | 0.212 | 194 | 0.291 | 0.709 | 0.29 | 0.710084 | 0.231 0 | 0.130 0 |
| 1 | 0.153 | 0.371 | 0.212 | 194 | 0.364 | 0.636 | 0.443 | 0.556723 | 0.095 0 | 0.227 0 |
| 1 | 0.153 | 0.371 | 0.212 | 194 | 0.386 | 0.614 | 0.489 | 0.510504 | 0.065 0 | 0.270 0 |
| 1 | 0.153 | 0.371 | 0.212 | 194 | 0.406 | 0.594 | 0.532 | 0.468487 | 0.049 0 | 0.305 0 |
| 1 | 0.153 | 0.371 | 0.212 | 194 | 0.434 | 0.566 | 0.59 | 0.409664 | 0.032 0 | 0.351 0 |
| 1 | 0.153 | 0.371 | 0.212 | 194 | 0.466 | 0.534 | 0.658 | 0.342437 | 0.022 0 | 0.410 0 |
| 1 | 0.153 | 0.371 | 0.212 | 194 | 0.527 | 0.473 | 0.786 | 0.214286 | 0.008 2 | 0.491 0 |
| 1 | 0.153 | 0.371 | 0.212 | 194 | 0.552 | 0.448 | 0.838 | 0.161765 | 0.005 0 | 0.518 0 |
| 1 | 0.153 | 0.371 | 0.212 | 194 | 0.578 | 0.422 | 0.893 | 0.107143 | 0.003 1 | 0.540 0 |
| 1 | 0.153 | 0.371 | 0.212 | 194 | 0.629 | 0.371 | 1 | 0 | 0.000 0 | 0.541 0 |
| 2 | 0.178 | 0.489 | 0.119 | 3.9 | 0.069 | 0.931 | 0 | 1.327327 | 1.000 0 | 0.000 0 |
| 2 | 0.178 | 0.489 | 0.119 | 3.9 | 0.236 | 0.764 | 0.3 | 0.825826 | 0.184 0 | 0.082 0 |
| 2 | 0.178 | 0.489 | 0.119 | 3.9 | 0.296 | 0.704 | 0.408 | 0.645646 | 0.101 0 | 0.129 0 |
| 2 | 0.178 | 0.489 | 0.119 | 3.9 | 0.338 | 0.662 | 0.483 | 0.51952 | 0.063 0 | 0.187 0 |
| 2 | 0.178 | 0.489 | 0.119 | 3.9 | 0.364 | 0.636 | 0.53 | 0.441441 | 0.044 0 | 0.231 0 |
| 2 | 0.178 | 0.489 | 0.119 | 3.9 | 0.39 | 0.61 | 0.576 | 0.363363 | 0.035 0 | 0.283 0 |
| 2 | 0.178 | 0.489 | 0.119 | 3.9 | 0.431 | 0.569 | 0.65 | 0.24024 | 0.024 0 | 0.346 0 |
| 2 | 0.178 | 0.489 | 0.119 | 3.9 | 0.544 | 0.456 | 0.853 | -0.0991 | 0.006 0 | 0.463 0 |
| 2 | 0.178 | 0.489 | 0.119 | 3.9 | 0.579 | 0.421 | 0.916 | -0.2042 | 0.003 0 | 0.507 0 |
| 2 | 0.178 | 0.489 | 0.119 | 3.9 | 0.626 | 0.374 | 1 | -0.34535 | 0.000 0 | 0.553 0 |
| 3 | 0.069 | 0.374 | 0.171 | 787 | 0.069 | 0.931 | 0 | 1 | 1.000 0 | 0.000 0 |
| 3 | 0.069 | 0.374 | 0.171 | 787 | 0.236 | 0.764 | 0.3 | 0.70018 | 0.184 0 | 0.082 0 |
| 3 | 0.069 | 0.374 | 0.171 | 787 | 0.296 | 0.704 | 0.408 | 0.59246 | 0.101 0 | 0.129 0 |
| 3 | 0.069 | 0.374 | 0.171 | 787 | 0.338 | 0.662 | 0.483 | 0.517056 | 0.063 0 | 0.187 0 |
| 3 | 0.069 | 0.374 | 0.171 | 787 | 0.364 | 0.636 | 0.53 | 0.470377 | 0.044 0 | 0.231 0 |
| Sample # | S wir | S orw | φ | k air | S w | S o | S * w | S * o | k row | k rw |
| 3 | 0.069 | 0.374 | 0.171 | 787 | 0.39 | 0.61 | 0.576 | 0.423698 | 0.035 0 | 0.283 0 |
| 3 | 0.069 | 0.374 | 0.171 | 787 | 0.431 | 0.569 | 0.65 | 0.35009 | 0.024 0 | 0.346 0 |
| 3 | 0.069 | 0.374 | 0.171 | 787 | 0.544 | 0.456 | 0.853 | 0.147217 | 0.006 0 | 0.463 0 |
| 3 | 0.069 | 0.374 | 0.171 | 787 | 0.579 | 0.421 | 0.916 | 0.084381 | 0.003 0 | 0.507 0 |
| 3 | 0.069 | 0.374 | 0.171 | 787 | 0.626 | 0.374 | 1 | 0 | 0.000 0 | 0.553 0 |
| 4 | 0.122 | 0.491 | 0.145 | 356 | 0.122 | 0.878 | 0 | 1 | 1.000 0 | 0.000 0 |
| 4 | 0.122 | 0.491 | 0.145 | 356 | 0.184 | 0.816 | 0.16 | 0.839793 | 0.211 0 | 0.244 0 |
| 4 | 0.122 | 0.491 | 0.145 | 356 | 0.19 | 0.81 | 0.176 | 0.824289 | 0.189 0 | 0.251 0 |
| 4 | 0.122 | 0.491 | 0.145 | 356 | 0.252 | 0.748 | 0.336 | 0.664083 | 0.102 0 | 0.305 0 |
| 4 | 0.122 | 0.491 | 0.145 | 356 | 0.366 | 0.634 | 0.63 | 0.369509 | 0.026 0 | 0.419 0 |
| 4 | 0.122 | 0.491 | 0.145 | 356 | 0.405 | 0.595 | 0.731 | 0.268734 | 0.012 0 | 0.476 0 |
| 4 | 0.122 | 0.491 | 0.145 | 356 | 0.437 | 0.563 | 0.814 | 0.186047 | 0.005 7 | 0.522 0 |
| 4 | 0.122 | 0.491 | 0.145 | 356 | 0.461 | 0.539 | 0.876 | 0.124031 | 0.002 9 | 0.569 0 |
| 4 | 0.122 | 0.491 | 0.145 | 356 | 0.47 | 0.53 | 0.899 | 0.100775 | 0.002 3 | 0.583 0 |
| 4 | 0.122 | 0.491 | 0.145 | 356 | 0.509 | 0.491 | 1 | 0 | 0.000 0 | 0.665 0 |
| 5 | 0.112 | 0.564 | 0.159 | 117 | 0.112 | 0.888 | 0 | 1 | 1.000 0 | 0.000 0 |
| 5 | 0.112 | 0.564 | 0.159 | 117 | 0.209 | 0.791 | 0.299 | 0.700617 | 0.221 0 | 0.157 0 |
| 5 | 0.112 | 0.564 | 0.159 | 117 | 0.222 | 0.778 | 0.34 | 0.660494 | 0.168 0 | 0.201 0 |
| 5 | 0.112 | 0.564 | 0.159 | 117 | 0.246 | 0.754 | 0.414 | 0.58642 | 0.110 0 | 0.240 0 |
| 5 | 0.112 | 0.564 | 0.159 | 117 | 0.283 | 0.717 | 0.528 | 0.472222 | 0.062 0 | 0.322 0 |
| 5 | 0.112 | 0.564 | 0.159 | 117 | 0.315 | 0.685 | 0.627 | 0.373457 | 0.032 0 | 0.398 0 |
| 5 | 0.112 | 0.564 | 0.159 | 117 | 0.333 | 0.667 | 0.682 | 0.317901 | 0.019 0 | 0.450 0 |
| 5 | 0.112 | 0.564 | 0.159 | 117 | 0.353 | 0.647 | 0.744 | 0.256173 | 0.011 0 | 0.502 0 |
| 5 | 0.112 | 0.564 | 0.159 | 117 | 0.377 | 0.623 | 0.818 | 0.182099 | 0.005 6 | 0.576 0 |
| 5 | 0.112 | 0.564 | 0.159 | 117 | 0.402 | 0.598 | 0.895 | 0.104938 | 0.002 5 | 0.648 0 |
| 5 | 0.112 | 0.564 | 0.159 | 117 | 0.417 | 0.583 | 0.941 | 0.058642 | 0.001 2 | 0.683 0 |
| 5 | 0.112 | 0.564 | 0.159 | 117 | 0.436 | 0.564 | 1 | 3.43E-16 | 0.000 0 | 0.716 0 |
| 6 | 0.103 | 0.485 | 0.143 | 13 | 0.103 | 0.897 | 0 | 1 | 1.000 0 | 0.000 0 |
| 6 | 0.103 | 0.485 | 0.143 | 13 | 0.178 | 0.822 | 0.182 | 0.817961 | 0.290 0 | 0.092 0 |
| 6 | 0.103 | 0.485 | 0.143 | 13 | 0.198 | 0.802 | 0.231 | 0.769418 | 0.212 0 | 0.140 0 |
| 6 | 0.103 | 0.485 | 0.143 | 13 | 0.235 | 0.765 | 0.32 | 0.679612 | 0.125 0 | 0.171 0 |
| 6 | 0.103 | 0.485 | 0.143 | 13 | 0.293 | 0.707 | 0.461 | 0.538835 | 0.045 0 | 0.233 0 |
| 6 | 0.103 | 0.485 | 0.143 | 13 | 0.367 | 0.633 | 0.641 | 0.359223 | 0.019 0 | 0.333 0 |
| 6 | 0.103 | 0.485 | 0.143 | 13 | 0.43 | 0.57 | 0.794 | 0.206311 | 0.007 3 | 0.430 0 |
| 6 | 0.103 | 0.485 | 0.143 | 13 | 0.472 | 0.528 | 0.896 | 0.104369 | 0.002 9 | 0.501 0 |
| 6 | 0.103 | 0.485 | 0.143 | 13 | 0.495 | 0.505 | 0.951 | 0.048544 | 0.001 2 | 0.539 0 |
| 6 | 0.103 | 0.485 | 0.143 | 13 | 0.515 | 0.485 | 1 | 0 | 0.000 0 | 0.630 0 |
Table 3: Relative permeability data for data set 2 (64 data points).
Model Development and Discussion
In this work, data was divided into three data sets: one for training, one for validation, and another for testing. So, during the process, about 70% of the data was used for training, 15% for validation, and the remaining 15% for testing.
Phase 1 – ANN Models for Data Set 1 and Data Set 2
Model testing began by attempting to create a single (combined) ANN model that would simultaneously predict water and oil relative permeabilities. The input data were Swc, Sor, ka, φ, Sw, and So. Some of these variables depend on each other. The interdependency would reduce the degree of error, enhance linearity, produce a better fit, and make the ANN model more valuable as a prediction tool. The input and output layer structures remained consistent while exhibiting satisfactory R2 values for oil. These were between 0.93 and 0.95. The degree of fit for water was relatively low, with R2 values of around 0.63. Increasing the R2 for water was the primary goal for further testing. Guler B, et al. [3] found that using normalized fluid saturations increased the accuracy of the ANN models. Normalizing saturations led to amplified model linearity, reduced the degree of error, and enhanced the degree of fit. This method was adapted for Phase 1, and Equations 7 and 8 were included as input parameters. Phase 1 analysis using ANN began with the hidden layer structure of ANN in MATLAB with eight inputs and ten hidden layers [20, 21].
$$ S _ {o} ^ {*} = \frac {S _ {o} - S _ {o}}{1 - S _ {o r}} $$
* 1 o or o or
(7) $$ S _ {w} ^ {*} = \frac {S _ {w} - S _ {w}}{1 - S _ {w c}} $$
* 1 (8) w wc w wc
Using the first data set, the obtained R2 for water was high. R2 was 0.9902 for training, 0.9999 for validation, and 0.9920 for testing (Table 4). The R2 for oil was also satisfactory, with an overall value of 0.9881.
| Data Used for | No. of Data Points | RMSE-Oil | R2-Oil | RMSE-Water | R2-Water |
|---|---|---|---|---|---|
| Training | 12 | 8.21 x 10⁻⁴ | 0.9987 | 1.89 x 10⁻⁵ | 0.9902 |
| Validation | 3 | 3.38 x 10⁻³ | 0.9955 | 1.04 x 10⁻⁶ | 0.9999 |
| Testing | 3 | 1.38 x 10⁻² | 0.9999 | 6.76 x 10⁻⁵ | 0.992 |
| All data | 18 | 0.9881 | 0.9939 |
Table 4: Phase 1 ANN Results for Data set 1.
| Number of Neurons | R2 |
|---|---|
| 2 | 0.9923 |
| 3 | 0.9881 |
| 4 | 0.9985 |
| 5 | 0.9944 |
Table 5: Regression Values with Different Number of Neurons.
As shown in Table 5, the same data was regressed using
2, 3, 4, and 5 neurons for comparison purposes. Variability of the coefficient of determination, R2, was minimal, ranging between 0.9881 to 0.9985.
Three neurons were randomly chosen, and changing the number of neurons did not impact the degree of fit. Therefore, the second 64 data set was analyzed in ANN MATLAB using three neurons. The R2 for oil was satisfactory, with an overall value of 0.9832. The R2 for water was 0.9792 for training, 0.9738 for validation, and 0.9802 for testing as depicted in Table 6.
| Data Used for | No. of Data Points | RMSE-Oil | R2-Oil | RMSE-Water | R2-Water |
|---|---|---|---|---|---|
| Training | 44 | 1.52 x 10⁻³ | 0.9939 | 1.69 x 10⁻³ | 0.9792 |
| Validation | 10 | 1.15 x 10⁻² | 0.9946 | 2.28 x 10⁻³ | 0.9738 |
| Testing | 10 | 5.72 x 10⁻⁵ | 0.9821 | 2.81 x 10⁻³ | 0.9802 |
| All data | 64 | 0.9832 | 0.9749 |
Table 6: Phase 1 ANN Results for Data Set 2.
Phase 2 – Global ANN Model with Combined Data Sets 1 and 2
The two data sets were combined. This method was utilized to widen the range of the data and globalize the developed model. The hidden layer structure was maintained at ten layers and eight inputs. Combining the data improved R2 values of both oil and water, as seen in Table 7. The experiment was then concluded.
| Data Used for | No. of Data Points | RMSE-Oil | R2 - Oil | RMSE-Water | R2 - Water |
|---|---|---|---|---|---|
| Training | 58 | 5.39 x 10⁻⁵ | 0.9997 | 1.9 x 10⁻³ | 0.9802 |
| Validation | 12 | 1.41 x 10⁻³ | 0.9927 | 1.29 x 10⁻³ | 0.9932 |
| Testing | 12 | 2.96 x 10⁻² | 0.9948 | 4.51 x 10⁻³ | 0.9739 |
| All data | 82 | 0.9769 | 0.9776 |
Table 7: Phase 2 ANN Results for the Combined Data Set.
Model Comparison
The developed model was compared to Modified Corey’s
and Ibrahim and Koederitz’s. The following table compares RMSE values for the new model and the correlations mentioned above.
| ANN Oil | ANN Water | Modified Corey | Ibrahim & Koederitz | |||||
|---|---|---|---|---|---|---|---|---|
| Training | Validation | Training | Validation | Training | Validation | Training | Validation | |
| RMSE | 5.39E-05 | 0.00141 | 0.0019 | 0.00129 | 0.237 | 0.322 | 0.143 | 0.233 |
Table 8: A Comparison between the Training and Validation RMSE.
As such, the new model showed better results and can be used to predict relative permeability to water and oil for sandstone formations within the tested data range.
Conclusions
Model testing was first attempted with six variables, namely Swc, Sor, ka, φ, Sw, and So, for data set 1 (18 data points). The degree of fit for kro was high, with an R2 that ranged between 0.93 and 0.95.
However, the degree of fit for krw was low, with an R2 of only 0.63. Eight variables were later used with normalized water and oil saturations to improve the model’s fit. Using the first data set, the overall R2 improved for krw and kro to 0.9939 and 0.9881, respectively. Using 2, 3, 4, and 5 neurons did not affect model’s fit.
Using a different data deck (data set 2 with 64 data points), the overall R2 for water and oil with ten hidden layers and three neurons was high, with values of 0.9749 and 0.9832, respectively.
All data (82 data points) has also been used to globalize the model. These data sets were enough to accurately predict the relative permeability of the North American Sandstone.
R2 values for water and oil showed an excellent fit with values of 0.9776 and 0.9769, respectively. The RMSE values for both models were extremely low and came close to zero for training and validation compared to the Corey Ibrahim and Koederitz models.
Acknowledgements
Not applicable.
Competing Interests
The authors declare that they have no competing interests.
Availability of Data and Materials
The data supporting the conclusions of this paper are included within the paper. Any queries regarding these data may be directed to the corresponding author.
Code Availability (Software Application or Custom Code Used)
N/A
Consent for Publication
Authors have agreed to submit it in its current form for publication in the journal.
Ethics Approval and Consent to Participate
Not applicable. No test, measurements or experiments on animals were performed as part of this work.
Funding
This research was not funded.
References
-
Zhang J, Gao S, Xiong W, Ye L, Liu H, et al. (2023) An improved experimental procedure and mathematical model for determining gas-water relative permeability in tight sandstone gas reservoirs. Geoenergy Science and Engineering 221: 211402.
-
Hemmati N, Borazjani S, Yang S, Badalyan A, Genolet L, et al. (2022) Laboratory validation of steady-state- transient test to determine relative permeability and capillary pressure. Fuel 321: 123940.
-
Guler B, Ertekin T, Grader AS (2003) An Artificial Neural Network Based Relative Permeability Predictor. Petroleum Conference of the South Saskatchewan Section, Regina, Canada.
-
Tariq Z, Mahmoud M, Abdulraheem A (2019) An intelligent data-driven model for Dean–Stark water saturation prediction in carbonate rocks. Neural Computing and Applications 32(15): 11919-11935.
-
Kalam S, Khan M, Khan RA, Alam MM, Sadeed A, et al. (2020) Advancing relative permeability estimation through data-driven modeling. Abu Dhabi International Petroleum Exhibition & Conference, Abu Dhabi, UAE.
-
Han J, Xue L, Wei Y, Qi Y, Wang J, et al. (2023) Physics-informed neural network-based petroleum reservoir simulation with sparse data using domain decomposition. Petroleum Science 20(6): 3450-3460.
-
Yang ZR, Yang Z (2014) Artificial Neural Networks. Comprehensive Biomedical Physics 6: 1-17.
-
Al-Alawi S, Kalam MZ, Al-Mukhaini M (1996) Application of Artificial Neural Networks to predict Wettability and Relative Permeability of Sandstone Rocks. Engineering Journal of Qatar University 9: 29-43.
-
Yoga HF, Purswani P, Johns RT (2022) Predictive Model for Relative Permeability Using Physics-Based Artificial Neural Networks. SPE Improved Oil Recovery Conference, Virtual.
-
Corey AT (1954) The Interrelation between Gas and Oil Relative Permeabilities. Producers Monthly 19: 38-41.
-
Honarpour M, Koederitz LF, Harvey AH (1986) Relative Permeability of Petroleum Reservoirs. 1st(Edn.), CRC Press Inc, Florida.
-
Frick T (1962) Petroleum Production Handbook. Society of Petroleum Engineers, Dallas, USA.
-
Wyllie M, Gardner G (1958) Permeability and the Size Distribution of Pores. Nature 181: 477.
-
Honarpour M, Koederitz LF, Harvey AH (1982) Empirical Equations for Estimating Two-Phase Relative Permeability in Consolidated Rock. J Pet Technol 34(12): 2905-2908.
-
Ibrahim MNM, Koederitz LF (2000) Two-Phase Relative Permeability Prediction Using a Linear Regression Model. SPE Eastern Regional Meeting, Morgantown, West Virginia, USA.
-
Kamel E, Niri ME, Zitha PL (2023) Design of Artificial Neural Network for predicting the reduction in permeability of porous media as a result of polymer gel injection. Geoenergy Science and Engineering 227: 211925.
-
Singh H, Myshakin EM, Seol Y (2020) A Novel Relative Permeability Model for Gas and Water Flow in Hydrate- Bearing Sediments with Laboratory and Field-Scale Application. Scientific Reports 10(1): 5697.
-
Koederitz LF (2000) Relative Permeability Suite.
-
Feigl A (2011) Treatment of relative permeabilities for application in hydrocarbon reservoir simulation model. Nafta 62(7-8): 233-243.
-
Ahmed T (2019) Reservoir Engineering Handbook. 5th (Edn.), Gulf Professional Publishing, pp: 167-172.
-
SAS JMP Pro 12 (computer software) (2015).
- Nigeria’s Vulnerability in the Face of Global Energy Policy
- A Simulation Study of Investigation of Optimum Oil Production Performance by Applying Various Gas Injection Methods in Oil Reservoir
- Characterization of Permo-Triassic Reservoirs through Thermal Maturity Assessment of Westphalian Source Rocks in the Cheshire Basin
- Influence of Microwax on the Rheological and Thermal Behaviour of a Wax Crude Oil
- Real-Time Monitoring and Performance Optimization of Steam Injection in Heavy Oil Reservoirs Using Fiber Optic Sensing and Integrated Predictive Simulation Models
- Rapid On-Site Determination of the Total Petroleum Hydrocarbon Content of Soils by Handheld Fourier Transform Near-Infrared Spectroscopy: Development of a Global, Site- and Scanner- Independent Calibration Model