How well do Parent, Clinician and objective Measures of Hyperactivity in the Office Correlate with Actigraph Measures at Home and at School in Typically Developing Controls and Children Evaluated for ADHD?
Clinicians evaluating children for ADHD frequently rely on parental reports and their own impressions in assessing hyperactivity. However, it is well known that parental ratings only correlate modestly with teacher ratings. An alternative means of assessing hyperactivity in the office are tests that use motion tracking devices to quantify how much children fidget during a cognitive control attention task (e.g. QuotientTM ADHD System). We sought to ascertain whether clinician, parent and office-based objective measures correlated with hourly levels of activity assessed over 3-5 school days by belt-worn actigraphs in 83 unmedicated children (10.6±3.1 years), including 15 typically developing controls and 68 being evaluated for ADHD. Overall, there was no significant correlation between clinician ratings of hyperactivity and actigraph measures at any time. Parent ratings only correlated with actigraph measures at 6-7 AM. In contrast, the QuotientTM Hyperactivity Index correlated with actigraph measures at 9-12AM, 1-3, 4-5, and 6-9 PM. Parent and clinician ratings were highly correlated with each other but only correlated modestly with the QuotientTM Hyperactivity Index (r = 0.318 and 0.298, respectively, both p < 0.01). Hyperactivity, as an objectively quantifiable sign of psychopathology was not well captured by parent or clinician ratings. Likely, this is due to parents and clinicians focusing not only on levels of movement or difficulty sitting still but also on the intrusiveness of the behavior. This may lead to false negative evaluations in children who fidget less intrusively and to false positive evaluations in children with oppositional or disruptive behaviors.
Introduction
Attention-deficit hyperactivity disorder (ADHD) is a common childhood psychiatric disorder that is characterized by three main symptoms of hyperactivity, deficient impulse control and problems with attention [1, 2]. Three to 9 percent of the school-age children are estimated to be affected by ADHD [3, 4, 5]. Furthermore, 40 percent of the individual with childhood ADHD carry their disorder into their adulthood [6]. Previous studies have found the pervasive impact of ADHD on psychological and social problems. ADHD accounted for 10 times more incidence of antisocial personality disorder [6, 7], up to 5, 25, and 9 times more risk of drug abuse [8, 6], institutionalization for delinquency [9], and incarceration [10], respectively. ADHD is characterized by behavioral signs and symptoms that are observable, though not necessarily in the clinician's office. The evaluations are typically based on the ratings and impressions of adult informants. Parents and teachers are considered to be credible sources [11, 12] and clinicians would often rely on their observation for diagnosis. However, studies consistently report low rates of agreement between teachers and parents ratings [13, 14, 15, 16]. These discrepancies in ratings may arise from behavioral variability and demands in different situations [17]. In fact, based on activity level measurements with monitors, children with ADHD were no more active than controls when allowed to play [18]. Instead differences between children with ADHD and controls were greatest during structured school tasks [18]. Therefore, it seems that hyperactivity in children with ADHD manifests most distinctively during activities which require them to engage while they stay relatively still [19, 20], and that what we refer to as 'hyperactivity' may be more of a failure to consistently habituate activity to low levels in situations where this is expected [20]. To focus on this inability, Teicher et al. [20] created a system that measures movements of children when they are required to remain seated during a monotonous, repetitive task. This system, called QuotientTM, uses an infrared motion analysis system to capture the precise head movements of children while they perform a Go-NoGo task and was previously called OPTAXTM and the McLean Motion and Attention Test (MMATTM). Teicher, et al. [20] has reported that during this task, children with ADHD spent 66% more time moving than normal children, moved their head 2.3 times more often and 3.4 times as far. They covered a 3.8 times greater area and their movement was characterized by a 44.5% more linear and less complex pattern in space. Furthermore, detailed analysis of head movements during the task revealed that children with ADHD had diminished ability to inhibit activity to low levels and to maintain stable control of their head position [21]. The measures related to positional stability (Maximal Lyapunov Exponent) discriminated ADHD and controls with perfect accuracy (p<10-50, F1,121 = 676.3; P<.001; Cohen d' = 4.71; ROC = 1.0). Discrimination accuracy using inhibitory control (spike amplitude) was high as well (p<10-6, F1, 121 = 27.4; P<; Cohen d' = 0.95; ROC = 0.799). The measures from QuotientTM however, did not correlate with parent ratings of children with ADHD on the abbreviated Conners scale or the Overactivity - Inattention component of the IOWA Conners [20]. In contrast, there were significant correlations between complexity of movement and teacher ratings on the abbreviated Conners scale and on the Overactivity - Inattention component of the IOWA Conners scale in the ADHD group [20]. When parent and teacher ratings were compared, there was only a non-significant correlation (r=0.396) between parent and teacher ratings on the Overactivity - Inattention component of the IOWA Conners. Given these discrepancies between parents and teacher ratings a question arises regarding their validity. Initially it was thought that teachers had more exposure to children in general and had a more accurate perspective. However, it also became clear that teacher's can sometimes be biased and tended to indicate much more severe problems in boys than girls [22, 23]. Further, question arises whether sensor technologies provide an unbiased and meaningful metric. Barkley [1] defined "ecological validity" as the extent to which the results of laboratory measures could be generalized to the actual behaviors in real world settings. Our aim of this study was to investigate the ecological validity of office-based ratings from parents, clinicians or motion sensory technology to determine if they were predictive of the child's level of motor activity at school and at home. For this analysis we used a heterogeneous clinical sample that included subjects with ADHD with and without comorbid mood disorders and a subthreshold group with some ADHD symptoms but not enough to meet full criteria. We did this to sample the full range of potential activity levels rather than picking subjects at the extremes. Hence, we compared parent ratings on the Conners’ Hyperactivity Index [24], clinician ratings on the ADHD Rating Scale-IV defined in DSM-IV (ADHD-RS) and composite infrared measures of activity on the 15-20 minute QuotientTM
ADHD system to hourly actigraph measures captured over a 3-5 day period during the school week.
Methods
Subjects
Children between the ages of 5 to 18 were recruited via advertisements from the general population. Parental written consent and child verbal assent were obtained. This study was approved by the McLean Hospital institutional review board and was run by a clinical research program in a university-affiliated, major psychiatric hospital located in a suburban city. Subjects and parents were interviewed by trained mental health professionals (psychiatrists, Ph.D. psychologists, clinical nurse specialists). Children in good physical health who were diagnosed with ADHD (with or without comorbid depressive disorders) and typically developing controls were included in the study. The diagnostic assessments were conducted based on DSM-IV criteria for ADHD. The structured interviews were conducted using the Kiddie Schedule for Affective Disorder and Schizophrenia for School-Age Children, Present and Lifetime Version [25]. Parent ratings on the Conners’ Hyperactivity Index [24], ADHD-RS and Achenbach Child Behavior Checklist [26] were collected. Children who had major mood disorder, psychosis, tic disorder, a major anxiety disorder, or mental retardation were excluded from the study. Children with oppositional defiant disorder, mild anxiety, or reported learning disorders were able to participate. Assessments were performed when the children were free of medication for at least 18 hours. Parents were asked to have their children off medication for the duration of actigraph measurements that was a minimum of 3 days and a maximum of 5 days.
Actigraphy
Actigraph (mini-motionlogger or motionlogger watch, Ambulatory Monitoring, Inc.) was kept in a pouch attached to a belt worn around the children's waist. The measurements were collected during the days of the school week from Monday to Friday and not on weekends. Parents recorded daily logs when the monitor was removed (e.g., for bathing) and times of unusual activity (e.g., horseback riding, driving in a car on a bumpy road) that can produce artifactual results to identify and reject data during those periods for analysis. The daily log included bedtimes and rise times as well. The artifacts were identified and rejected by hand prior to data analysis by a skilled technician who was blind to diagnosis. Activity was recorded in zero-crossing mode (2-3Hz filter, sensitivity 0.01G force at mid band). Data were downloaded and zero crossing counts for each minute was used for further analysis.
QuotientTM
QuotientTM test was specifically designed to provide objective measures of hyperactivity, inattention and impulsivity. Children younger than 13 years of age were instructed to sit at a computer and to press a space bar when he/she sees an 8-sided star and not to press anything when a 5-sided star was presented. Children were seated on a chair without back support, adjusted so that they were comfortable with both feet on the floor with knees bent at a right angle. Their hand rested on the desk with fingers poised directly above the space bar. The computer screen was adjusted so that the screen height was positioned at eye level. Stars were presented briefly (200 milliseconds), at random screen positions, every 2 seconds. Duration of the task was 15 minutes. During this task a small reflective marker was worn on a headband while the infrared motion analysis system tracked and recorded the vertical and horizontal position of a marker (0.04-mm resolution) [20]. Adolescents completed a similar but more complex Go-NoGo task in which they were instructed to press the space bar for 5, 8 and 16- pointed stars, but to not press for 4-pointed stars. Stars were presented for 240 msec, in random screen positions, with variable inter stimulus interval (1000 to 4000 milliseconds). The Quotient™ system provides 6 measures of hyperactivity, 6 conventional CPT measures of attention, and 5 novel measures examining fluctuations in attention state [27]. The system also provides overall composite hyperactivity, inattention and global severity scores. For this study we used the composite hyperactivity measures. This index is based on four activity measures (movements, displacement, area, immobility duration) that vary linearly with severity and is scaled from 0 – 10.
Statistics
Differences between ADHD and controls for parent, clinician ratings, QuotientTM score and actigraph counts of 10 most active hours were assessed using analysis of covariance (ANCOVA) with age as a covariates. Comparisons between subgroups of ADHD were corrected for multiple comparisons using Benjamini & Hochberg’s [28] false discovery rate, which controls the expected proportion of errors among the rejected hypotheses. Partial correlations were performed using Pearson correlation adjusted by age.
Results
The sample consisted of 83 subjects (49M/34F, 10.6± 3.1 years), 45 with ADHD combined or predominantly hyperactive/ impulsive subtypes (ADHD Combined) (32M/13F, 9.8±2.7 years), and 15 typically developing controls (2M/13F, 13.3±2.8 years) based on structured diagnostic interviews. In addition, there were 12 subjects (6M/6F, 10.0±3.0 years) who had some ADHD symptoms but fell short of meeting full criteria (ADHD Sub threshold), and 11 (9M/2F, 10.0±3.3 years) subjects with ADHD plus comorbid mood or anxiety disorders (ADHD + Mood). As seen in Table 1 there were significant differences between healthy controls and subjects meeting full or partial criteria for ADHD in symptoms of hyperactivity as assessed by parent ratings, clinician ratings and QuotientTM. Interestingly, differences between controls and the heterogeneous clinical sample were not significantly different in mean of their 10 most active hours on actigraphy.
| Measures | Suspected ADHD | Control | F value | P value | Effect Size | ||||||||||||
| Parent ratings | 8.97 ±4.5 | 3.08 ± 4.8 | 17.8 | <10-4 | 1.29 | ||||||||||||
| Clinician ratings | 11.08 ± 5.3 | 2.63 ± 5.6 | 27.0 | <10-5 | 1.58 | ||||||||||||
| QuotientTM score | 6.88 ± 2.3 | 4.47 ± 2.5 | 11.3 | <0.002 | 1.03 | ||||||||||||
| Actigraph 10 most active hours | 13187 ± 2298 | 12098 ± 2447 | 2.36 | >0.1 | 0.47 |
Table 1: Partial correlation (adjusting for age) between measures and ratings of hyperactivity and composite actigraph measure (N
Table1: Differences between suspected ADHD and Control groups in parent, clinician ratings, QuotientTM score and actigraph counts of 10 most active hours (Values are corrected for age). Table 2 shows the values and differences between the subgroups of ADHD. Compared to the ADHD Combined group and the ADHD + Mood group, the ADHD Sub threshold group had significantly lower parent and clinician ratings. There were no significant differences between the ADHD subgroups in mean levels of hyperactivity measured by QuotientTM or actigraph.
| ADHD | ADHD Sub- | |||||||||||||||||||||||||||||||
|---|---|---|---|---|---|---|---|---|---|---|---|---|---|---|---|---|---|---|---|---|---|---|---|---|---|---|---|---|---|---|---|---|
| ADHD | ||||||||||||||||||||||||||||||||
| Measures | Combined | threshold | 1 vs 2 | 1 vs 3 | 2 vs 3 | Group | Age | Sex | ||||||||||||||||||||||||
| +Mood (2) | ||||||||||||||||||||||||||||||||
| (1) | (3) | |||||||||||||||||||||||||||||||
| Mean ±SD | Mean ±SD | Mean ±SD | P value | P value | P value | F val | P val | F val | P val | F val | P val | |||||||||||||||||||||
| Parent ratings | 10.3±4.1 | 10.9±4.2 | 5.1±4.2 | >0.9 | <0.004 | <0.02 | 8.06 | <0.004 | 23.7 | <10-3 | 4.64 | <0.09 | ||||||||||||||||||||
| Clinician ratings | 12.2±4.9 | 14.6±5.0 | 5.8±5.0 | >0.4 | <0.004 | <0.002 | 10.4 | <0.001 | 10.4 | <0.007 | 0.44 | >0.6 | ||||||||||||||||||||
| QuotientTM score | 7.0±2.3 | 5.9±2.3 | 7.5±2.3 | >0.4 | >0.8 | >0.3 | 1.43 | >0.3 | 3.23 | >0.1 | 2.87 | >0.1 | ||||||||||||||||||||
| Actigraph 10 most active hours | 13349±2144 | 12776±2156 | 14564±2177 | >0.8 | >0.3 | >0.2 | 2.12 | >0.2 | 34.7 | <10-5 | 0.11 | >0.8 |
Table 2: Partial correlation (adjusting for age) between measures and ratings of hyperactivity and composite actigraph measure (N
Table2: ADHD subgroup differences using ANCOVA, corrected for multiple comparisons with Benjamini and Hochberg method (Hochberg & Benjamini, 1990). Table 3 Indicates the degree of partial correlation (adjusting for age) between these different measures of hyperactivity and a composite actigraph measure. The cross-correlations were significant between QuotientTM, parent ratings and clinician ratings, with the greatest degree of correlation between parent and clinician ratings (r=0.663, p < 10-14). QuotientTM ratings correlated with an overall actigraph measure of hyperactivity whereas clinician and parent ratings did not.
| Clinician | QuotientTM | |||||||||||
|---|---|---|---|---|---|---|---|---|---|---|---|---|
| Measures | Parent ratings | |||||||||||
| ratings | score | |||||||||||
| Parent ratings | Correlation p-value | - | - | 0 | ||||||||
| Clinician ratings | Correlation p-value | 0.663 <10-14 | - | - | ||||||||
| QuotientTM score | Correlation p-value | 0.318 <0.01 | 0.293 <0.01 | - | ||||||||
| Actigraph 10 most active hours | Correlation p-value | -0.032 0.8 | 0.038 0.7 | 0.316 <0.003 |
Table 3: Partial correlation (adjusting for age) between measures and ratings of hyperactivity and composite actigraph measure (N
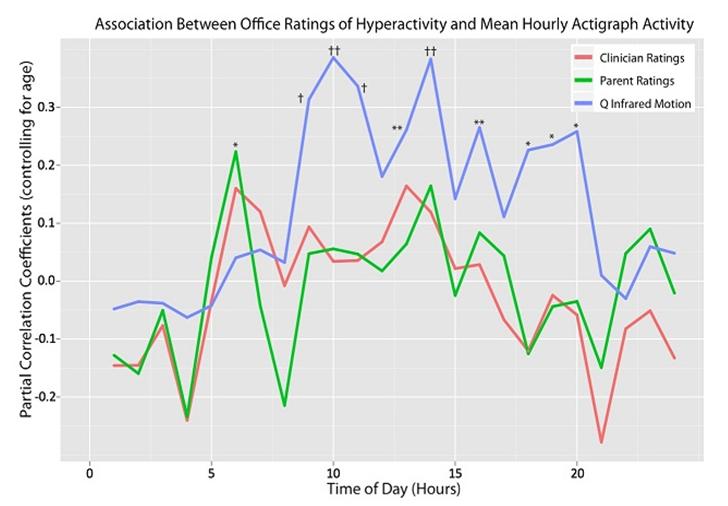
Table 3: Partial correlation (adjusting for age) between measures and ratings of hyperactivity and composite actigraph measure (N=83). Figure 1 illustrates the degree of partial correlation (adjusting for age) between ratings of hyperactivity in the office and actigraphy measures of activity during each hour of the day. Overall, there were significant correlations between level of activity quantified in the office using QuotientTM and actigraph measures at 9-10, 10-11 AM, 11-Noon, 1-2, 2-3, 4-5, 6-7, 7-8 and 8-9 PM. Parent ratings only correlated with actigraph measures at 6-7 AM. Clinician ratings did not correlate with actigraph measures at any time point.
Discussion
We sought to address how well parent and clinician ratings of hyperactivity in the office correlated with objective measures of activity in healthy controls and children suspected or found to meet criteria for ADHD. Specifically, we used actigraphs to provide an index of psychomotor activity during school and home activities. Interestingly, there was no significant correlation between parent ratings and overall actigraph measures, and only one time point when parent ratings correlated with actigraph ratings at a specific time (6AM-7AM). Similarly, clinician ratings (which correlate very strongly with parent ratings) did not correlate with overall actigraph measures or actigraph measures during any specific time of the day. In contrast, QuotientTM Hyperactivity Measures obtained in the office correlated significantly with overall actigraph measures and correlated with actigraph measures at multiple time points between 9 AM and 9 PM with the exception of ratings between noon-1 PM, 3-4 and 5-6 PM. This suggests that parent and clinician ratings may not provide good insight into a child’s level of activity at home or at school, at least that aspect of a child’s activity that can be captured using actigraphs. In contrast, QuotientTM Hyperactivity Index obtained in the office at one time point provided a general measure that correlated at times when children might be expected to be seated and reasonably still. The times when it did not correlate were likely periods involving lunch, school dismissal and perhaps play periods. The ADHD Subthreshold group had significantly lower parent and clinician's ratings compared to ADHD Combined and ADHD + Mood group. Interestingly, levels of hyperactivity measured objectively by QuotientTM and actigraphs showed that the ADHD Subthreshold group was at least as hyperactive as the other groups. This suggests that some children who may be objectively hyperactive may not be rated as hyperactive by parents or clinicians. This brings up a critical difference between objective and subjective ratings of hyperactivity. Actigraphs and QuotientTM specifically assess the amount and extent of movement. Abikoff, et al. [29] found that human ratings of activity were markedly influenced by the valence of a child’s behavior. Hence, children who behaved in an oppositional manner were rated as more hyperactive than children moving to the same degree who were not oppositional. In short, the actigraph and QuotientTM likely provide relatively pure measures of activity while parent and clinician ratings provide a mixed picture that reflects both their degree of movement and degree of disruption. Both perspectives are valuable clinically. Objective measures of activity provide a target symptom that is highly responsive to medication, potentially has value in titrating dosage [27, 30, 31, 32], correlates with indirect measures of regional blood flow [33, 34] and dopamine D2 receptor density in caudate [35]. Human ratings, on the other hand, capture an additional quality that may lead to children being singled out by teachers or peers, and result in humiliation or disciplinary actions. We have noticed clinically that, children who appear hyperactive on rating scales but not on QuotientTM almost invariably meet criteria for oppositional defiant disorder or conduct disorder. This leads us to suspect that children diagnosed as subthreshold in this study by DSM-IV criteria were less disruptive than children meeting full criteria but still may have significant problems sitting still or regulating motor activity and may benefit from clinical interventions. An actigraph measures bodily motions (accelerations) and stores activity counts in solid-state memory. Typically, actigraphs are worn on the non-dominant wrist in adults and on the belt to detect trunk movements in children. The first study reporting differences in activity levels in children with ADHD was Porrino et al. [18]. She reported that children with ADHD were about 25% to 30% more active than normal controls and that their activity levels differed most during structured school tasks. In contrast, there were no significant differences in activity levels during recess or after school. Many studies have used those recording to evaluate not only activity levels but rest activity rhythm of ADHD and patients with other psychiatric disorders [19, 36]. The QuotientTM ADHD System uses an infrared motion analysis camera to track movements of a reflective marker worn on the head. QuotientTM Hyperactivity measures correlated with parent ratings, clinician ratings and overall actigraph measures in this study. The finding that QuotientTM Hyperactivity Index correlated with actigraph measures suggests that they are assessing some shared parameter. Further, it makes sense that QuotientTM and actigraph correlated at times that children were likely in class, working on homework, seated for dinner or heading to bed. These are times when the child with ADHD may be expected to remain relatively still and hence when their problem sitting still or inhibiting their activity would be most noticeable. The QuotientTM test was specifically designed to capture their difficulty in inhibiting activity to low levels by recording head movements during a monotonous but challenging cognitive control task. Hence, in office QuotientTM measures may provide some insight into a child’s level of activity during times when they are expected to sit still. Unfortunately, teacher ratings of hyperactivity were not collected in this study. However, Teicher, et al. [20] reported that infrared motion analysis of head movements (as used in QuotientTM) correlated strongly with teacher ratings but did not significantly correlate with parent ratings of hyperactivity. This lack of concordance with parent ratings is consistent with the observation that parent and teacher ratings of ADHD symptoms correlate only to a limited degree, with Pearson correlation coefficients of around 0.2–0.4 [16, 37, 38]. This is likely due to differences in what is expected regarding appropriate or permissible levels of activity at home versus school. The observed correlations between QuotientTM and actigraphs were significant but only of medium effect size. This is likely due to variability in the classroom environment. Many schools now permit children to have substantial latitude in degree to which they are permitted or even encouraged to move around during class. In contrast, the QuotientTM test presents a consistent challenge and requires children to remain seated throughout. This study provides additional support for the premise that in office QuotientTM measures have ecological validity as they correlated with parent and clinician ratings and actigraph measures at specific times, but not at other times (e.g., lunch periods) when children with ADHD may not be distinguishable from healthy controls in their level of physical activity. Many clinicians and researchers forgo teacher ratings due to difficulty obtaining them from some teachers and concerns about privacy. While it has been argued by some that they are not essential [39], lack of correlation between parent ratings and actigraphs during school hours suggest that some useful information may be missing. Use of actigraphs or QuotientTM measures may provide a valuable alternative.
References
-
Barkley RA (1991) The ecological validity of laboratory and analogue assessment methods of ADHD symptoms. J Abnorm Child Psychol 19(2): 149- 178.
-
Tryon WW (1993) The role of motor excess and instrumented activity measurement in attention deficit hyperactivity disorder. Behavior Modification 17(4): 371-406.
-
Anderson JC, Williams S, McGee R, Silva PA (1987) DSM-III Disorders in preadolescent children: Prevalence in a large sample from the general population. Arch Gen Psychiatry 44(1): 69-76.
-
Bird HR (1994) Estimates of the prevalence of childhood maladjustment in a community survey of Puerto Rico: The use of combined measures: Erratum. Arch Gen Psychiatry 51(5): 429.
-
Szatmari P, Offord DR, Boyle MH (1989) Ontario Child Health Study: Prevalence of attention deficit disorder with hyperactivity. Journal of Child Psychology and Psychiatry 30(2): 219-223.
-
Klein RG, Mannuzza S (1991) Long-Term Outcome of Hyperactive Children: A Review. Journal of the American Academy of Child & Adolescent Psychiatry 30(3): 383-387.
-
Weiss G, Hechtman L, Milroy T, Perlman T (1985) Psychiatric status of hyperactives as adults: A controlled prospective 15-Year follow-up of 63 hyperactive children. Journal of the American Academy of Child Psychiatry 24(2): 211-220.
-
Gittelman R, Mannuzza S, Shenker R, Bonagura N (1985) Hyperactive boys almost grown up: I. Psychiatric Status. Arch Gen Psychiatry 42(10): 937- 947.
-
Satterfield JH, Hoppe CM, Schell AM (1982) A prospective study of delinquency in 110 adolescent boys with attention deficit disorder and 88 normal adolescent boys. The American Journal of Psychiatry 139(6): 795-798.
-
Mannuzza S, Klein R G, Konig PH, Giampino, TL (1989) Hyperactive boys almost grown up: IV. Criminality and its relationship to psychiatric status. Arch Gen Psychiatry 46(12): 1073-1079.
-
Collett BR, Ohan JL, Myers KM (2003) Ten-year review of rating scales. V: scales assessing attention- deficit/hyperactivity disorder. Journal of the American Academy of Child & Adolescent Psychiatry 42(9): 1015-1037.
-
Loeber R, Green SM, Lahey BB, Stouthamer-Loeber M (1991) Differences and similarities between children, mothers, and teachers as informants on disruptive child behavior. Journal of Abnormal Child Psychology 19(1): 75-95.
-
Amador-Campos JA, Forns-Santacana M, Guàrdia- Olmos J, Peró-Cebollero M (2006) DSM-IV Attention deficit hyperactivity disorder symptoms: Agreement between informants in prevalence and factor structure at different ages. Journal of Psychopathology and Behavioral Assessment 28(1): 23-32.
-
Burns GL, Walsh JA, Gomez R (2003) Convergent and discriminant validity of trait and source effects in ADHD-inattention and hyperactivity/impulsivity measures across a 3-month interval. J Abnorm Child Psychol 31(5): 529-541.
-
Leslie LK, Weckerly J, Plemmons D, Landsverk J, Eastman S (2004) Implementing the American academy of pediatrics attention-deficit/hyperactivity disorder diagnostic guidelines in primary care settings. Pediatrics 114(1): 129-140.
-
Wolraich ML, Lambert EW, Bickman L, Simmons T, Doffing MA, et al. (2004) Assessing the impact of parent and teacher agreement on diagnosing attention-deficit hyperactivity disorder. J Dev Behav Pediatr 25(1): 41-47.
-
Wender E (2004) ADHD Symptoms and parent- teacher agreement. Journal of Developmental and Behavioral Pediatrics: JDBP 25(1): 48-49
-
Porrino LJ, Rapoport JL, Behar D, Sceery W, Ismond DR, et al. (1983) A naturalistic assessment of the motor activity of hyperactive boys: I. Comparison with normal controls. Arch Gen Psychiatry 40(6): 681–687.
-
Teicher MH (1995) Actigraphy and motion analysis: New tools for psychiatry. Harvard Review of Psychiatry 3(1): 18-35
-
Teicher MH, Ito Y, Glod CA, Barber NI (1996) Objective measurement of hyperactivity and attentional problems in ADHD. Journal of the American Academy of Child & Adolescent Psychiatry 35(3): 334-342.
-
Ohashi K, Vitaliano G, Polcari A, Teicher MH (2010) Unraveling the nature of hyperactivity in children with attention-deficit/hyperactivity disorder. Arch Gen Psychiatry 67(4): 388-396.
-
Derks EM, Hudziak JJ, Boomsma DI (2007) Why more boys than girls with ADHD receive treatment: a study of Dutch twins. Twin Research and Human Genetics: the Official Journal of the International Society for Twin Studies 10(5): 765-770.
-
Sciutto MJ, Nolfi CJ, Bluhm C (2004) Effects of child gender and symptom type on referrals for ADHD by elementary school teachers. Journal of Emotional and Behavioral Disorders 12(4): 247-253.
-
Conners CK, Sitarenios G, Parker JD, Epstein JN (1998) The revised Conners' parent Rrating scale (CPRS-R): factor structure, reliability, and criterion validity. Journal of Abnormal Child Psychology 26(4): 257-268.
-
Kaufman J, Birmaher B, Brent D, Rao U, Ryan ND (1996) Kiddie-SADS PL. Western Psychiatric Institute and Clinic: University of Pittsburgh Medical Centre.
-
Achenbach TM (1991) Manual for the child behavior checklist and 1991 child behavior profile. Burlington, VT: Dept of Psychiatry University of Vermont
-
Teicher MH, Lowen SB, Polcari A, Foley M, McGreenery CE (2004) Novel strategy for the analysis of CPT data provides new insight into the effects of methylphenidate on attentional states in Children with ADHD. Journal of Child and Adolescent Psychopharmacology 14(2): 219-232.
-
Hochberg Y, Benjamini Y (1990) More powerful procedures for multiple significance testing. Statistics in Medicine 9(7): 811-818.
-
Abikoff H, Courtney M, Pelham WE, Koplewicz HS (1993) Teachers' ratings of disruptive behaviors: The influence of halo effects. Journal of Abnormal Child Psychology 21(5): 519-533.
-
Sumner CR, Haynes VS, Teicher MH, Newcorn JH (2010) Does placebo response differ between objective and subjective measures in children with attention-deficit/hyperactivity disorder? Postgraduate Medicine 122(5): 52-61.
-
Teicher MH, Polcari A, Foley M, Valente E, McGreenery CE, et al. (2006). Methylphenidate blood levels and therapeutic response in children with attention-deficit hyperactivity disorder: I. Effects of different dosing regimens. Journal of Child and Adolescent Psychopharmacology 16(4): 416-431.
-
Teicher MH, Polcari A, McGreenery CE (2008) Utility of objective measures of activity and attention in the assessment of therapeutic response to stimulants in children with attention-deficit/hyperactivity disorder. Journal of Child and Adolescent Psychopharmacology 18(3): 265-270
-
Anderson CM, Polcari A, Lowen SB, Renshaw PF, Teicher MH (2002) Effects of methylphenidate on functional magnetic resonance relaxometry of the cerebellar vermis in boys with ADHD. American Journal of Psychiatry 159(8): 1322-1328.
-
Teicher MH, Anderson CM, Polcari A, Glod CA, Maas LC, et al. (2000) Functional deficits in basal ganglia of children with attention-deficit/hyperactivity disorder shown with functional magnetic resonance imaging relaxometry. Nature Medicine 6(4): 470-473.
-
Jucaite A, Fernell E, Halldin C, Forssberg H, Farde L (2005) Reduced midbrain dopamine transporter binding in male adolescents with attention- deficit/hyperactivity disorder: association between striatal dopamine markers and motor hyperactivity. Biological Psychiatry 57(3): 229-238.
-
Teicher MH, McGreenery CE, Ohashi K (2006) Actigraph assessment of rest–activity disturbances in psychiatric disorders. International Congress Series 1287: pp 32-37.
-
Biederman J, Faraone SV, Milberger S, Doyle A (1993) Diagnoses of attention-deficit hyperactivity disorder from parent predict diagnoses based on teacher reports. Journal of the American Academy of Child & Adolescent Psychiatry 32(2): 315-317.
-
Mitsis EM, McKay KE, Schulz KP, Newcorn JH, Halperin JM (2000) Parent–teacher concordance for DSM-IV Attention-Deficit/Hyperactivity Disorder in a clinic-referred sample. Journal of the American Academy of Child & Adolescent Psychiatry 39(3): 308-313.
-
Biederman J, Keenan K, Faraone SV (1990) Parent- based diagnosis of attention deficit disorder predicts a diagnosis based on teacher report. Journal of the American Academy of Child & Adolescent Psychiatry 29(5): 698-701.
- Occupational Stress and Mental Health Outcomes Among Police Officers: A Mini Review
- The Experience of Counterproductive Leadership on Mental Health and Impact on Retention in U.S. Marines: A Phenomenological Study
- Nomophobia in the Digital Age: A Study on College and University Students
- Emotional Regulation in Children with Autism and Learning Disabilities
- Antisemitism on American College Campuses and Its Impact on Jewish Students
- Exploring the Role of Empathy in the Associations of Family Functioning and Purpose in Life with Attitude towards Abortion among Undergraduates: A Moderation Analysis