Correlation of Sleepiness with Risk of Traffic Accident in Sao Luis do Maranhao: Exposure Variables
Introduction: Sleep disturbances cause adverse effects on people’s lives for the negative interference by diminishing their daily functioning, increasing the propensity for psychiatric disorders, cognitive deficits, emergence and aggravation of health problems, risk of traffic accidents, absenteeism at work, and by compromising quality of life. Objectives: To correlate to drowsiness with risk of traffic accident. Methods: This is an observational, descriptive, crosssectional study with a quantitative approach, involving people qualified to drive, passers-by in public space, from Shopping da Ilha, in São LuÃs - MA. Results: Data from 78 drivers with mean age of 34.7 ± 12.2 years were analyzed. The data showed that 33.8% of the respondents said they had already experienced some kind of traffic hazard due to sleepiness, however, only 1 driver reported that they had already suffered an automobile accident for this reason. Conclusion: Our study concluded that there is an association between not having slept properly and having been sleepy or having taken a rest while driving in the last 30 days with an increased risk with traffic accidents.
Introduction
Human beings do not have full control over sleep. At some point, physiological mechanisms will lead to sleep, regardless of his will. There are two mechanisms that regulate the human sleep cycle: homeostatic impulse and circadian cycle. The first is related to the accumulation of substances, such as adenosine, which promote sleep after long periods of wakefulness. The circadian cycle, regulated by the suprachiasmatic nucleus of the hypothalamus, regulates variations in the state of wakefulness and physiological sleep, such as time, duration and other characteristics, which change cyclically during the day [1].
Excessive Daytime Sleepiness (EDS) is defined as the inability to stay awake and alert during the main waking periods of the day, resulting in non-purposeful sleepiness and sleep lapses. It may present both in the form of mild drowsiness, causing distractions, and in the form of severe drowsiness, where involuntary lapses of sleep, amnesia, and automatic behavior may be present. This symptom may be evidenced in trivial routine activities, but also in potentially risky situations, such as during driving [2].
EDS has intrinsic and extrinsic causes2. The intrinsic are related to primary sleep disorders-Obstructive Sleep Apnea (OSA), Narcolepsy, Restless Legs Syndrome/ Periodic Member Movements (SPI/MPM), Circadian Rhythm Disorders and Idiopathic Hypersomnia – or psychiatric – such as depression and anxiety. Conversely extrinsic causes refer to issues such as poor sleep hygiene, chronic sleep deprivation, medication use, drugs or alcohol and consumption of caffeinated beverages [2, 3].
The diagnostic methods used in the investigation of sleep disorders range from subjective evaluation, through the application of specific questionnaires, to day or night actigraphic or polysomnographic records [4]. The correct diagnosis and appropriate treatment may not only improve the quality of life, but also significantly reduce the rates of traffic accidents.
Lifestyle also leads more people to take the vehicular direction without being in skilled mental conditions for it. Many reasons are related to this reality like an accelerated day-to-day, long and strenuous working hours and/or study, unhealthy habits, such as lack of physical activity, inadequate diet and sleep deprivation.
Despite of all the consequences mentioned the correlation of drowsiness with traffic accidents is still neglected by a large portion of the population. It is rarely suspected that the person was asleep at the wheel or that he was in extreme mental exhaustion and was unable to react in time to a dangerous situation [5]. The most commonly considered causes of accident are: poor road conditions; inadequate maintenance of cars, buses and trucks; speeding and alcohol abuse [6].
Studies that relate drowsiness at the wheel as a cause of car accidents are somewhat limited by the lack of precise criteria indicative of drowsiness, making it impossible to measure them after the accident. The possibility that excessive sleepiness may have caused the accident is analyzed from indirect parameters, such as the absence of tire marks in the accident area; collisions against fixed obstacles; accidents with a single vehicle or the driver’s own report of falling asleep at the wheel [6].
Like alcohol, drowsiness alters important mental abilities in the driving of the vehicle in people, in addition to inducing sleep, mental fatigue and drowsiness impair rapid decision-making, increase the time of blinking of the eye and cause “mini naps” often imperceptible. Studies of sleep physiology show that there is a relationship between the time of a blink and the drowsiness of the human being [7]. In those moments when the driver reduces his attention in traffic, he is subject to causing fatal accidents.
Often, the problem is aggravated by some atitude like receiving cold air on the face and/or wash it with cold water, drinking coffee, listening to loud music and exposing yourself to intense light, in order to maintain alertness. These measures, besides of being useless, are especially dangerous when used by driver [8]. Moreover, such attitudes are generally not seen as palliative measures and reinforce the illusion that the driver has the situation under control and can continue driving in this state. In case of drowsiness, even with sufficient amount of sleep for age, clinical investigation should be carried out on the cause of drowsiness. Most sleep disorders are not detected and treated because, in general, people are unaware that this condition is clinical and treatable [9, 10].
Purpose
Analyze the relationship between drowsiness and the risk of traffic accidents. Verify the occurrence of sleep phenomena while driving motor vehicles; analyze sleep quality among the drivers included in the study; check excessive daytime sleepiness among the drivers included in the study; methods often used to combat drowsiness at the wheel.
Methods
This research involved the analytical selection of diversified and referenced bibliographic materials, construction of a new text relating the researched material, the new concepts obtained, a review of the most pertinent information, data collected in the field research, the statistical statements of these data, its analysis and description. This is a cross-sectional, descriptive and analytical study, with a quantitative approach, with a convenience sample involving passers-by in public space, from the Shopping da Ilha, in São Luís - MA, conducted in a period of 4 hours (14-18hours), during the campaign to raise awareness of the risks of combining direction and sleepiness entitled “DO NOT GIVE A RIDE TO SLEEP”.
Inclusion criteria were people qualified to drive, over 18 years of age, without distinction of sex or creed, accepting, by written consent, participate in this research protocol (Appendix A). The criteria for non-inclusion of the research, under 18 years, people without a driver’s license. To perform data collection, a questionnaire was used contemplating the following items (Appendix B):
- Anthropometric variables (weight height, BMI), demographic (gender, schooling), variables related to sleep quality and exposure variables were evaluated;
- For subjective evaluation of drowsiness, the Epworth sleepiness scale was used, consisting of eight questions that describe daily situations that can lead to drowsiness. The situations are: sitting and reading; watching television; sitting, quiet, in a public place; as a passenger in a vehicle during a journey lasting more than one hour, without stopping; lying down to rest in the afternoon; sitting and talking to someone; sitting after lunch, without drinking alcohol; in a car parked for a few minutes in traffic. Each item has a scale from 0 (no chance) to 3 (big chance). The degree of drowsiness corresponds to the sum of the score attributed to each of the questions ranging from 0 to 24. Excessive daytime sleepiness is considered when greater than 10.
- The data were analyzed using the resources of the SPSS 18.0 software (IBM, Chicago, IL, USA). Descriptive statistics were performed using absolute frequency, percentages, means and standard deviation measurements. The Chi-square test was used to analyze the differences in the frequencies of drivers who consider that they sleep well, had already experienced danger with drowsiness in traffic and who had excessive daytime sleepiness between the categories of exposure variables. All numerical variables were tested for normality using the Lilliefors test. After this procedure, the difference in the mean of these variables was analyzed using the independent Student’s T-test. For all analyses, the significance level of 5% was adopted.
Based on the resolution of the National Health Council of the Ministry of Health (CNS/MS) no. 466/2012, which regulates the Research Ethics Committee of the Federal University of Maranhão (CEP/UFMA) approved the research project developed by this study regarding its ethical aspects under protocol number 2.639.416 (Appendix C).
Results
Data from 78 drivers with a mean age of 34.7 years ± 12.2 years were analyzed. A frequency close to men and women was observed in the sample. The most prevalent age group was individuals between 18 and 30 years, characterizing young adults (45.4%) represented in Table 1.
| Categores | N | (%) | |
|---|---|---|---|
| Gender | Male | 39 | (52,0) |
| Female | 36 | (48,0) | |
| Age | Up to 30 years old | 35 | (45,4) |
| 31 a 40 years old | 18 | (23,4) | |
| 41 a 50 years old | 17 | (22,1) | |
| >51 | 7 | (9,1) | |
| School Education | Completed Elementary School | 1 | (1,4) |
| Completed High School | 12 | (16,2) | |
| Completed College Education | 59 | (79,7) | |
| Masters | 2 | (2,7) | |
| BMI | Low weight | 4 | (5,3) |
| Ideal weight | 45 | (60,0) | |
| Overweight | 23 | (30,7) | |
| Grade I Obesity | 2 | (2,7) | |
| Grade II Obesity | 1 | (1,3) |
Table 1: Distribution of variables of general characterization of the sample.
n = absolute frequency. % = relative frequency. BMI = Body mass index, categorized as low weight (up to 18.49), ideal weight (18.50 to 24.99), overweight (25.00 to 29.99) grade I obesity (30.00 to 34.99), Grade II obesity (35.00 to 39.99) and Grade III obesity (40.0 or more). Source: search data. Table 1: Distribution of variables of general characterization of the sample.
It was also noticed that the largest portion of the sample was composed of drivers who had completed college education (79.7%). Regarding body mass index, the data showed that 60% of the drivers evaluated had ideal weight (Table 1). The frequencies of the variables related to the occurrence of sleep episodes while driving vehicles are expressed in Table 2.
| n | (%) | |
|---|---|---|
| Have you ever driven sleepy on the interstate | ||
| Yes | 25 | (32,1) |
| No | 53 | (67,9) |
| Have you ever driven sleepy in the city? | ||
| Yes | 47 | (60,3) |
| No | 31 | (39,7) |
| Have you ever experienced any danger from drowsiness behind the wheel? | ||
| Yes | 26 | (33,8) |
| No | 51 | (66,2) |
| Have you ever had an accident for that reason? | ||
| Yes | 1 | (1,3) |
| No | 77 | (98,7) |
| Do you know anyone who’s had an accident for that reason? | ||
| Yes | 49 | (63,6) |
| No | 28 | (36,4) |
Table 2: The distribution of sleep quality assessment variables is expressed.
It was observed that 32.1% of drivers reported that they had been sleepy on the road, while in the city this percentage was even higher (60.3%). The data showed that 33.8% of the interviewees stated that they have already experienced some kind of danger in traffic due to drowsiness. However, only 1 driver reported that he has already suffered a car accident for this reason. When drivers were asked if they knew someone who had been injured due to sleep episodes, 63.6% stated that they know cases (Table 3).
| n | (%) | |
|---|---|---|
| Average sleep time per day in hours (average ±sd) | 6,8 | ±1,6 |
| Consider that you sleep well | ||
| Yes | 47 | (64,4) |
| No | 26 | (35,6) |
| Period of the day when you generally feel more awake | ||
| Morning | 34 | (46,6) |
| Evening | 21 | (28,8) |
| Night | 16 | (21,9) |
| Dawn | 2 | (2,7) |
| Presence of excessive daytime sleepiness | ||
| Yes (Epworth score greater than 9) | 27 | (35,1) |
| No (Epworth score up to 9) | 50 | (64,9) |
| The last 30 days: | ||
| slept or became drowsy, even briefly, while driving. | ||
| Yes | 29 | (38,2) |
| No | 47 | (61,8) |
| Use of sleeping medication | ||
| Yes | 7 | (9,1) |
| No | 70 | (90,9) |
| How many days you have not slept or rested enough (average ±sd) | 8,7 | ±8,8 |
| How many days you slept unintentionally throughout the day (average ±sd) | 4,3 | ±7,2 |
Table 3: The distribution of sleep quality assessment variables is expressed.
n = absolute frequency. % = relative frequency. ± sd = standard deviation. Source: search data Table 3: The distribution of sleep quality assessment variables is expressed.
It was observed that on average the drivers included in the sample slept 6.8 ±1.6 hours per day, 64.4% consider that they sleep well. Regarding the period of the day that are more awake, the majority of the sample reported that it was in the morning (46.6%), followed by the afternoon (28.8%). In addition, during the analysis, the Epworth questionnaire was processed and that 35.1% of the drivers had excessive daytime sleepiness. The analysis of retrospective data from the last 30 days showed that 38.2% slept or were sleepy in traffic, 9.1% used sleeping medications, the average number of days that were without sufficient sleep was 8.7 days and the average number of days they slept unintentionally throughout the day was 4.7 days.
The processing of the Epworth questionnaire is shown in Table 4. The data suggest that the moment when there is a higher frequency of high chance of napping is lying down to rest in the afternoon (36.4%) and sitting quietly after lunch (20.7%). On the other hand, the episodes with the highest reports of no chance of napping are if you are in a car, as a passenger, while for a few minutes in heavy traffic (84.4%) and sitting in a public place without activity (53.2%).
| N | (%) | |
|---|---|---|
| Chance to nap in the situations below: | ||
| Sitting and reading | ||
| No chance to nap | 20 | (25,9) |
| Small chance to nap | 25 | (32,5) |
| Moderate chance to nap | 19 | (24,7) |
| High chance of napping | 13 | (16,9) |
| Watching TV | ||
| No chance to nap | 25 | (32,5) |
| Small chance to nap | 17 | (22,1) |
| Moderate chance to nap | 20 | (25,9) |
| High chance of napping | 15 | (19,5) |
| Sitting in a public place with no activity | ||
| No chance to nap | 41 | (53,2) |
| Small chance to nap | 24 | (31,2) |
| Moderate chance to nap | 7 | (9,1) |
| High chance of napping | 5 | (6,5) |
| As a passenger in the car, train or bus, after 1 hour | ||
| No chance to nap | 39 | (50,6) |
| Small chance to nap | 20 | (26,0) |
| Moderate chance to nap | 10 | (13,0) |
| High chance of napping | 8 | (10,4) |
| Lying down to rest in the afternoon | ||
| No chance to nap | 18 | (23,3) |
| Small chance to nap | 15 | (19,5) |
| Moderate chance to nap | 16 | (20,8) |
| High chance of napping | 28 | (36,4) |
| Sitting and talking to someone | ||
| No chance to nap | 63 | (81,8) |
| Small chance to nap | 11 | (14,3) |
| Moderate chance to nap | 3 | (3,9) |
| High chance of napping | 0 | 0 |
| Sitting quietly after a lunch | ||
| No chance to nap | 21 | (27,3) |
| Small chance to nap | 21 | (27,3) |
| Moderate chance to nap | 19 | (24,7) |
| High chance of napping | 16 | (20,7) |
| If you are driving, as a passenger, while stop for a few minutes in heavy traffic | ||
| No chance to nap | 65 | (84,4) |
| Small chance to nap | 8 | (10,4) |
| Moderate chance to nap | 3 | (3,9) |
| High chance of napping | 1 | (1,3) |
Graph 1 illustrates the frequency of the main measures taken by drivers to combat drowsiness in traffic. It was observed that the most mentioned measures were sleeping well (70.5%), talking while driving the vehicle (43.6%) and consume coffee or energy (33.3%).
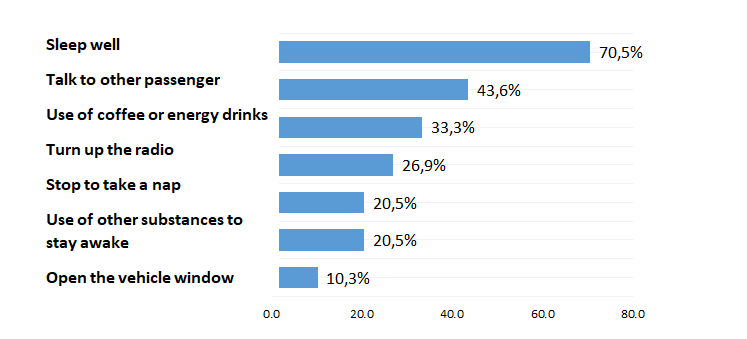
Source: search data Graph 1: Distribution of variables related to the three measures taken by drivers to combat drowsiness in traffic.
The association between demographic data and the outcomes evaluated was also analyzed. No statistically significant differences were observed in the frequencies of the three outcomes between men and women (P > 0.05). For
the age group variable, there was a statistically significant difference for the question you consider that you sleep well (P = 0.020), while only 35.3% of individuals between 31 and 40 years of age report that they sleep well, this frequency is much higher in the younger age group (70.6%) and among individuals between 41 and 50 years (85.7%).
The analysis of association between those who have experienced some danger in traffic due to drowsiness and exposure variables is expressed in Table 5.
| Variable | You’ve been in some danger in traffic due to drowsiness | P | |
|---|---|---|---|
| Yes | No | ||
| % | % | ||
| Consider that you sleep well | 0,200 | ||
| Yes | 28,3 | 71,7 | |
| No | 46,1 | 53,9 | |
| Period of the day when you generally feel more awake | 0,445 | ||
| Morning | 27,3 | 72,7 | |
| Evening | 47,6 | 52,4 | |
| Night | 31,2 | 68,8 | |
| Dawn | 50,0 | 50,0 | |
| Presence of excessive daytime sleepiness | 0,894 | ||
| Yes (Epworth score greater than 9) | 37,0 | 63,0 | |
| No (Epworth score up to 9) | 32,6 | 67,3 | |
| Did you sleep or became drowsy, even briefly while driving (last 30 days) | 0,006* | ||
| Yes | 55,2 | 44,8 | |
| No | 21,7 | 78,3 | |
| Use of sleeping medication (last 30 days) | 0,042* | ||
| Yes | 71,4 | 28,6 | |
| No | 30,4 | 69,6 | |
| Have you ever driven drowsy on the road | 0,001* | ||
| Yes | 60,0 | 40,0 | |
| No | 21,1 | 78,9 | |
| Have you ever driven sleepy in the city | 0,003* | ||
| Yes | 47,8 | 52,2 | |
| No | 12,9 | 87,7 | |
| Loud snoring | 0,741 | ||
| Yes | 41,7 | 58,3 | |
| No | 32,8 | 67,2 | |
| You often feel tired, exhausted or sleepy during the day. | 0,739 | ||
| Yes | 39,1 | 60,9 | |
| No | 32,1 | 67,9 |
The variables who slept or became drowsy in traffic in the last 30 days (P = 0.006) used sleeping medication in the last 30 days (P = 0.042), already drove sleepy on the road (P = 0.001) or in the city (P = 0.003) were associated with traffic hazards related to sleep.
Discussion
Traffic accidents are cause of death worldwide. Among the countries with high traffic mortality rates, Brazil ranks fifth, but is the second leading cause of death among external causes, with the highest occurrence among young people and adults aged 15 to 39 years. According to the federal highway police, 6.7% of traffic accidents in 2016 were caused by sleep and more than half occurred at night, with 68.9% in rural areas [11].
The data collected provided the comparison of the sensation of having slept well between the age groups analyzed. The group, whose largest share of sleeping well, was under 30 years of age. On the other hand, the group between 31 and 40 years old obtained the lowest frequency of positive answers to this question. Although it did not present statistical significance, 50% of the sample in this age group claimed to have been in danger in traffic due to drowsiness. Cultural aspects, experiences that lead to reduced sleep hours, namely a fusion of school demands, part-time jobs, night time activities, may be the reasons why this age group is more exposed to sleep disorders, consequently presenting a higher risk of drowsiness at the wheel, therefore sleep- related traffic accidents increase considerably [12].
The average sleep of the drivers in the sample studied who considers that he/she sleeps well is 64.4%, 6.8 hours/night. However, even considering that 60.3% of these sleepwell on the road. According to an Acute Sleep Deprivation and Risk of Motor Vehicle Crash Involvement study conducted in December 2016 by the American Asleep Association’s Traffic Safety Foundation, drivers who have slept less than 7 hours in the past 24 hours have a high collision rate, about 2x more than other drivers12. Another study published in the journal Public Order and Social Defense 2011 found that all drivers with sleep disorders are acute or chronic are likely to sleep behind the wheel and consequently suffer accidents caused by sleep [13].
Of the total respondents, 35.6% of the sample considers that they do not sleep well, an equal or lower percentage should be expected for those who reported having already slept or become sleepy at the wheel and/or those who have excessive daytime sleepiness (EDS). However, 37% of respondents have EDS. In addition, 38.2% claimed to have already slept or become sleepy even briefly while driving. It is not such a significant difference, but it allows us to infer that individuals do not always have good perception about the quality of their own sleep, tending to their overestimation. Giorelle, et al. highlights that EDS is a frequent symptom and is present in about 10-25% of the general population. The prevalence of EDS of 35.1% found in our study may have been significantly higher than that found in the general population due to our random selection of passers-by to participate in the study.
One of the limitations of our study concerns the information from the interviewees. The subjective nature of the self-report made it difficult to obtain reliable parameters, both in relation to the individual sleep pattern and to possible risk behaviors until the occurrence of accidents.
The lack of objective methods capable of measuring the degree of drowsiness hinders its characterization and correct correlation with a given incident occurred. In addition, the presence of the DMV during the campaign and data collection may have inhibited some participants. It is possible that the fear of sanctions has led many respondents to omit important information from the study. To mitigate this bias, the participants were informed about the ethical issues involving a research, with emphasis on confidentiality regarding the information collected.
Another limitation refers to the approach to the public, due to the reduced collection time from 14 to 18hours and the restricted space granted by the administration of the place for the permanence of our team. As a result, only 78 people could be included in the study. As for this selection bias, nothing can be done in order to mitigate it. The repercussion of drowsiness at the wheel should not be deprecated due to financial and social costs. The awareness of the population about this serious public health problem is essential.
Conclusion
Our study concluded that the age group with the highest probability of a relationship between drowsiness and traffic accidents was among young adults and that they did not have adequate perception of their sleep quality. Sleeping an amount of hours insufficient for individual needs is an increasingly frequent habit, which brings as an inevitable consequence a poor quality of sleep. This may also be impaired by some pre-existing sleep disorder and perhaps still unknown by the individual. Seeking medical help for the investigation and treatment of causes of non-restorative sleep becomes a public health issue, since it would contribute, even indirectly, to the reduction of traffic accidents.
For this, actions such as education as to the dangers of combining drowsiness with driving become compulsory, which will bring significant change in behavior in traffic.
References
-
Neves GSML, Giorelli AS, Florido P, Gomes MDM (2013) Sleep disorders: overview. Brasilian Journal of Neurology 49(2): 57-71.
-
Giorelli AS, Santos PP, Carnaval T, Gomes MM (2012) Excessive daytime sleepiness: clinical, diagnostic and therapeutic aspects. Brasilian Journal of Neurology 48(3): 17-24.
-
Bittencourt LR, Silva RS, Santos RF, Pires ML, Mello MT (2005) Excessive daytime sleepiness. Rev Bras Psiquiatr 27(1): 16-21.
-
Rizzo G (2005) Drowsy driving in the South of Brazil. Rev bras Neurology.
-
Tufik S (2001) The social cost of sleep. Science Today 170 (29): 6-10.
-
Canani SF, Barreto SSM (2001) Drowsiness and car accidents. Journal of Pulmonology 27(2): 94-96.
-
Ferrassini RB (2014) Drowsiness detection system, through computer vision. Article presented as a course completion work to the School of Engineering of São Carlos, University of São Paulo.
-
Hayashi M, Masuda A, Hori T (2003) The alerting effects of caffeine, bright light and face washing after a short daytime nap. Clinical Neurophysiology 114(12): 2268- 2278.
-
Togeiro SMGP, Smith AK (2005) Diagnostic methods in sleep disorders. Revista Brasileira de Psiquiatria 27(1): 8-15.
-
Müller MR, Guimarães SS (2007) Impact of sleep disorders on daily functioning and quality of life. Psychology Studies 24(4): 519-528.
-
Paraná Portal (2018) Brazil is the fifth country in the world to have traffic deaths, according to who. 2017.
-
Tefft BC (2016) Acute Sleep Deprivation and Risk of Motor Vehicle Crash Involvement. AAA Foundation for Traffic Safety 41(10).
-
Antônio A (2011) Vehicular driving and sleep disorder. Magazine Public Order and Social Defense 4(1-2): 101- 120.
- Occupational Stress and Mental Health Outcomes Among Police Officers: A Mini Review
- The Experience of Counterproductive Leadership on Mental Health and Impact on Retention in U.S. Marines: A Phenomenological Study
- Nomophobia in the Digital Age: A Study on College and University Students
- Emotional Regulation in Children with Autism and Learning Disabilities
- Antisemitism on American College Campuses and Its Impact on Jewish Students
- Exploring the Role of Empathy in the Associations of Family Functioning and Purpose in Life with Attitude towards Abortion among Undergraduates: A Moderation Analysis