Effect of Annealing Time on Structural and Optical Properties of ZnGa2O4: Cr3+ (2.0mol %) Nanostructure Prepared by Sol Gel Method
ZnGa2O4: Cr3+ (2.0mol %) nanopowders annealed at annealing times (AT) of = 1, 2, 3, and 4H (hour) were synthesized by the sol-gel method. X-ray diffraction (XRD) results confirmed that the prepared ZnGa2O4: Cr3+ samples were cubic structures. In this study we showed that the annealing time has no pronounced influence on the ZnGa2O4: Cr3+ crystallite size at annealing times in the range of 1H to 3H. A significant change in the crystallite size was observed for the sample annealed for a relatively long time (4H). Scanning electron microscopy (SEM) images show the morphology of the prepared nanopowders influenced by annealing time. UV-visible spectrophotometer measurements showed that the energy gap of the prepared nanoparticles could be tuned from 4.50 to 4.12 eV as the annealing time changed from 1H to 4H. Photoluminescence (PL) measurement showed that the annealing time increased, and the PL intensity also increased reaching the maximum value for the sample annealed at AT=3H. Energy dispersive X-ray spectroscopy (EDS) measurements confirmed the presence of Zn, Ga, O and Cr ions.
Introduction
ZnGa2O4 is spinel-type oxide AB2O4, where A, and B are divalent and trivalent metal cations respectively. The oxygen ions in AB2O4 were arranged in closed- packed cubic structure, forming tetrahedral and octahedral vacancies. It is well known that ZnGa2O4 exists in a normal spinel structure with wide a band-gap of about 4 - 4.8 eV and belongs to the cubic space group Fd3m with lattice parameters of a = 8.334 Ǻ [1, 2, 3]. The undoped ZnGa2O4 phosphor emits a blue color due to transitions via a self-activation center. ZnGa2O4 doped with Cr3+ is shown to be bright red emitting long lasting phosphor when UV excited potentially suitable for bio imaging application. It emit bright red long-lasting luminescence around 695 nm due 2E→4A2 transition [4].
Various synthesis approaches have been established for the rare earth activated ZnGa2O4 based phosphors, including the solid state [5], sol–gel [6], electron spin [7], hydrothermal reaction, pulverizing single crystals grown by chemical precipitation [8], and the flux method [9]. The advantage of using sol-gel over other methods such as hydrothermal and precipitation for the preparation of ZnGa2O4: Cr3+ (1 mol %) is that it provides excellent control over stoichiometry introduces dopants easily and allow a lower processing temperature. The citrate assisted sol-gel methods involve the formation of mixed citrate ion, which gives a fine powder with a homogeneous pattern after the pyrolysis of the gel without the use of high temperature. This method offered single- phase, high -purity, and particle s of uniformly size in the nano range [10]. The effect of annealing time on the structure and optical properties of the spinel oxide ZnAl2O4; 0.01% Cr3+ prepared via the citrate sol-gel process was cited by Motloung, et al. [11]. It has been reported that the emission properties and the structural of the ZnAl2O4; 0.01% Cr3+ is affected by annealing time. They also showed that the band gap (Eg) of the prepared nano phosphor could be changed by varying the annealing time (AT).
To the best of our knowledge, the influence of annealing time on the morphology and structural properties of ZnGa2O4: Cr3+ (2.0 mol %) by the citric acid sol-gel process has not been reported in the literature. The aim of the present work is to investigate the influence of annealing time on the structural, morphological, and optical properties of ZnGa2O4: Cr3+ (2.0 mol %) nano materials for possible applications this material in bio imaging. Thus, this study is essentially an ongoing investigation of our previous results [2, 12, 13], motivated by the quest to acquire a deeper insight into the material nature of ZnGa2O4: Cr3+ (2.0 mol %). In Our previous study on ZnGa2O4: Cr3+ (1.0 mol %) we have investigated the effects of annealing temperature, Citric acid ration and Cr doping on the material property of ZnGa2O4: Cr3+ (1.0 mol %). Our previous study on Zinc gallate compound result showed that the highest PL was found for sample annealed at 1000 0C, metal cation to citric ratio (M: CA) ratio 1: 1 and Cr doping at 2.0mol%. In current study we synthesized ZnGa2O4: Cr3+ (2.0 mol %) at annealing temperature of 1000 0C, chromium doping 2.0 mol% and metal- cation to citric ratio of 1: 1. The main motive for the present study is to further investigate the effect of annealing time on ZnGa2O4: Cr3+ material property for sample annealed at 1000°C, metal cation to citric ratio (M: CA) ratio 1: 1 and Cr doping at 2.0mol% which gave us highest PL intensity in previous study and further investigate effect of annealing time on the material properties of this compound to get optimum annealing time for the improved PL for using this material the in the bio imaging applications.
Experimental Details
Raw Materials and Powders Synthesis
A Chromium-doped zinc gallate compound was synthesized using the sol gel method, with gallium nitrate monohydrate (Ga (NO3)3. 6H2O (99.99%)) as the gallium sources, zinc nitrate (Zn (NO3)2·6H2O (99.9%)) as zinc source, chromium (III) nitrate (Cr (NO3)3. 9H2O (>99.99%)) as sources of chromium ions and citric acid monohydrate (C6, H8O7. H2O (99%)) as chelating agent. Zn (NO3)2·6H2O (99.9%), Ga (NO3)3. 6H2O (99.99%), Cr (NO3)3. 9H2O (>99.99%)) and citric acid (CA) C6H8O7·H2O (99%) were bought from Laboratory Consumables & Suppliers cc, (South Africa) and were used without further purification. All samples were doped with 2.0 mol% Cr3+ ions. Stoichiometric quantities of Zn (NO3)2.6H2O and Ga (NO3)3. 6H2O with Zn: Ga molar ratio of 1: 2 was dissolved in 60 ml of deionized water. The molar ratio of citric acid to metal ions was kept constant at 1:1 and citric acid was added to the solution while stirring. The mixed solution was stirred for 2 h heated at constant temperature of 80℃ in a water bath until highly viscous gel was formed. The gels were then dried in a furnace at 120 ℃ for 2h. The dried gel was transferred to four separate crucibles and then transferred to furnaces at constant temperature of 1000 ℃ followed by annealing time for 1H, 2H, 3H and 4H. ZnGa2O4: Cr3+ (2.0 mol %) nanocrystals obtained at various annealing times (AT) were crushed using a pestle to obtain fine powders for further characterization. Characterization The phase and crystallinity of obtained ZnGa2O4: Cr3+ (2.0mol %) nano-particle were studied by XRD (advance bruker diffractometer) with CuK𝛼 (𝜆 =0.15406 nm) radiation. The surface morphology of prepared powder was examined using Shimadzu Super scan ZU SSX- 550 electron microscope (SEM). Room temperature Photoluminescence (PL) measurements were done using a Hitachi F-7000 fluorescence spectrophotometer with the use a Xenon lamp as excitation source. The measurement of optical properties was performed with a Varian Cary UV−vis-NIR- spectrophotometer 6000i model. EDS measurement was done for identification of composition of the samples. The accelerating voltage used for both EDS and SEM was 10keV.
Results and Discussion
X-ray Diffraction (XRD) Properties
Figure 1(a) shows the X-ray diffraction pattern of ZnGa2O4: Cr3+ (2.0mol %) samples annealed at annealing times in the range of 1H to 4H. All peaks can be indexed to crystalline ZnGa2O4 (JCPDS card No: 86-0415). No additional phases or impurities were detected in Cr- doped zinc gallate (ZnGa2O4: Cr3+ (2.0mol %)).The value of lattice parameter values for samples annealed for 1H, 2H, 3H and 4H were calculated from the two most intense peaks at (311) and (440). The results obtained are in good agreement with the known experimental values of the lattice parameter for crystalline ZnGa2O4 (a= 0.8335 nm). The average for the lattice constant values were, 0.8244 1.1 ± , 0.8262 87.0 ± , 0.8264 87.0 ± and 0.8314 25.0 ± at annealing time of 1H, 2H, 3H and 4H respectively. The result from Analysis of the XRD peaks showed that they became sharper and narrower with increasing annealing time. The increase in a lattice constant with increasing annealing time might be directly related to the crystallization of the nanoparticles. Crystallinity improves as the annealing time is increased, causing narrowing of the peaks which suggests improved crystallinity in terms of the degree of order of the samples with increasing annealing time [11]. The reason for improvement in crystallite size with annealing time may be that when the samples annealed at such high temperatures for longer durations remove most of the defects the nanoparticles undergo significant aggregation leading to the formation of large crystallites [8].
The crystallite size of ZnGa2O4: Cr3+ (2.0mol %) for samples annealed at different annealing times calculated using the Debye Scherer formula given in Eq. (1):
0.91 cos s D λ β θ = (1)
where: Ds is the average crystal size (nm), λ is the X-ray wave length of (0.154nm), β is the full width at half maximum (radian), and θ is the angle of diffraction (degrees).
The average crystallite sizes obtained from the two most intense peaks (311) and (440) values 16.4, 16.9, 17.2 and 18nm. The result of this study showed that the annealing time no marked influence on the ZnGa2O4: Cr3+ crystallite size at annealing time in range of 1H to 3H.The substantial change on crystallite size were observed for sample annealed relatively at high annealing time (4H).
4H
3H Intesity (a.u)
2H
1H JCPDS card no:86-0415
(311) (220) (111) (511) (422) (400)
(440) (222) (331) (442) (533) (620) (442) (531)
10 20 30 40 50 60 70 80
2 theta (deg) Figure 1: (a) XRD pattern for ZnGa2O4: Cr3+ (2.0mol %) annealed at different annealing time.
Morphological Properties
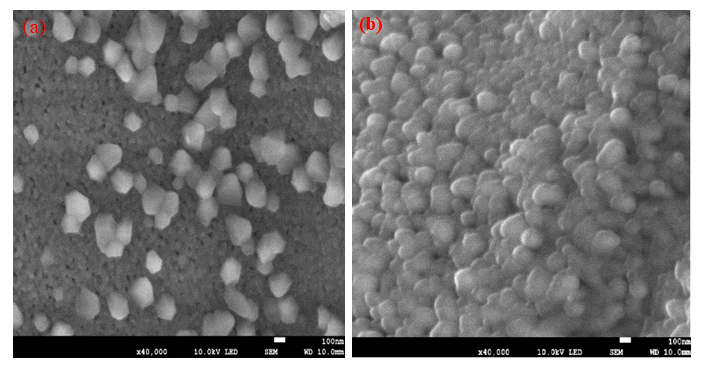
SEM analysis: The SEM micrographs of ZnGa2O4: Cr3+ (2.0mol %) annealed at 1H and 4H are shown in Figure 2(a) & (b) respectively. As shown in figure 2(a) at annealing time (AT)= 1H, the SEM image consists of irregularly shaped particles distributed over the surface , with cubic- like structure and clear grain boundaries observed over the surfaces. As shown in figure 2(b) at an annealing time of 4H, the degree of agglomeration particles increased significantly, and large crystallite sizes were formed as compared to the low annealing time (AT=1H). The result of this study clearly shows that the surface morphology of nanoparticles can be influenced by annealing time.
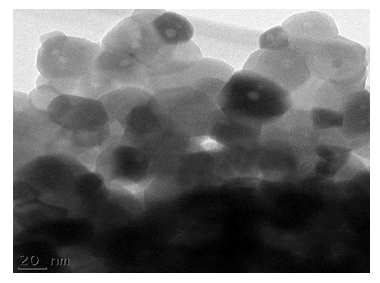
TEM analysis: The TEM image of ZnGa2O4: Cr3+ (2.0mol %) annealed at annealing time of 4H shown in Figure 3. As shown in figure 3, the prepared nanoparticles consisted of nanoparticle in nano size. The average particle size calculated from the TEM image using image J software was approximately around 19nm, which is close to the crystallite size calculated from XRD. In addition the HR-TEM image shows that the particles had cubic -like structure. The results obtained from the XRD and TEM support each other.
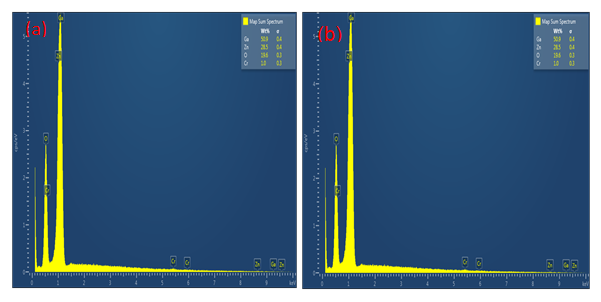
EDS analysis: Figure 4(a) & (b) represents EDS spectra for the ZnGa2O4: Cr3+ (2.0mol %) sample annealed at AT=1H and 4H respectively. As shown in figure 4(a) and (b), the EDS spectrum showed that the prepared powder consists of expected element (Zn, Ga, O and Cr). The EDS did not detect any other impurities in the samples, which agree well with the XRD results shown in figure 1.
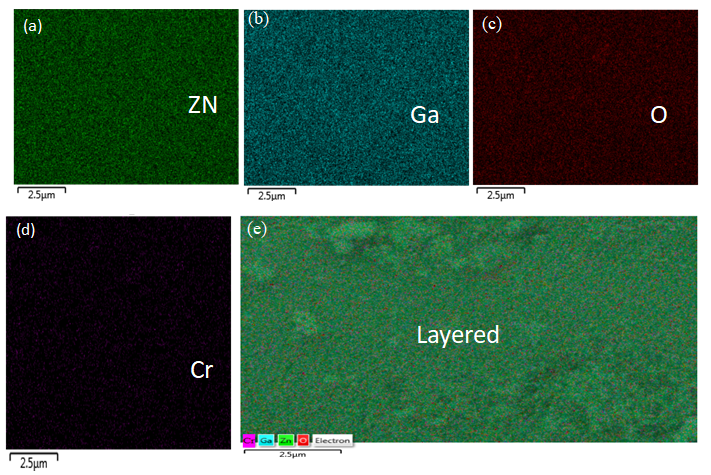
ZnGa2O4: Cr3+ (2.0mol %) annealed at time of AT= 4H was further investigated by measuring the EDS mapping as shown in figure 5. The existence of expected elements in compound ZnGa2O4 doped with Cr; Zn, Ga, O, and Cr shown in Figure 5(a-d) respectively.
The layered images in Figure 5(e) show that the individual elements were distributed homogenously over the surface of prepared ZnGa2O4:Cr3+ (2.0 mol %) nano powders.
Reflectance and Bandgap Analysis (UV-Vis Spectroscopy)
Figure 6(a) & (b) show the reflectance spectra and energy gap of ZnGa2O4: Cr3+ (2.0 mol %) annealed for different times.
The Kubelka–Munk function F(R) having the following form used for change of reflectance into absorption coefficient of analysed powder given by equation 2 ( ) ( )
2 1 2 R F R R α − = =
(2) Where 𝛼 is the absorption coefficient, F(R) is Kubelka– Munk function and R is the reflectance. The optical bandgap energy can be estimated by plotting this function (F(R) h𝜈) 2 against photon energy (h𝜈). The value for bandgap of the material can be found by the extrapolation of the linear region of this plot to equal to zero.
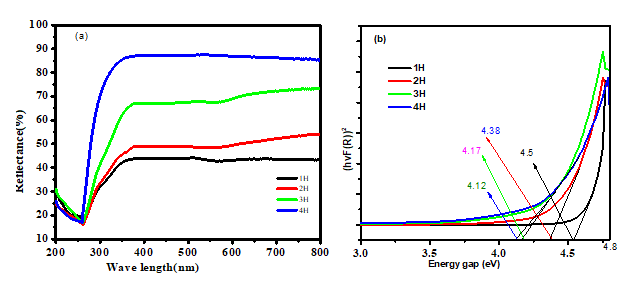
As seen in figure 6(a) in the UV-visible region the % of reflectance is maximum for sample annealed at high time (AT= 4H) and least for the sample annealed at least for sample annealed at low time AT= 1H. The calculated energy bandgap reduce from 4.50 to 4.12 eV with increasing of annealing time from 1H to 4H and the obtained energy gap value in the range of energy gap of ZnGa2O4 [12]. The causes for narrowing in energy gap may related to increase in crystallite size and lattice constant value seen from XRD results. The results showed that the energy gap of the prepared nanoparticle could be tuned from 4.50 to 4.12 eV by changing the annealing time in from 1H to 4H. Photoluminescence (PL) Analysis Figure 7(a) shows the PL emission when excited at wavelength of 254nm. As shown in figure 7 , when ZnGa2O4: Cr3+ (2.0mol %) nanopowder was excited at a wavelength of 254 nm, all prepared samples were emitted in the red region of the spectrum. It was observed that the emission wavelength position did not change with annealing time. When the annealing time was increased, the PL intensity also increased and reached maximum value for sample annealed at AT=3H. The emission from the host emissions was completely suppressed which may be due to energy transfer from the ZnGa2O4 (host) to the Cr3+ (activator ions) or may be associated with defects in the host [14]. The R-line emission at 695 nm and N-line emission at 713 nm both originated from transition of Cr3+ ions from 2E→4A2 [15].
180 R-line
650 700 750 800 0 Emision wave length(nm) Figure 7: (a) emission PL spectra of ZnGa2O4: Cr3+ (2.0mol %) annealed at different time.
It is therefore concluded that the annealing time affects the photoluminescence properties of ZnGa2O4: Cr3+ (2.0mol %) nano particles.
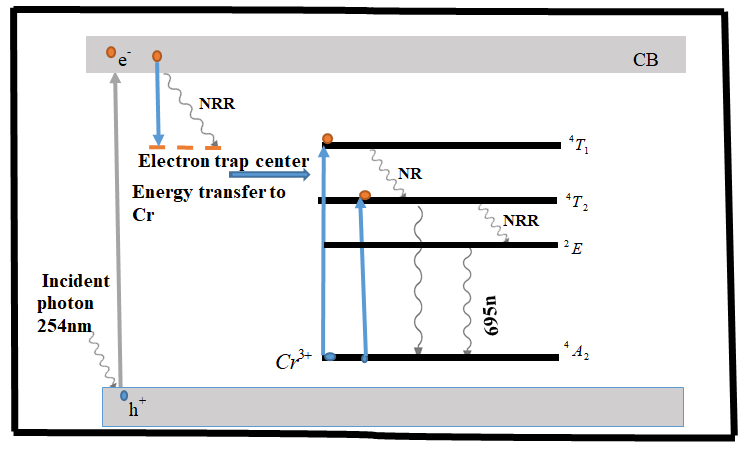
Figure 8 shows the energy transfer mechanism between the host (ZnGa2O4) and Cr3+ ions and the subsequent emission from the Cr3+ ions. When an incident photon with a wavelength
254nm excites the electrons in the valance band of the ZnGa2O4 (host), electrons in the valence band are excited to the conduction band with creation of holes (h+) in valance band of the host. The electrons excited from the valence band to the conduction band of the host are de-excited by non-radiative relaxation (NRR) and captured by electron trap formed may be due to oxygen vacancies (V0*) below the conduction band of the host (ZnGa2O4). The de excited electrons trapped by the trap level and transfer some parts of their energy to Cr3+ ions leading to the excitation of 3d electrons of Cr3+ ions from the ground state level (4A2) to three excited state energy levels 2E, 4T1, and 4T2. The electrons from the excited state Cr3+ ion return to their 4A2 ground state through the emission of photons of different energies or the excitation may be trapped by a neighboring pair of antisite defects [13]. Trap levels originate from impurities, lattice defects or dopants in the host materials just few eV below the conduction bands. Traps usually do not emit radiation; however they store the excitation energy for a longer time.
Conclusion
ZnGa2O4: Cr3+ (2.0mol %) nanoparticles were successfully prepared via the sol–gel technique using citric acid as a chelating agent. X-ray diffraction (XRD) and transmission electron microscopy (TEM) analyses confirmed that the prepared nanoparticles had cubic structures. Crystallite size, surface morphology and band gap influenced by the annealing time. The PL results showed that PL intensity increased with increasing annealing time. Uv-Vis measurement showed that the energy gap of the prepared ZnGa2O4: Cr3+ (2.0mol %) could be tuned from 4.50 to 4.12 eV by changing the annealing time in from 1H to 4H [16, 17, 18].
Data Availability
The data used to support this study included with in this manuscript
Conflicts of Interest
The Authors declare that they have no conflict of interest
Acknowledgements
The authors would like to acknowledge the financial support given from the directorate of the research at University of the Free State South Africa and Dire Dawa University Ethiopia.
References
-
Cao M, Djerd I, Antonietti M, Niederberger M (2007) Nonaqueous Synthesis of Colloidal ZnGa2O4 Nanocrystals and Their Photoluminescence Properties. Chem Mater 19(24): 5830-5832.
-
Hussen MK, Dejene FB, Gonfa GG (2018) Effect of citric acid on material properties of ZnGa2O4:Cr3+ nanopowder prepared by sol–gel method. Applied Physics A 124: 390.
-
Bessière A, Jacquart S, Priolkar K, Lecointre A, Viana B, et al. (2011) ZnGa2O4:Cr3+ a new red long-lasting phosphor with high brightness. Optics Express 19: 10131-10137.
-
Hu Z, Ye D, Lan X, Zhang W, Luo L, et al. (2016) Influence of co-doping Si ions on persistent luminescence of ZnGa2O4: Cr3+ red phosphors. Optical Materials Express 6: 257033-257033.
-
Wang L, Hou Z, Quan Z, Lian H, Yang P, et al. (2009) Preparation and luminescence properties of Mn2+- doped ZnGa2O4 nanofibers via electrospinning proces. Materials Research Bulletin 44(10): 1978-1983.
-
Dhak P, Gayen UK, Mishra S, Pramanik P, Roy A (2009) Optical emission spectra of chromium doped nanocrystalline zinc gallate. Journal of Applied physics 106: 063721.
-
Sampath SK, Kanhere DG, Pandey R (1999) Electronic structure of spinel oxides: zinc aluminate and zinc gallate. J Phys Condens Matter 11(98): 3635-3644.
-
Bessière A, Jacquart S, Priolkar K, Lecointre A, Viana B, et al. (2011) ZnGa2O4: Cr3+: a new red long-lasting phosphor with high brightness. Opt Express 19(11): 10131-10137.
-
Yang SH (2004) Indium- and Tungsten-Doped ZnGa2O4 Phosphor. Journal of Electronic Materials 33: L1-L4.
-
Hussen MK, Dejene FB (2018) Influence of annealing temperature on material properties of red emitting ZnGa2O4: Cr3+ nanostructures. Journal of Sol-Gel Science and Technology 88: 454-464.
-
Motloung SV, Motloung SJ, Swart HC, Hlatshwayo TT (2017) The Effect of Annealing Time on the Structural and Optical Properties of ZnAl2O4:0.01% Cr3+ Nanophosphor Preparedvia the Sol–Gel Method. Journal of Electronic Materials 47: 521-529.
-
Hussen MK, Dejene FB (2018) Influence of annealing temperature on material properties of red emitting ZnGa2O4: Cr3+ nanostructures. Journal of Sol-Gel Science and Technology 88: 454-464.
-
Hussen MK, Dejene FB (2019) Effect of Cr3+ doping on structural and optical property of ZnGa2O4 synthesized by sol gel method. Optik 181: 514-523.
-
Luchechko A, Kravets O, Syvorotka II (2017) Optical and luminescence spectroscopy of zinc gallate phosphors codoped with manganese and europium ions. Spectroscopy Letters 50(7): 404-410.
-
Singh SK (2014) Red and near infrared persistent luminescence nano-probes for bioimaging and targeting applications. The Royal Society of Chemistry 4: 58674- 58698.
-
Zhou Z, Zheng W, Kong J, Liu Y, Huang P, et al. (2017) Rechargeable and LED-activated ZnGa2O4:Cr3+ near- infrared persistent luminescence nanoprobes for background-free biodetection. Nanoscale 9: 6846-6853.
-
Yang SH, Yokoyama M (2001) Enhanced luminance of phosphorZnGa2O4 by doping In2O3. Journal of Vacuum Science & Technology A 19(5): 2463.
-
Zou L, Xiang X, Wei M, Li F, Evans DG (2008) Single- Crystalline ZnGa2O4 Spinel Phosphor via a Single-Source Inorganic Precursor Route. Inorganic Chemistry 47(4): 1361-1369.
- Sense, Gravity, Parity & Chirality in Mathematical Physics
- Quantum Lattice Simulations PHYSICS: Microcircuit Particle Formation and Observable Macroscopic Irreversible Time - A Discrete Lagrangian with Cellular Automata Framework
- Quantum Biology from Biomacromolecule to Cell, and Central Dogma Described by Quantum Theory
- Focus, Agility, Speed and Technology (FAST) for Sustainability and Growth
- Square Root Metric Geometry and Pati-Salam Model in Curved Space-Time
- A Simple System Demonstrating the Mpemba Effect in Classical Mechanics