Environmental Trace Metal Concentrations in the Okrika Stretch: A Comprehensive Study on Pollution Indicators
The Okrika Stretch of Bonny River, Nigeria, has long been a vital ecological and economic resource for the surrounding communities. However, increasing industrialization and anthropogenic activities have raised concerns about the potential pollution of this precious aquatic ecosystem. This study delves into the assessment of environmental trace metal concentrations, specifically Lead (Pb), Nickel (Ni), Zinc (Zn), Copper (Cu), and Iron (Fe), as pollution indicators in various components of the Okrika Stretch. The research scrutinizes water, sediment, oyster, and periwinkle samples, utilizing cutting-edge analytical techniques to measure trace metal levels. Sampling was carried out at five distinct locations, including a control site situated outside the presumed affected area, for both dry and wet seasons throughout the year. Following collection, the samples of water, sediment, oyster, and periwinkle underwent digestion and subsequent analysis using the Bulk Scientific Model 200A Atomic Absorption Spectrophotometer (AAS). Our findings reveal a complex interplay of trace metal concentrations across different environmental components. The water samples exhibit varying levels of these metals, reflecting the dynamic nature of riverine systems. Sediment analysis identifies hotspots of metal accumulation, potentially posing risks to aquatic life. Oysters and periwinkles, as vital components of the food web, accumulate trace metals at different rates, providing insights into potential human health implications. This research not only sheds light on the current state of pollution within the Okrika Stretch but also underscores the importance of continued monitoring and mitigation efforts. The results call for a comprehensive environmental management strategy to safeguard the ecological and economic sustainability of the Bonny River region. By addressing the complexities of trace metal pollution, this study contributes to the broader discourse on safeguarding our invaluable aquatic ecosystems worldwide.
Introduction
The Okrika Stretch of Bonny River, situated within the Niger Delta region of Nigeria, has served as a crucial ecological and economic hub for the neighboring communities [1, 2]. This diverse aquatic ecosystem, rich in marine life, sustains countless individuals and their livelihoods. Nevertheless, this picturesque waterway confronts an escalating peril- pollution [3]. The interplay of industrialization, urban expansion, and increased human activities in the area has raised significant concerns regarding the well-being and sustainability of the Okrika Stretch [4]. However, the once- pristine ecosystem is now facing unprecedented challenges. The transformation of the surrounding region due to rapid industrialization, population growth, and urbanization has led to increased pollution risks [5, 6, 7, 8]. The complex interplay between ecological and human systems in the Bonny River area underscores the need for comprehensive studies like the one presented here.
Okrika, within the Niger Delta’s coastal belt, features a network of rivers, creeks, marshy terrain with diverse vegetation, mainland forests for small-scale farming, substantial rainfall between March and November with a peak in June-August, tidal range typically 1.5-2 meters, fluctuating water levels influenced by lunar cycles, ecological degradation from oil exploration, waste pollution from companies like Port Harcourt Refining Company (PHRC) and Notore Chemical Industries Ltd formerly known as the National Fertilizer Company of Nigeria (NAFCON), the need for deep boreholes due to saltwater intrusion, river and creek drainage into Bonny River, and a trade focus on fish, oil palm products, salt, cassava, taro, plantains, and yams [9].
The sources of trace metals in aquatic environments are manifold. Industrial discharges, agricultural runoff, municipal sewage, and atmospheric deposition are among the primary contributors. These activities introduce metals such as Pb, Ni, Zn, Cu, and Fe into water bodies, where they can persist and accumulate over time [10, 11]. The effects of elevated trace metal concentrations on aquatic ecosystems are multifaceted [12]. They can disrupt the reproductive, physiological, and behavioral patterns of aquatic organisms. Additionally, these pollutants can enter the food web, potentially affecting organisms at higher trophic levels, including humans who rely on aquatic resources for sustenance. Recognizing these risks, regulatory bodies and researchers worldwide have intensified efforts to understand trace metal pollution in aquatic systems and its consequences [13].
The assessment of trace metal concentrations in rivers and estuaries has been a subject of considerable research globally. Studies have focused on different geographic regions, each with its unique environmental characteristics and pollution sources [14]. While some research has reported alarmingly high levels of trace metals in aquatic systems, others have documented relatively lower concentrations, reflecting local variations in pollution intensity and mitigation measures. In the context of Nigeria, research on trace metal pollution in rivers and estuaries has gained prominence [15]. Studies in regions like the Niger Delta and Lagos Lagoon have highlighted the critical importance of understanding trace metal dynamics in these unique ecosystems [16, 17]. However, the Okrika Stretch of Bonny River has received relatively less attention in this regard, necessitating a comprehensive investigation to fill this knowledge gap.
In recent times, trace metals, notably Lead (Pb), Nickel (Ni), Zinc (Zn), Copper (Cu), and Iron (Fe), have emerged as prominent markers of environmental contamination [18]. Despite their natural occurrence, these elements enter aquatic systems through various human-driven activities, including industrial discharges, urban runoff, and agricultural practices. Their accumulation in aquatic environments presents substantial risks to the ecosystem’s health and human well-being [19].
Despite the growing body of research on trace metal pollution in aquatic environments, significant gaps remain in our understanding of the Okrika Stretch of Bonny River. The unique ecological features and localized pollution sources of this region demand specific attention. Previous studies in the broader Niger Delta region may not fully capture the nuances of trace metal distribution and their impacts on the Okrika Stretch. This study embarks on an in-depth investigation into trace metal concentrations as indicators of pollution within the Okrika Stretch of the Bonny River. Through the examination of various environmental components such as water, sediment, oysters, and periwinkles, we endeavor to unravel the intricate dynamics of trace metal distribution and their potential impacts on this vital ecosystem.
This research aims to bridge these gaps by providing a detailed assessment of trace metal concentrations in various environmental components within the Okrika Stretch. By doing so, it seeks to contribute valuable insights into the current state of pollution in this critical ecosystem, identify potential pollution sources, and assess the implications for both the environment and the human communities that depend on it. In doing so, this study addresses a pressing need for localized data to inform effective environmental management and conservation efforts in the Bonny River region.
Experimental
Description of the Study Area
The research was conducted within the Okrika Local Government Area of Rivers State. According to the Encyclopedia Britannica, Okrika is a town and port in southern Nigeria [20]. Okrika is a riverine and intertidal wetland located on the northern bank of the Bonny River, approximately 56 kilometers (35 miles) upstream from the Bight of Benin in the Eastern Niger Delta region of Nigeria. It
has an average elevation of 452 meters. Access to the town is possible via water vessels with a maximum draft of 9 meters (29 feet) or less. Okrika is positioned between latitude 4° 35’ to 4° 50’ and longitude 07° 15’ East of the meridian. It encompasses an area of 1,299.26 square kilometers and falls within the geographical coordinates of latitude 04° 40’ to 05° 00’ North and longitude 07° 00’ to 07° 15’ East, covering a total area of 1,277.94 square kilometers.
Description of Sample Locations
Five sampling points were selected, including a control site as indicated in Figure 1, which is detailed in Table 1.
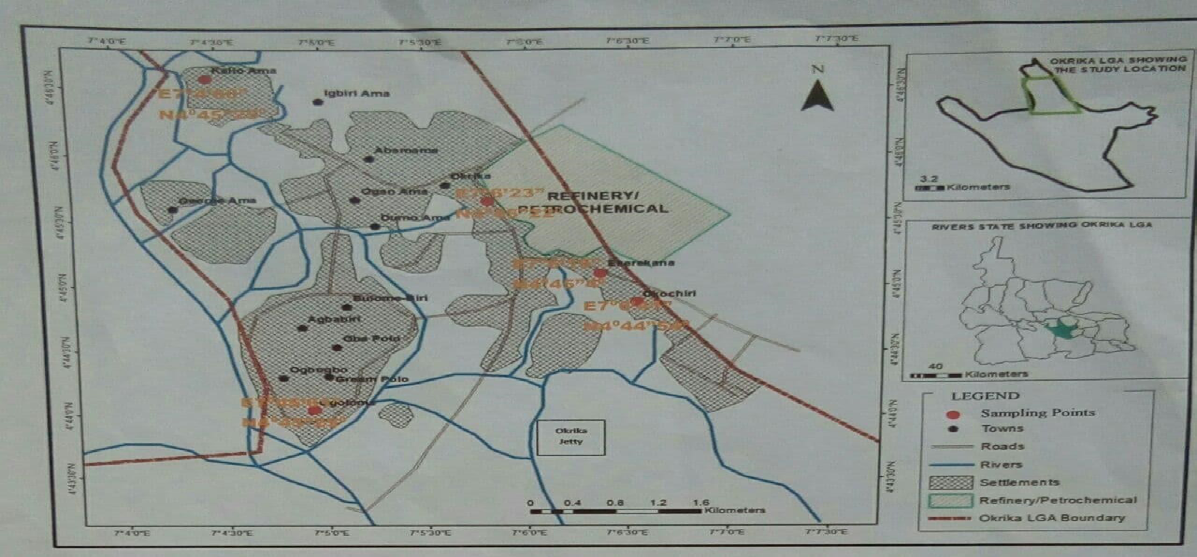
| S/N | Location | Description | Coordinates |
|---|---|---|---|
| 1 | PREW | Port-Harcourt Refinery Effluent/Wastewater Outfall | 4045’2.28N 706”13.23E |
| 2 | EKC | Ekerekana surface water | 4045”3.62N 706”14.99E |
| 3 | OKC | Okochiri surface water | 4044”53.7N 706”40.98E |
| 4 | KOC | Kalio/Okpoka surface water | 4045”24.69N 704”59.85E |
| 5 | CSOC | Control site: Ogoloma – control | 4045”24.69N 704”59.85E |
Table 1: Description of Sample Locations and their Codes. Source: Wikipedia
Pre-field Activities
Before collecting samples from the designated sampling sites, glass stopper reagent bottles, and 1-liter plastic containers were meticulously cleaned, rinsed with distilled water, appropriately labeled, and stored in a cooling container. Similarly, the polyethylene bags were cleaned and labeled accordingly. Continuous monitoring of the river ensured sample collection during low tide, which is the phase when the river reaches its lowest water level.
Collection of Surface Water Samples
Water samples were gathered haphazardly beneath the surface layer at four distinct locations and the control site, employing previously cleaned 1-liter plastic containers. These samples were thoroughly blended for subsequent examination of trace metals. To maintain the stability of trace metals’ oxidation states and prevent their adsorption onto the container’s surface before laboratory analysis, each water sample was treated with 2 ml of concentrated nitric acid.
Collection of Effluent/wastewater Samples
Effluent and wastewater samples were obtained from the refinery discharge channel using pre-leached 1-liter plastic containers that had been rinsed with the same effluent to be collected. Before collecting the samples, the containers were washed with the industrial effluent. Subsequently, these samples were transported to the laboratory and preserved by deep-freezing at -20°C.
Collection of Sediment Samples
Sediment samples were gathered during low tide using an Eckmann grab sampler as per the APHA guidelines from 1975. These samples were transported to the laboratory in polyethylene bags that had been pre-rinsed with acid and were stored by freezing. The sediment samples designated for total petroleum hydrocarbon analysis were placed in clear glass bottles that had been thoroughly cleaned to prevent contamination. These bottles were stored at 4°C within an ice pack during transportation to the laboratory for analysis.
Collection of Shellfish Samples
Periwinkles (Tympanotous fuscatus) were manually collected a few centimeters below the sediment’s surface. Oysters (Crossostrea gasar) were scraped off from Mangrove trees and other solid surfaces in the Kalio/Okpoka River, followed by a rinse with river water. These Periwinkle and Oyster samples were transported to the laboratory in an ice pack and subsequently washed with distilled water. All samples were then stored in a deep freezer in preparation for further analysis.
Sample Preparation and Determination of Trace Metal Ions
Sample Preparation and Determination of Trace Metal Ions in Water: A 100 ml portion of each representative water sample underwent digestion in a conical flask with the addition of 5 ml HNO3 in a fume hood. After gradual heating and evaporation on a hot plate to a volume of about 20 ml, cooling occurred, followed by the introduction of an additional 5 ml of concentrated nitric acid until complete digestion, evident by a clear, light-colored solution. The flask’s inner walls were rinsed with deionized water, and filtration through 0.2 mm Whatman filter paper was performed. The filtrate was transferred to a 100ml volumetric flask and adjusted to the mark.
Absorbance measurements were taken using a Buck Scientific Model 200A Atomic Absorption Spectrometer (AAS) with an air-acetylene flame against standard solutions. For major cations, preconcentrated sample extracts were used. A serially diluted mixed standard solution containing 1.00mg of the metal ion in 1 ml of stock solution was employed. The metal ion concentrations, including major cations in effluent and wastewater, were determined as described APHA [21], with values read directly from the extrapolated calibration curve. Sample Preparation and Determination of Trace Metal Ions in Sediment Sediment samples were air-dried at room temperature, crushed, and sifted through a 0.5 mm sieve for trace metal analysis. One gram (1 g) of the sifted sediment was precisely weighed using a high-precision balance and placed into a 100 ml conical flask.
Subsequently, 1g of the weighed sediment was transferred to another 100 ml conical flask for digestion. In a fume hood, 10 ml of 1:1 HNO3 and hydrogen peroxide were added to the sample, followed by heating at 95°C on a hot plate. Afterward, 2 ml of water and 3 ml of hydrogen peroxide were introduced, and the mixture was covered and heated until effervescence ceased. After cooling, it was filtered into a 50 ml volumetric flask using Whatman No. 1 filter paper, with the volume made up to the mark using distilled water. The concentrations of Lead (Pb), Zinc (Zn), Iron (Fe), Nickel (Ni), Copper (Cu), Calcium (Ca), Magnesium (Mg), Sodium (Na), and Potassium (K) were determined using a Buck Scientific Model 200A Spectrophotometer equipped with an air-acetylene flame (AAS). The values were obtained directly from the extrapolated calibration curve within the system.
Sample Preparation and Determination of Trace Metal Ions in Shellfish
The shells of both Periwinkles (Tympanotous fuscatus) and Oysters (Crossostrea gasar) were cracked open, their tissues removed, thoroughly rinsed with distilled water, and then dried to a constant weight at 105°C using a technicolour oven. The individual tissue samples were subsequently homogenized. To initiate the analysis, 1g of the oven-dried sample was meticulously weighed using a high-precision microscope and placed into a digestion flask.
The sample underwent acid digestion using a mixture of HClO3, HNO3, and H2SO4 acids in a ratio of 1:3:1. This digestion process involved heating the mixture in a water bath until it approached dryness. After cooling, the resulting digest was carefully decanted into a 100 ml volumetric flask and topped up to the mark. The concentrations of Pb, Zn, Fe, Ni, Cu, Ca, Mg, Na, and K were determined using a Buck Scientific Model 200A Spectrophotometer equipped with an air-acetylene flame, with values obtained directly from the extrapolated calibration curve within the system.
Statistical Data Analysis
Statistical data analysis was implemented with two primary objectives: firstly, to provide a comprehensive understanding of the collected data, and secondly, to evaluate and test hypotheses related to the characteristics of the system. This analysis encompassed various techniques including multivariate analysis of variance (MANOVA), descriptive statistics, and the calculation of Pearson’s product-moment correlation coefficient. To conduct the statistical procedures, Microsoft Excel and SPSS 25.0 Analysis Tool Pak Software were utilized, with statistical significance levels set at both 0.05 and 0.01.
Results and Discussion
Trace Metals in Water
The results of the trace metals from the different locations in the water of the Okrika stretch of Bonny River are shown in Tables 2a and 2b.
| Metal | DPR | WHO | CSOC | PREW | EKC | OKC | KOC |
|---|---|---|---|---|---|---|---|
| Iron (mg/l) | 1 | 0.3 | 1.659±0.257 | 2.170±0.052 | 1.620±0.164 | 1.226±0.079 | 2.232±0.083 |
| Zinc (mg/l) | 1 | 3 | 0.071±0.00 | 0.071±0.00 | 0.071±0.00 | 0.071±0.00 | 0.071±0.00 |
| Nickel (mg/l) | 0.015 | 0.02 | 0.395±0.031 | 0.071±0.002 | 0.056±0.0065 | 0.228±0.031 | 0.245±0.032 |
| Lead (mg/l) | 0.01 | 0.01 | 0.071±0.012 | 0.035±0.012 | 0.037±0.0055 | 0.023±0.003 | 0.072±0.003 |
| Copper (mg/l) | 0.01 | 0.5 | 0.044±0.009 | 0.025±0.006 | 0.026±0.00308 | 0.122±0.017 | 0.049±0.0033 |
Table 2a: Mean trace metal levels (mg/l) in the water of the Okrika stretch of Bonny River in the dry season. DPR: Department of Petroleum Resources. WHO: World Health Organisation. CSOC: Control Station Ogoloma Creek PREW: Port Harcourt Refinery effluent/wastewater outfall. EKC: Ekerekana creek. OKC: Okochiri creek. KOC: Kalio/Okpoka creek.
| Metal | DPR | WHO | CSOC | PREW | EKC | OKC | KOC |
|---|---|---|---|---|---|---|---|
| Zinc (mg/l) | 1 | 3 | 0.071±0.045 | 0.0705±0.0027 | 0.071±0.045 | 0.037±0.0032 | 0.071±0.045 |
| Iron (mg/l) | 1 | 0.3 | 1.178±0.095 | 2.9156±0.155 | 2.916±0.098 | 2.274±0.072 | 2.155±0.015 |
| Nickel (mg/l) | 0.015 | 0.02 | 0.221±0.006 | 0.0705±0.0031 | 0.071±0.003 | 0.037±0.011 | 0.159±0.043 |
| Lead (mg/l) | 0.01 | 0.01 | 0.038±0.015 | 0.012±0.001 | 0.012±0.004 | 0.023±0.0021 | 0.071±0.004 |
| Copper (mg/l) | 0.01 | 0.5 | 0.027±0.004 | 0.020±0.001 | 0.033±0.006 | 0.037±0.002 | 0.036±0.005 |
Table 2b: Mean trace metal levels (mg/l) in the water of the Okrika stretch of Bonny River in the wet season. DPR: Department of Petroleum Resources. WHO: World Health Organisation. CSOC: Control Station Ogoloma Creek PREW: Port Harcourt Refinery effluent/wastewater outfall. EKC: Ekerekana creek. OKC: Okochiri creek. KOC: Kalio/Okpoka creek.
The results for trace metal concentrations in the surface water of the Okrika stretch of the Bonny River are presented in Tables 4.2a and 4.2b above. During the dry season, Zinc exhibited a consistent mean concentration of 0.071mg/l across all sampled locations, including both effluent samples and the control site. In contrast, during the wet season, the range varied from 0.037±0.003 to 0.071±0.045mg/l, with effluent/wastewater samples registering 0.0705±0.0027mg/l, and the control location recording 0.071±0.045mg/l.
Appreciable trace metal values were found in both the effluent and surface water of the Okrika stretch of the Bonny River. Zinc levels in all locations and effluent samples were below the permissible limit of 1mg/l set by DPR/FMENV, suggesting the absence of anthropogenic sources. These values were slightly lower than those reported in Sagbama Creek and an oilfield in the Niger Delta. Excessive zinc intake can lead to health issues [22].
Iron concentrations in effluent and all sampled locations exceeded the permissible limit, likely due to corrosion from abandoned sea vessels. Although essential for humans, high iron levels can harm aquatic life. Iron is vital for mammals, aiding oxygen transport and blood functions. However, it can damage fish gills and reduce oxygen intake in water bodies [23]. The mean concentrations in the dry season ranged from 1.226±0.079 to 2.232±0.083mg/l, with the highest value observed at location 3 (KOC) and the lowest at location 2 (OKC). Effluent/wastewater samples yielded 2.170±0.052mg/l, while the control location showed 1.781±0.419mg/l. In the wet season, the range extended from 2.155±0.015 to 2.916±0.098mg/l, with the highest value at location 1 (EKC) and the lowest at location 3 (KOC). Effluent/wastewater samples recorded 2.916±0.155mg/l, while the control location had 1.178±0.095mg/l.
Nickel levels in all samples exceeded permissible limits, possibly due to various anthropogenic activities. The observed concentrations were lower than those in Silver River but higher than in Edagberi Creek. Even at trace levels, Nickel intake can lead to toxicity symptoms [24, 25]. Nickel concentrations during the dry season varied from 0.056±0.0065 to 0.245±0.032mg/l, with the highest value at location 3 (KOC) and the lowest at location 1 (EKC). Effluent/ wastewater samples showed 0.071±0.002mg/l, while the control location displayed 0.199±0.140mg/l. In the wet season, Nickel concentrations ranged from 0.037±0.011 to 0.159±0.043mg/l, with the highest value at location 3 (KOC) and the lowest at location 2 (OKC). Effluent/wastewater samples registered 0.071±0.003mg/l, while the control location showed 0.221±0.006mg/l.
Lead concentrations in the dry season ranged from 0.023±0.003 to 0.072±0.003mg/l, with effluent/ wastewater at 0.035±0.012mg/l and the control location at 0.047±0.022mg/l. In the wet season, Lead concentrations varied from 0.012±0.004 to 0.071±0.004mg/l, with the highest values recorded at location 3 (KOC). Lead values at all locations and effluent samples exceeded standard limits, potentially from petroleum products and urban waste. Lead is harmful to human health, affecting the nervous, reproductive, and renal systems, as well as causing high blood pressure and anemia [26, 27, 28].
Copper exhibited mean concentrations in the dry season ranging from 0.026±0.003 to 0.122±0.017mg/l, with effluent/ wastewater at 0.025±0.006mg/l and the control location at 0.053±0.040mg/l. In the wet season, Copper concentrations ranged from 0.033±0.006 to 0.0370.002mg/l, with effluent/ wastewater at 0.020±0.001mg/l and the control location at 0.027±0.004mg/l. Throughout both seasons, location 2 (OKC) consistently had the highest values, while location 1 (EKC) exhibited the lowest values. Copper levels in samples exceeded permissible limits, possibly from exploration, mining, manufacturing, and other sources. While essential for metabolic processes, excessive copper intake can lead to anemia and organ damage [29, 30]. Copper is crucial for metabolic processes and overall health, but excessive intake can cause health issues [29].
Trace Metals and TPH in Sediment
The results of the trace metals and TPH from the different locations in the sediment of the Okrika stretch of Bonny River are shown in Tables 3a and 3b.
| Parameter | FMENV | CSOC | PREW | EKC | OKC | KOC |
|---|---|---|---|---|---|---|
| TPH (mg/kg) 50-5000 | 65.652±1.61 | 1689.00±19.85 | 866.867±7.83 | 1846.500±28.76 | 84.668±6.46 | |
| Calcium (mg/kg) | N/A | 2.117±0.046 | 16.373±0.386 | 4.405±0.243 | 5.354±0.372 | 1.645±0.035 |
| Magnesium (mg/kg) | N/A | 3.288±0.226 | 5.406±0.363 | 3.529±0.172 | 5.163±0.102 | 4.158±0.075 |
| Sodium (mg/kg) | N/A | 65.976±2.161 | 5.175±0.111 | 34.504±1.333 | 64.401±2.627 | 64.288±3.348 |
| Potassium (mg/kg) | N/A | 24.138±1.317 | 2.283±0.316 | 3.344±0.376 | 7.466±3.061 | 19.231±1.045 |
| Zinc (mg/kg) | N/A | 2.235±0.080 | 3.154±1.636 | 1.265±0.013 | 0.394±0.079 | 0.214±0.014 |
| Iron (mg/kg) | N/A | 80.389±1.592 | 77.113±32.100 | 55.892±12.716 | 92.764±8.474 | 83.830±4.935 |
| Nickel (mg/kg) | 140 | 0.248±0.017 | 0.268±0.017 | 0.123±0.023 | 0.268±0.0163 | 0.240±0.031 |
| Lead (mg/kg) | 35 | 0.069±0.006 | 0.041±0.006 | 0.115±0.017 | 0.073±0.0037 | 0.042±0.003 |
| Copper (mg/kg) | 0.3 | 0.119±0.056 | 0.061±0.015 | 0.127±0.010 | 0.072±0.035 | 0.111±0.0106 |
Table 3a: Mean concentrations (mg/kg) of trace metals and TPH in sediments of the Okrika stretch of Bonny River in the dry season.
| Parameters | DPR/ FMENV | CSOC | PREW | EKC | OKC | KOC |
|---|---|---|---|---|---|---|
| TPH (mg/kg) | 50-5000 | 73.825±24.1 | 1244.500±22761 | 67.522±18.29 | 690.833±9.57 | 70.815±6.33 |
| Calcium (mg/kg) | N/A | 2.597±0.085 | 11.470±0.777 | 3.284±0.275 | 4.583±0.153 | 2.282±0.143 |
| Magnesium (mg/kg) | N/A | 4.416±0.081 | 3.212±0.102 | 625.580±124768 | 5.050±0.146 | 4.948±0.218 |
| Sodium (mg/kg) | N/A | 73.427±2.186 | 6.997±0.137 | 30.218±1.940 | 50.726±6.806 | 75.027±6.161 |
| Potassium (mg/kg) | N/A | 11.930±0.439 | 1.702±0.161 | 410.624±68.768 | 2.498±0.305 | 13.676±0.520 |
| Zinc (mg/kg) | N/A | 1.475±0.60 | 1.722±0.198 | 0.703±0.100 | 0.761±0.125 | 1.316±0.197 |
| Iron (mg/kg) | N/A | 73.720±3.357 | 71.723±6.665 | 45.185±2.630 | 148.500±14.039 | 62.700±3.24 |
| Nickel (mg/kg) | 140 | 0.230±0.015 | 0.188±0.015 | 0.191±0.269 | 0.219±0.021 | 0.199±0.011 |
| Lead (mg/kg) | 35 | 0.033±0.003 | 0.049±0.004 | 0.075±0.005 | 0.045±0.006 | 0.042±0.004 |
| Copper | 0.3 | 0.0700.009 | 0.068±0.030 | 0.090±0.0036 | 0.040±0.003 | 0.081±0.003 |
Table 3b: Mean concentrations (mg/kg) of trace metals and TPH in sediments of the Okrika stretch of Bonny River in the wet season.
Tables 3a and 3b present the analytical findings for trace metal concentrations in the sediments of the Okrika stretch of the Bonny River.
In the dry season, Calcium exhibited a range from 1.645±0.035 to 5.354±0.372mg/kg, with effluent/ wastewater samples at 16.373±0.386mg/kg and the control location at 2.117±0.046mg/kg. During the wet season, values spanned from 2.282±0.143 to 4.583±0.153mg/kg, with effluent/wastewater samples registering 11.470±0.777mg/ kg and the control location at 2.597±0.085mg/kg. The concentrations of calcium in various sampling locations and effluent/wastewater were below the World Health Organization (WHO) recommended maximum of 200mg/l, which can lead to calcium carbonate deposition in water systems. Sediment calcium levels in this study were higher than those reported in Rivers Doma, Farinruwa, and Mada. Calcium and magnesium are predominant minerals in aquatic ecosystems, with calcium playing a coordinating role among inorganic elements [31].
Magnesium concentrations in the dry season ranged from 3.529±0.172 to 5.163±0.102mg/kg, with effluent/ wastewater at 5.406±0.363mg/kg and the control location at 3.288±0226mg/kg. In the wet season, the values extended from 4.948±0.218 to 625.580±124.768mg/kg, with effluent/wastewater at 3.212±0.102mg/l and the control location at 4.416±0.081mg/kg. Magnesium values met the World Health Organization (WHO) permissible limit except at location 1 (EKC) in the wet season. Potassium and sodium concentrations in sediments were higher than those reported in Rivers Doma, Farinruwa, and Mada [32]. Potassium levels in the sediments during the dry season showed a range of 3.344±0.376 to 19.231±1.045mg/kg, with effluent/wastewater at 2.283±0.316mg/kg and the control location at 24.138±1.317mg/kg. In the wet season, the range was 2.498±0.305 to 410.624±68.768mg/kg, with effluent/ wastewater at 1.722±0.161mg/kg and the control location at 11.930±0.439mg/kg.
Sodium values obtained from various sediment samples in the dry season ranged from 34.504±1.333 to 64.401±2.627mg/kg, with effluent/wastewater at 5.175±0.111mg/kg and the control location at 65.976±2.161mg/kg. In the wet season, it spanned from 30.218±1.940 to 75.027±6.161mg/kg, with effluent/ wastewater at 6.997±0.137mg/kg and the control location at 73.427±2.186mg/kg.
For Zinc (Zn), in the dry season, results ranged from 0.214±0.014 to 1.265±0.013mg/kg, with the highest value at location 1 (EKC) and the lowest at location 3 (KOC). Effluent/wastewater had 3.154±1.636mg/kg, while the control location showed 2.235±0.080mg/kg. During the wet season, values varied from 0.703±0.100 to 1.316±0.197mg/ kg, with the highest value at location 3 (KOC) and the lowest at location 1 (EKC). Effluent/wastewater samples recorded 1.722±0.198mg/kg, while the control location displayed
1.475±0.600mg/kg. Zinc values in all sampling locations and the effluent sample were below the USEPA standard limit of 121mg/kg, suggesting no current sediment contamination. These values were lower than those reported in Ikpoba River Dam [33]. High zinc levels can lead to gastrointestinal discomfort, diarrhea, and anemia in humans and animals [29].
Iron concentrations in the dry season ranged from 55.892±12.716 to 92.764±8.474mg/kg, with effluent/ wastewater at 77.113±32.100mg/kg and the control location at 80.389±1.592mg/kg. In the wet season, values extended from 45.185±2.630 to 148.500±14.039mg/kg, with effluent/ wastewater at 71.723±6.665mg/kg and the control location at 73.720±3.357mg/kg. In both seasons, location 2 (OKC) consistently had the highest values, while location 1 (EKC) exhibited the lowest values. Iron levels in sediments at all locations and effluent samples were lower than the DPR permissible limit of 38000mg/kg. These values were lower than those reported in the New Calabar River and Silver River but higher than those in the Bonny River [34].
Nickel concentrations during the dry season ranged from 0.123±0.023 to 0.268±0.0163mg/kg, with the highest value at location 2 (OKC) and the lowest at location 1 (EKC). Effluent/wastewater had 0.268±0.017mg/kg, while the control location showed 0.248±0.017mg/kg. In the wet season, it ranged from 0.191±0.269 to 0.219±0.021mg/kg, with the highest value at location 2 (OKC) and the lowest at location 1 (EKC). Effluent/wastewater samples registered 0.188±0.015mg/kg, while the control location had 0.230±0.015mg/kg. Nickel concentrations in all locations and the effluent sample were below DRR and USEPA permissible limits. These values were lower than those reported in Kalabari Creeks and New Calabar River [35].
Lead concentrations in the dry season ranged from 0.042±0.003 to 0.115±0.017mg/kg, with effluent/ wastewater at 0.041±0.006mg/kg and the control location at 0.069±0.006mg/kg. In the wet season, it spanned from 0.042±0.004 to 0.075±0.005mg/kg, with effluent/ wastewater at 0.049±0.004mg/kg and the control location at 0.033±0.003mg/kg. The highest level of lead in both seasons was observed at location 1 (EKC), while the lowest values were obtained at location 3 (KOC). Lead levels in sediments were below USEPA and DPR permissible limits, indicating no danger level for lead in creek sediments. These values were lower than those reported Davies OA [36]. Pb is a toxic metal that poses threats to fisheries and plant growth [37, 38].
Copper concentrations in sediment samples during the dry season ranged from 0.072±0.035 to 0.127±0.010mg/ kg, with effluent/wastewater at 0.061±0.015mg/kg and the control location at 0.119±0.056mg/kg. In the wet season, values varied from 0.040±0.003 to 0.090±0.0036mg/kg, with effluent/wastewater at 0.068±0.030mg/kg and the control location at 0.070±0.009mg/kg. In both dry and wet seasons, location 1 (EKC) consistently had the highest concentration of copper, while location 2 (OKC) exhibited the lowest concentration. Copper levels in sediments were below USEPA and DPR permissible limits, suggesting no contamination of creek sediments. Seasonal variation was significant, with values lower than those reported in Kalabari creeks and New Calabar River [39].
Trace Metals and TPH in Oyster
The results of the trace metals and TPH from the different locations in the oyster of the Okrika stretch of Bonny River are shown in Tables 4a and 4b.
| Parameters/Units | WHO | Range | Mean ± SD |
|---|---|---|---|
| TPH (mg/kg) | N/A | 358 – 603 | 534 ± 97.114 |
| Calcium (mg/kg) | N/A | 36.678 – 38.638 | 37.91967 ± 0.685 |
| Magnesium (mg/kg) | N/A | 8.046 – 9.004 | 8.7495 ± 0.358 |
| Sodium (mg/kg) | N/A | 66.96 – 72.379 | 69.00583 ± 2.05 |
| Potassium (mg/kg) | N/A | 30.78 – 32.138 | 31.72467 ± 0.519 |
| Zinc (mg/kg) | 0.1 | 9.896 – 10.689 | 10.17033 ± 0.297 |
| Iron (mg/kg) | 0.5 | 6.996 – 7.901 | 7.5915 ± 0.341 |
| Nickel (mg/kg) | N/A | 0.0183 – 0.1743 | 0.12186 ± 0.600 |
| Lead (mg/kg) | N/A | 0.003 – 0.04 | 0.0305 ± 0.014 |
| Copper (mg/kg) | 0.3 | 0.328 – 0.489 | 0.395833 ± 0.055 |
Table 4a: Concentrations (mg/kg) of trace metals and TPH in oysters of the Okrika stretch of Bonny River in the dry season. Indications: N/A: Not Applicable
| Parameters/Units | WHO | Range | Mean ± SD |
|---|---|---|---|
| TPH (mg/kg) | N/A | 254 – 425 | 336.3333 ± 65.185 |
| Calcium (mg/kg) | N/A | 24.054 – 28.387 | 26.08783 ± 1.393 |
| Magnesium (mg/kg) | N/A | 3.823 – 4.428 | 4.0095 ± 0.255 |
| Sodium (mg/kg) | N/A | 18.578 – 47.389 | 31.28033 ± 9.277 |
| Potassium (mg/kg) | N/A | 16.384 – 17489 | 16.93983 ± 0.316 |
| Zinc (mg/kg) | 0.1 | 2.19 – 3.017 | 2.574333 ± 0.316 |
| Iron (mg/kg) | 0.5 | 4.974 – 6.142 | 5.508667 ± 0.470 |
| Nickel (mg/kg) | N/A | 0.105 – 0.138 | 0.119 ± 0.014 |
| Lead (mg/kg) | N/A | 0.03 – 0.048 | 0.038667 ± 0.006 |
| Copper (mg/kg) | 0.3 | 0.389 – 0.528 | 0.434 ± 0.048 |
Table 4b: Concentrations (mg/kg) of trace metals and TPH in oysters of the Okrika stretch Bonny River in the wet season. Indications: N/A: Not Applicable The trace metal and TPH concentrations in oysters from the Okrika stretch of the Bonny River are detailed in Tables 4a and 4b above. During the dry season, Zinc concentrations spanned from 9.896 to 10.689mg/kg, with an average of 10.170±0.297. In the wet season, these values ranged from 2.19 to 3.017mg/kg, averaging 2.574±0.316.Iron content in the dry season ranged from 6.996 to 7.901mg/kg, with a mean of 7.5915±0.341, while in the wet season, it varied from 4.974 to 6.142mg/kg, with an average of 5.509±0.47.For Nickel, concentrations during the dry season ranged from 0.0183 to 0.174mg/kg, with an average of 0.12186±0.060005. In the wet season, these values extended from 0.105 to 0.138mg/ kg, averaging 0.119±0.014. Lead concentrations in the dry season ranged from 0.003 to 0.04mg/kg, with an average of 0.0305±0.0143. During the wet season, these values spanned from 0.03 to 0.048mg/kg, with an average of 0.0387±0.0061. Copper content ranged from 0.328 to 0.489mg/kg, with an average of 0.3958±0.0545 during the dry season. In the wet season, these values varied from 0.389 to 0.528mg/kg, averaging 0.434±0.0479.
The average concentrations of zinc (Zn) and iron (Fe) in oysters were notably higher compared to other analyzed metals. The general order of mean metal concentrations in oysters followed a descending order of Zn > Fe > Cu > Ni > Pb. Oysters are known to be strong accumulators of Zn due to their essential role as a cofactor for metabolic enzymes [40]. It has been reported that oysters can concentrate up to 50 times more Zn than found in the bottom sediments, suggesting significant accumulation, possibly due to slow depuration mechanisms in oysters [41]. The uptake of copper (Cu) by oysters is correlated with the surrounding copper concentration, and lower Cu concentration may reflect the limited Cu content in the sediment and water of the studied area [42].
In contrast, the concentrations of both nickel (Ni) and lead (Pb) in oysters were relatively low, likely influenced by the low environmental levels of these metals in the water body. The bioaccumulation patterns of trace metals in periwinkles and oysters differed, with periwinkles showing a higher accumulation of Ni, Fe, Zn, Pb, and Cu in the order of Ni > Fe > Zn > Pb > Cu. Oysters, on the other hand, accumulated these metals in the order of Fe > Ni > Pb > Zn > Cu. Bioaccumulation factors for copper in both periwinkles and oysters were less than 1, indicating no contamination by copper. However, Fe, Ni, and Pb had bioaccumulation factor values greater than 1, suggesting an increase beyond the threshold level. This variation in bioaccumulation patterns among species may be due to specific factors influencing metal uptake and digestion, sediment composition, and feeding habits [43].
The study highlights the potential of periwinkles as indicator species for monitoring trace metal pollution in the aquatic ecosystem due to their higher metal accumulation compared to oysters, a finding in agreement with previous research [44, 45, 46, 47].
Trace Metals and TPH in Periwinkle
The results of the trace metals and TPH from the different locations in the periwinkle of the Okrika stretch of Bonny River are shown in Tables 5a and 5b.
| Parameters/Units | WHO | Range | Mean ± SD |
|---|---|---|---|
| TPH (mg/kg) | N/A | 254 – 425 | 336.3333 ± 65.185 |
| Calcium (mg/kg) | N/A | 24.054 – 28.387 | 26.08783 ± 1.393 |
| Magnesium (mg/kg) | N/A | 3.823 – 4.428 | 4.0095 ± 0.255 |
| Sodium (mg/kg) | N/A | 18.578 – 47.389 | 31.28033 ± 9.277 |
| Potassium (mg/kg) | N/A | 16.384 – 17489 | 16.93983 ± 0.316 |
| Zinc (mg/kg) | 0.1 | 2.19 – 3.017 | 2.574333 ± 0.316 |
| Iron (mg/kg) | 0.5 | 4.974 – 6.142 | 5.508667 ± 0.470 |
| Nickel (mg/kg) | N/A | 0.105 – 0.138 | 0.119 ± 0.014 |
| Lead (mg/kg) | N/A | 0.03 – 0.048 | 0.038667 ± 0.006 |
| Copper (mg/kg) | 0.3 | 0.389 – 0.528 | 0.434 ± 0.048 |
Table 5a: Concentrations (mg/kg) of trace metals and TPH in periwinkle of the Okrika stretch of Bonny River in the dry season.
| Parameters/Units | WHO | Range | Mean ± SD |
|---|---|---|---|
| TPH (mg/kg) | N/A | 69.2 – 108 | 84.85 ± 13.771 |
| Calcium (mg/kg) | N/A | 17.67 – 19.87 | 18.68833 ± 0.789 |
| Magnesium (mg/kg) | N/A | 10 – 10.354 | 10.164 ± 0.155 |
| Sodium (mg/kg) | N/A | 9.98 – 10.43 | 10.24167 ± 0.156 |
| Potassium (mg/kg) | N/A | 4.105 – 4.909 | 4.5135 ± 0.366 |
| Zinc (mg/kg) | 0.1 | 1.042 – 1.249 | 1.1423 ± 0.075 |
| Iron (mg/kg) | 0.5 | 2.85 – 3.439 | 3.192 ± 0.200 |
| Nickel (mg/kg) | N/A | 0.004 – 0.006 | 0.0048 ± 0.0009 |
| Lead (mg/kg) | N/A | 0.023 – 0.044 | 0.0305 ± 0.0072 |
| Copper (mg/kg) | 0.3 | 1 – 1211 | 1.115 ± 0.094 |
Table 5b: Concentrations (mg/kg) of trace metals and TPH in periwinkle of the Okrika stretch of Bonny in the wet season.
The concentrations of trace metals and TPH in periwinkles from the Okrika stretch of the Bonny River are displayed in Tables 5a and 5b above. During the dry season, Zinc levels ranged from 0.25 to 0.475mg/kg, with an average of 0.3915±0.078. In the wet season, these concentrations varied from 1.042 to 1.249mg/kg, averaging 1.142±0.075. In the dry season, zinc concentrations exceeded the 0.5mg/ kg standard limit recommended by FEPA and WHO, while in the wet season, values were below the WHO limit. This suggests a tendency for bioaccumulation and potential harm to aquatic life. Seasonal variation was significant. The values obtained were higher than those reported by Aderinola O, et al. [48] for trace metals in periwinkle from Lagos Lagoon.
Iron values in the dry season ranged from 1.214 to 1.457mg/kg, with an average of 1.33±0.085, while in the wet season, concentrations spanned from 2.85 to 3.439mg/kg, with a mean of 3.192±0.200. Iron values were higher than the WHO recommended limit of 0.5mg/kg for periwinkle and fish. This can be attributed to the natural abundance of iron in Nigerian soils. The values obtained were lower than those reported by Akinrotimi, et al. [45] for selected seafood from Buguma and Ekerekana creeks. Seasonal variation was not significant.
For Nickel, during the dry season, concentrations ranged from 0.006 to 0.008mg/kg, with an average of 0.0068±0.00099. In the wet season, the range was from 0.004 to 0.006mg/kg, averaging 0.0048±0.00098. Nickel values were below the permissible limit of 0.60mg/kg for aquatic organisms. These values were far lower than those reported by Amadi, et al. [46] for periwinkle in Eagle Island River. Consuming periwinkle from the study area may not pose a health threat regarding nickel accumulation. Seasonal variation was significant. Lead concentrations during the dry season varied from 0.066 to 0.074mg/kg, with an average of 0.071±0.0032, while in the wet season, they ranged from 0.023 to 0.0044mg/kg, with a mean of 0.0305±0.0073. Lead values in periwinkle were lower than those reported by Abiaobo, et al. [47] for periwinkle from Uta-ewa creeks. The concentration of lead may not pose immediate health consequences to consumers, but long-term exposure could be a concern since lead does not have any metabolic function according to WHO.
Copper concentrations in periwinkle were lower than the permissible limit of 3.00mg/kg. Copper concentrations in the dry season ranged from 0.089 to 1.303mg/kg, with an average of 0.315±0.484, and in the wet season, they varied from 1 to 1.211mg/kg, averaging 1.115±0.094. The values were slightly lower than those reported by Abiaobo, et al. [47]. Anthropogenic activities in the study area, such as refinery effluents and illegal oil refineries, could introduce copper into the water body, potentially posing health risks if periwinkles with high copper levels are consumed. Copper is essential to human health but can be harmful in excess [47, 49].
Conclusion
The findings from this extensive study of trace metal concentrations in the Okrika stretch of the Bonny River reveal varying levels of contamination in water, sediment, and the tissues of periwinkles and oysters. Seasonal fluctuations were noted, indicating the influence of environmental factors. Zinc levels in surface water remained below permissible limits, while iron concentrations exceeded standards, possibly due to vessel corrosion. Nickel levels surpassed permissible limits, suggesting anthropogenic sources. Lead and copper concentrations in water also exceeded standards, posing health concerns. In sediments, calcium and magnesium levels were within limits, but potassium and sodium concentrations exceeded reported levels elsewhere. Zinc levels in sediments were acceptable, while iron, nickel, lead, and copper remained below permissible limits. Oysters showed significant zinc and iron bioaccumulation, while periwinkles exhibited varying bioaccumulation patterns. The study underscores the need for ongoing monitoring and mitigation efforts to protect the ecosystem and human health in the region.
References
-
Solomon OO, Kunzmann DA (2018) Preliminary Investigation of Length-Weight Relationship and Condition Factor of Periwinkle (TYmpanotonus fuscatus, Linnaeus 1758) from Okrika Estuary, Niger-Delta Area of Nigeria. Int J Fish Aquacult Rese 4(2): 19-28.
-
Watts M (2016) The political ecology of oil and gas in West Africa’s Gulf of Guinea: State, petroleum, and conflict in Nigeria. In: Graaf TVD, et al. (Eds.), The Palgrave handbook of the international political economy of energy. PHIPE, pp: 559-584.
-
Afinotan L A, jakorotu V (2009) The Niger Delta crisis: Issues, challenges and prospects. African journal of political science and international relations 3(5): 191.
-
Austine I A, Tobins UDR (2022) Geo-spatial Analysis of the Impacts of Urbanization-induced Activities on Soil Quality in Port Harcourt Metropolis, Rivers State- Nigeria. Journal of Geographical Research 5(1): 39-54.
-
Frumkin H, Frank LD, Jackson R J (2004) Urban sprawl and public health: Designing, planning, and building for healthy communities. Island Press, USA.
-
Chan NW, Rindam M, Yusof R, Ao M, Foo KY (2018) Water management in cities. Sustainable urban development textbook, pp: 9-34.
-
Plessis AD (2017) Freshwater challenges of South Africa and its Upper Vaal river. Springer Water, Berlin, Germany, pp: 129-151.
-
Plessis AD, Plessis AD (2017) Freshwater challenges of South Africa and its upper Vaal River: current state and outlook. 1st(Edn.), Springer Link, 13: 164.
-
Ladipo AM (2023) Niger River: river, Africa. Encyclopedia Britannica.
-
Suthar S, Nema AK, Chabukdhara M, Gupta SK (2009) Assessment of metals in water and sediments of Hindon River, India: impact of industrial and urban discharges. Journal of Hazardous materials 171(1-3): 1088-1095.
-
Man X, Huang H, Chen F, Gu Y, Liang R, et al. (2022) Anthropogenic impacts on the temporal variation of heavy metals in Daya Bay (South China). Marine Pollution Bulletin 185: 114209.
-
Lamine I, Chahouri A, Mghili B, Moukrim A, Alla AA (2023) Do the individual and population-level traits of Donax trunculus reflect the effects of metal contamination in aquatic environments?. Marine Environmental Research 191: 106134.
-
Sullivan SMP, Rodewald AD (2012) In a state of flux: the energetic pathways that move contaminants from aquatic to terrestrial environments. Environmental Toxicology and Chemistry 31(6): 1175-1183.
-
Ip CC, Li XD, Zhang G, Wai OW, Li YS (2007) Trace metal distribution in sediments of the Pearl River Estuary and the surrounding coastal area, South China. Environmental Pollution 147(2): 311-323.
-
Ekpo BO, Ibok U J (1999) Temporal variation and distribution of trace metals in freshwater and fish from Calabar river, SE Nigeria. Environmental Geochemistry and Health 21(1): 51-66.
-
Awofolu OR (2005) A Survey of Trace Metals in Vegetation, Soil and Lower Animal Along Some Selected Major Roads in Metropolitan City of Lagos. Environmental Monitoring and Assessment 105: 431-447.
-
Uno UA, Ekpo BO, Etuk VE, Etuk HS, Ibok UJ (2013) Comparative study of levels of trace metals in airborne particulates in some cities of the Niger delta region of Nigeria. Environment and Pollution 2(1): 110.
-
Taiwo IE, Henry AN, Imbuf AP, Adetoro OO (2014) Heavy metal bioaccumulation and biomarkers of oxidative stress in the wild African tiger frog, Hoplobatrachus occipitalis. African Journal of Environmental Science and Technology 8(1): 6-15.
-
Aziz KH, Mustafa FS, Omer KM, Hama S, Hamarawf RF, et al. (2023) Heavy metal pollution in the aquatic environment: efficient and low-cost removal approaches to eliminate their toxicity: a review. RSC Advances 13(26): 17595-17610.
-
Britannica T (2009) Okrika. Encyclopedia Britannica.
-
APHA (1998) Standard Methods for the Examination of Water and Wastewater. 20th(Edn.), American Public Health Association, American Water Works Association, and Water Pollution Control Federation, American Public Health Association, Washington DC, USA, pp: 3-22.
-
US Environmental Protection Agency (1980) Ambient water quality criteria for zinc. Environmental Research Laboratories, Corvalis, Oregon Duluth, Minnesota Gulf Breeze, Florida Narragansett, Rhode Island, Washington DC, USA.
-
Gemaque TC, Costa DP, Pereira LV, Filho KCM (2019) Evaluation of Iron Toxicity in the Tropical Fish Leporinus friderici. Biomed J Sci & Tech Res 18(2): 13436-13441.
-
Guidotti TL, McNamara J, Moses MS (2008) The interpretation of trace element analysis in body fluids. Indian Journal of Medical Research 128(4): 524- 532.
-
Cempel M, Nikel G (2006) Nickel: a review of its sources and environmental toxicology. Polish journal of environmental studies 15(3): 375-382.
-
Mahurpawar M (2015) Effects of heavy metals on human health. Int J Res Granthaalayah 530(516): 1-7.
-
Collin MS, Venkatraman SK, Vijayakumar, N, Kanimozhi V, Arbaaz S M, et al. (2022) Bioaccumulation of lead (Pb) and its effects on human: A review. Journal of Hazardous Materials Advances 7: 100094.
-
Ara A,Usmani J A (2015) Lead toxicity: a review. Interdisciplinary toxicology 8(2): 55.
-
Prashanth L, Kattapagari KK, Chitturi T, Baddam VRR, Prasad LK (2015) A review on role of essential trace elements in health and disease. Journal of dr. ntr university of health sciences 4(2): 75-85.
-
Edori OS, Nwoke, IB, Iyama WA (2016) Heavy metals and physico-chemical parameters of selected borehole water from Umuechem, Etche local government area, Rivers State, Nigeria. International Journal of Chemistry and Chemical Engineering 6(1): 45-57.
-
Bang TCD, Husted S, Laursen KH, Persson DP, Schjoerring, JK (2020) The molecular–physiological functions of mineral macronutrients and their consequences for deficiency symptoms in plants. New Phytologist 229(5): 2446-2469.
-
Aremu MO, Atolaiye BO, Gav BL, Opaluwa OD, Sangari DU, et al. (2011) Metal concentrations in sediments and water from Rivers Doma, Farinruwa and Mada in Nasarawa State, Nigeria. J Environ Chem Ecotoxicol 3: 244-251.
-
Oronsaye JAO, Wangboje OM (2010) Trace metals in some benthic fishes of the Ikpoba river dam, Benin City, Nigeria. African Journal of Biotechnology 9.
-
Okoye COB, Ibeto CN (2013) Organic matter and trace metals levels in sediment of bonny river and creeks around Okrika in Rivers State, Nigeria. International Journal of Physical Sciences 8: 652-656.
-
Nwankwoala HO, Angaya YB (2017) An evaluation of heavy metals concentration in the choba section of the new Calabar river, Eastern Niger Delta. Biodiversity International Journal 1(6): 62-68.
-
Davies OA (2009) Sediment Quality of Lower Reaches of Okpoka Creek, Niger Delta, Nigeria. Fisheries Society of Nigeria 26: 12-15.
-
Davies OA, Allison ME, Uyi HS (2006) Bioaccumulation of heavy metals in water, sediment and periwinkle (Tympanotonus fuscatus var radula) from the Elechi Creek, Niger Delta. African Journal of Biotechnology 5(10): 968-973.
-
Farid WAM, Al-Eed AMA, Shihab LAW, Al-Saad HT (2014) Distribution, sources and seasonal variations of hydrocarbons in Shat Al-Arab river water. Journal of International Academic Research and Multidiscipline 2(2): 729-740.
-
Akinrotimi OA, Edun OM (2015) Seasonal variation of heavy metals in selected sea foods from Buguma and Ekerekana creeks, Niger delta. International Journal of Innovative Studies in Aquatic Biology and Fisheries 1(1): 46-53.
-
Frías-Espericueta MG, Ortiz-Arellano MA, Osuna-López JI, Ronson-Paulin JA (1999) Heavy metals in the rock oyster Crassostrea iridescens (Filibranchia: Ostreidae) from Mazatlan, Sinaloa, Mexico. Revista de Biología Tropical 47(4): 843-849.
-
Shi B, Wang T, Zeng Z, Zhou L, You W, et al. (2019) The role of copper and zinc accumulation in defense against bacterial pathogen in the Fujian oyster (Crassostrea angulata). Fish Shellfish Immunol 92: 72-82.
-
Brown KR, McPherson RG (1992) Concentrations of copper, zinc and lead in the Sydney rock oyster, Saccostrea commercialis (Iredale and Roughley) from the Georges River, New South Wales. Science of the Total Environment 126(1-2): 27-33.
-
Jayaprakash M, Kumar RS, Giridharan L, Sujitha SB, Sarkar S K, et al. (2015) Bioaccumulation of metals in fish species from water and sediments in macrotidal Ennore creek, Chennai, SE coast of India: A metropolitan city effect. Ecotoxicology and environmental safety 120: 243-255.
-
Onwuli DO, Ajuru G, Brown AH, Funeface C (2014) The concentration of Lead in periwinkle (Tympanotonos fuscatus) and River sediments in Eagle Island River, Port-Harcourt, Rivers State, Nigeria. American Journal of Environmental protection 2(2): 37-40.
-
Akinrotimi OA, Edun OM, Makind OO (2015) Seasonal variation of heavy metals in selected seafoods from Buguma and Ekerekana creeks Niger Delta. International Journal of Innovative studies in Aquatic Biology and fisheries 1(1): 46-53.
-
Amadi FC, Emeji R, Osere H, Nwisah L (2018) Concentration of nickel in sediment and periwinkle of Eagle Island River, Port Harcourt. Asian journal of fisheries and aquatic research 1(4): 1-5.
-
Abiaobo NO, Asuquo IE (2020) Assessment of heavy metal concentrations in periwinkle (Tympanotonus fuscatus) samples from uta-ewa creek, Imo River estuary, south eastern Nigeria. Journal of Aquaculture and Marine Biology 9(2): 32-35.
-
Aderinola O, Clarke E, Olarinmoye O, Kusemiju V, Anatekhai MA (2009) Heavy metals in surface water, sediments, fish and periwinkles of Lagos lagoon. American Eurasian Journal of Agriculture and Environmental science 7(3): 7-11
-
Stern BR, Solioz M, Krewski D, Aggett P, Aw TC, et al. (2007) Copper and human health: biochemistry, genetics, and strategies for modeling dose-response relationships. Journal of Toxicology and Environmental Health Part B 10(3): 157-222.
- Sense, Gravity, Parity & Chirality in Mathematical Physics
- Quantum Lattice Simulations PHYSICS: Microcircuit Particle Formation and Observable Macroscopic Irreversible Time - A Discrete Lagrangian with Cellular Automata Framework
- Quantum Biology from Biomacromolecule to Cell, and Central Dogma Described by Quantum Theory
- Focus, Agility, Speed and Technology (FAST) for Sustainability and Growth
- Square Root Metric Geometry and Pati-Salam Model in Curved Space-Time
- A Simple System Demonstrating the Mpemba Effect in Classical Mechanics